The platelet-to-lymphocyte (PLR) and neutrophil-to-lymphocyte (NLR) ratios are emerging markers of inflammation. Erythropoietin resistance is associated with increased morbidity and mortality in patients with chronic kidney disease and is influenced by inflammation, among other factors. Therefore, it would be reasonable to expect a relationship between these markers and erythropoietin resistance.
MethodsMulticentre cross-sectional study. The records of the haemodialysis sessions of 534 patients belonging to four of our dialysis centres were studied. 137 patients were excluded, so the final number of patients studied was 397. NLR, PLR and the erythropoietin resistance index (ERI) were calculated.
ResultsThe ERI was divided into quartiles and compared with the mean NLR and PLR of the four groups, with these differences being statistically significant (p=0.00058). In the regression analysis, the NLR value was able to predict ERI significantly (p<0.0001) (R2=0.029). The PLR value also predicted ERI significantly (p<0.0001) (R2=0.103). The ability of PLR to predict erythropoietin resistance was measured with the area under the ROC curve (AUC=0.681) (95% CI, 0.541–0.821). A PLR cut-off point of 125.5 would result in a sensitivity of 80.95% and 42.82% specificity.
ConclusionsBoth PLR and NLR could be considered acceptable markers of erythropoietin resistance. The PLR was a better predictor for the ERI than the NLR.
Los índices plaquetas-linfocito (IPL) y neutrófilo-linfocito (INL) son marcadores emergentes de inflamación. La resistencia a la eritropoyetina está relacionada con una mayor morbimortalidad en los pacientes con enfermedad renal crónica y está influida, entre otros factores, por la inflamación. Por lo tanto, cabría esperar una relación entre estos marcadores y la resistencia a la eritropoyetina.
MétodosEstudio transversal-multicéntrico. Se estudiaron los registros de las sesiones de hemodiálisis de 534 pacientes pertenecientes a 4 de nuestros centros de diálisis. Se excluyó a 137 pacientes, por lo que el número final de pacientes estudiado fue de 397. Se calculó el INL, el IPL y, como medida de resistencia a la eritropoyetina, se calculó el índice de respuesta a la eritropoyetina (IRE).
ResultadosSe dividió el IRE en cuartiles y se compararon con las medias de INL e IPL de los 4 grupos, siendo estas diferencias estadísticamente significativas (p=0,00058). En los análisis de regresión, el valor de INL pudo predecir el IRE de forma significativa (p<0,0001) (R2=0,029). Asimismo, el valor de IPL también predijo el IRE de forma significativa (p<0,0001) (R2=0,103). La capacidad del IPL para predecir resistencia a la eritropoyetina se midió con el área bajo la curva ROC (AUC=0,681) (IC 95%: 0,541-0,821). Un punto de corte de IPL de 125,5 resultaría en un 80,95% de sensibilidad y 42,82% de especificidad.
ConclusionesTanto el IPL como el INL podrían considerarse unos aceptables marcadores de resistencia a la eritropoyetina. El IPL resultó ser un mejor predictor que el INL para el IRE.
Anaemia is a common complication in chronic kidney disease and is associated with a higher comorbidity and mortality.1–4 One of the most significant causes is erythropoietin secretion deficiency.5,6 Therefore, treatment with erythropoiesis-stimulating agents (ESAs) is included within the management of anaemia in these patients.5,7–10
Most patients with chronic kidney disease present an adequate control of their anaemia with medium doses of these drugs.7 However, a significant percentage of them (from 5% to 10%, according to some studies)4,10,11 have higher requirements of ESAs due to multiple causes: iron deficiency, haemolysis, neoplasia, infections, inflammation, vitamin deficiencies, toxins and inadequate dialysis.10,11
This clinical condition, as a whole, is called “erythropoietin resistance”, which is linked to a worse prognosis in patients on haemodialysis.12,13 It is worth highlighting that it is a clinical concept which is difficult to define. An arbitrary, but data-based, definition is that provided by the European guidelines from 1999: “Failure to attain the target haemoglobin concentration while receiving more than 300IU/kg/week or 20,000IU/week of erythropoietin” also specifying “or a continued need for such dosage to maintain the target haemoglobin concentration”.14
Furthermore, the usefulness of the erythropoietin resistance index (ERI) as a good marker of resistance to erythropoietin and a factor associated with occurrence of adverse effects in chronic haemodialysis has been reported.11,15–18 Some groups have established that an erythropoietin resistance index greater than 9IU/kg/week/g/dl could be considered as resistant.19,20 In one study it was demonstrated that ERI values above 15IU/kg/week/g/dl had greater mortality.15 Likewise, other authors have suggested that erythropoietin requirements greater than 109IU/kg/week, without taking into account the haemoglobin values, are a warning sign of possible erythropoietin resistance.21
Moreover, the platelet-to-lymphocyte ratio (PLR) and neutrophil-to-lymphocyte ratio (NLR) are emerging biological markers of inflammation and endothelial dysfunction,11,22 initially applied to heart disease patients22–24 and, more recently, to patients with end-stage chronic kidney disease.11,25,26
Currently, there are few studies on the relationship between these ratios and erythropoietin resistance. One of the most representative includes a sample of 104 patients belonging to a single site.11
The objective of our study was to evaluate the relationship between these ratios and erythropoietin resistance in our prevalent population on chronic haemodialysis.
Materials and methodsDesign and populationThe study protocol was designed in accordance with the Declaration of Helsinki. The data were gathered in a registry which guaranteed the anonymity of the participants and was only known about by the research team.
It was a cross-sectional study carried out at four Avericum centres across the province of Las Palmas (Spain). The records of the haemodialysis sessions of 534 prevalent patients in June 2017 were assessed. The dialysis prescription was 3.5–4h with a blood flow between 300 and 450ml/min, using a standard dialysis concentrate of bicarbonate and high-permeability polyethersulfone haemodialysis filters (Elisio® – Nipro® Model) with a surface area greater than 1.7m2 and an ultrafiltration rate greater than 74ml/h/mmHg). The erythropoiesis-stimulating agent used in all patients was Epoetin Beta (Neorecormon® – Roche Farma AG®).
The exclusion criteria were not receiving treatment with ESAs at the time of the study (n=76) and medical conditions which may have influenced the absolute counts of platelets, lymphocytes and haemoglobin: admission to hospital for an infection, cancer or haematological causes in the previous three months (n=24). Transfusion in the last three months (n=4), active onco-haematological diseases (n=13) and patients undergoing steroid treatment (n=26) were also part of the exclusion criteria. Some of the patients fulfilled more than one exclusion criterion (total number of patients excluded: n=137). Therefore, after applying the criteria, the study sample was 397 patients.
Erythropoietin resistance was defined as those patients who had erythropoietin doses of greater than 20,000IU and haemoglobin values of less than 11g/dl.14
For the PLR calculation, the ratio between the absolute platelet count and the absolute lymphocyte count in the blood count was obtained. In order to obtain the NLR, the ratio between the absolute neutrophil count and the absolute lymphocyte count in the blood count was calculated. And, finally, the ERI was obtained by calculating the weekly dose of erythropoietin (IU) divided by the dry weight (kg) and divided, in turn, by the serum haemoglobin levels (g/dl).11,15,16
Other variables analysed were: albumin, serum iron, transferrin saturation index (TSI) and C-reactive protein (CRP).
Statistical analysisThe R program version 3.3.2 (2017) was used for the statistical analysis (R Foundation for Statistical Computing, Vienna, Austria. URL http://www.R-projet.org/). The results were considered statistically significant if the p-value was less than 0.05. The continuous variables were summarised as mean±standard deviation (normal variables) or median and quartiles (non-normal variables). The categorical variables were summarised as percentages. The normality of the variables was analysed using the Shapiro–Wilk test. The Pearson coefficient was used for correlations. To evaluate whether there were significant differences according to the ERI quartile, the Kruskal–Wallis test was used for quantitative variables, and the chi-square test for categorical variables.
When significant differences were detected between ERI quartiles, the respective post hoc tests were carried out using the Tukey procedure, when the transformation of the variable to the logarithmic scale enabled normality and homoscedasticity to be achieved, or otherwise using the Dunn's test.
To evaluate the predictive ability of the PLR and the NLR on the ERI, regression models were adjusted in which the log (ERI) was used as a response variable. The models were also adjusted for the age, gender and weight of the individual. In the case of the NLR, to evaluate the particular effect of the neutrophil and lymphocyte counts (which are part of the NLR definition), these variables were introduced into the regression model and a step-by-step method was applied to select the set of variables with the best predictive ability. A similar procedure was carried out with the PLR, introducing in this case the platelets and lymphocytes as additional variables to then apply the step-by-step procedure.
Likewise, in order to carry out an analysis of the ability of the PLR to diagnose erythropoietin resistance, a logistic regression model, adjusted for age and gender, was estimated. A step-by-step method was also applied to simplify the model and to eliminate non-explanatory variables. The calculation of the ROC curve was carried out when only the PLR was used as the diagnostic criterion to predict erythropoietin resistance.
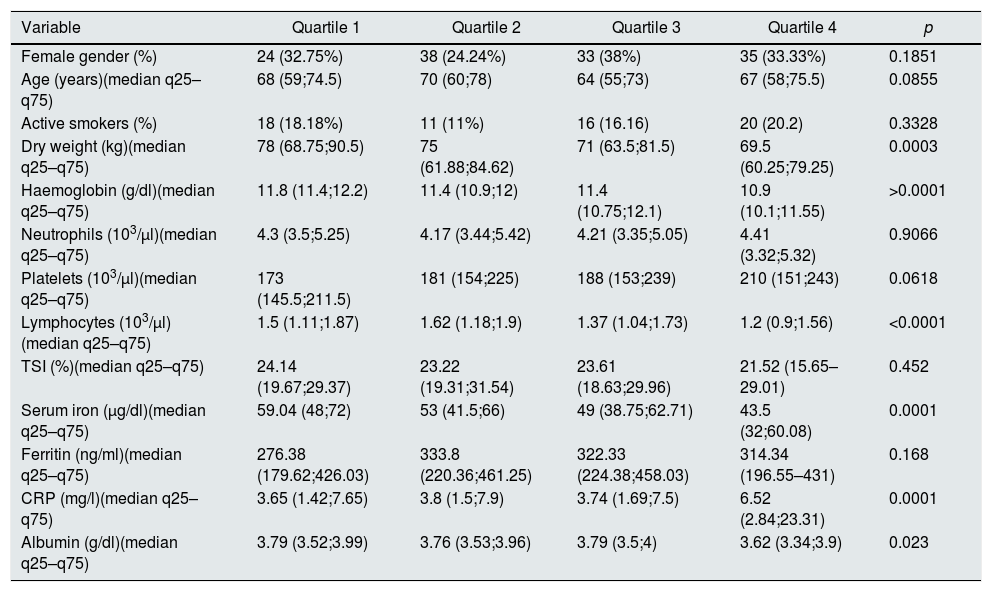
ResultsBaseline characteristics of the populationThe baseline characteristics of the patients included are described in Table 1. A stratification of the ERI in quartiles (Q1=0.59–4.08, Q2=4.08–7.04, Q3=7.04–12.55, Q4=12.55–80.65) was performed and the values of the different variables among the thus defined groups were compared (Tables 2 and 3). The dry weight, lymphocytes, haemoglobin, concentrations of serum iron, albumin and C-reactive protein showed significant differences among the ERI quartiles. For all these variables (except haemoglobin), the post hoc Tukey tests (with the variables transformed beforehand to the logarithmic scale) showed that the first, second and third quartiles did not display significant differences among them, and that the significant differences occurred with regard to the fourth quartile. In the case of haemoglobin, the Dunn's post hoc test showed that its value is significantly higher in the first quartile of ERI, did not show significant differences between the second and third quartiles and showed a significantly lower value in the fourth quartile.
Baseline characteristics of the population.
| Variable | Participants (n=397) |
|---|---|
| Female gender, n (%) | 130 (32.75) |
| Age (years) (median) (q25–q75) | 67 (58;75) |
| Active smokers, n (%) | 65 (16.3) |
| Aetiology, n (%) | |
| Not related | 108 (27.20) |
| Nephroangiosclerosis | 44 (11.08) |
| Diabetic nephropathy | 132 (33.25) |
| Chronic glomerulonephritis | 38 (9.57) |
| Hepatorenal polycystic disease | 24 (6.05) |
| Systemic diseases | 9 (2.27) |
| Tubulointerstitial nephritis | 27 (6.80) |
| Other | 15 (3.78) |
Baseline characteristics according to ERI quartiles.
| Variable | Quartile 1 | Quartile 2 | Quartile 3 | Quartile 4 | p |
|---|---|---|---|---|---|
| Female gender (%) | 24 (32.75%) | 38 (24.24%) | 33 (38%) | 35 (33.33%) | 0.1851 |
| Age (years)(median q25–q75) | 68 (59;74.5) | 70 (60;78) | 64 (55;73) | 67 (58;75.5) | 0.0855 |
| Active smokers (%) | 18 (18.18%) | 11 (11%) | 16 (16.16) | 20 (20.2) | 0.3328 |
| Dry weight (kg)(median q25–q75) | 78 (68.75;90.5) | 75 (61.88;84.62) | 71 (63.5;81.5) | 69.5 (60.25;79.25) | 0.0003 |
| Haemoglobin (g/dl)(median q25–q75) | 11.8 (11.4;12.2) | 11.4 (10.9;12) | 11.4 (10.75;12.1) | 10.9 (10.1;11.55) | >0.0001 |
| Neutrophils (103/μl)(median q25–q75) | 4.3 (3.5;5.25) | 4.17 (3.44;5.42) | 4.21 (3.35;5.05) | 4.41 (3.32;5.32) | 0.9066 |
| Platelets (103/μl)(median q25–q75) | 173 (145.5;211.5) | 181 (154;225) | 188 (153;239) | 210 (151;243) | 0.0618 |
| Lymphocytes (103/μl)(median q25–q75) | 1.5 (1.11;1.87) | 1.62 (1.18;1.9) | 1.37 (1.04;1.73) | 1.2 (0.9;1.56) | <0.0001 |
| TSI (%)(median q25–q75) | 24.14 (19.67;29.37) | 23.22 (19.31;31.54) | 23.61 (18.63;29.96) | 21.52 (15.65–29.01) | 0.452 |
| Serum iron (μg/dl)(median q25–q75) | 59.04 (48;72) | 53 (41.5;66) | 49 (38.75;62.71) | 43.5 (32;60.08) | 0.0001 |
| Ferritin (ng/ml)(median q25–q75) | 276.38 (179.62;426.03) | 333.8 (220.36;461.25) | 322.33 (224.38;458.03) | 314.34 (196.55–431) | 0.168 |
| CRP (mg/l)(median q25–q75) | 3.65 (1.42;7.65) | 3.8 (1.5;7.9) | 3.74 (1.69;7.5) | 6.52 (2.84;23.31) | 0.0001 |
| Albumin (g/dl)(median q25–q75) | 3.79 (3.52;3.99) | 3.76 (3.53;3.96) | 3.79 (3.5;4) | 3.62 (3.34;3.9) | 0.023 |
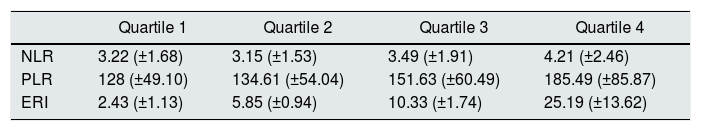
ERI quartiles vs. NLR and PLR means.
| Quartile 1 | Quartile 2 | Quartile 3 | Quartile 4 | |
|---|---|---|---|---|
| NLR | 3.22 (±1.68) | 3.15 (±1.53) | 3.49 (±1.91) | 4.21 (±2.46) |
| PLR | 128 (±49.10) | 134.61 (±54.04) | 151.63 (±60.49) | 185.49 (±85.87) |
| ERI | 2.43 (±1.13) | 5.85 (±0.94) | 10.33 (±1.74) | 25.19 (±13.62) |
The values of the ratios do not have units.
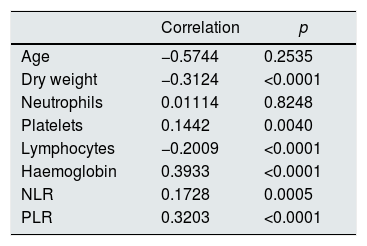
The correlation between the different study variables and the log value (ERI) was calculated (Table 4). The correlation is significant for all variables apart from age and neutrophils.
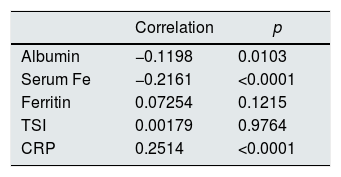
Likewise, correlations were carried out between different inflammation and iron kinetics parameters with the log (ERI) (Table 5).
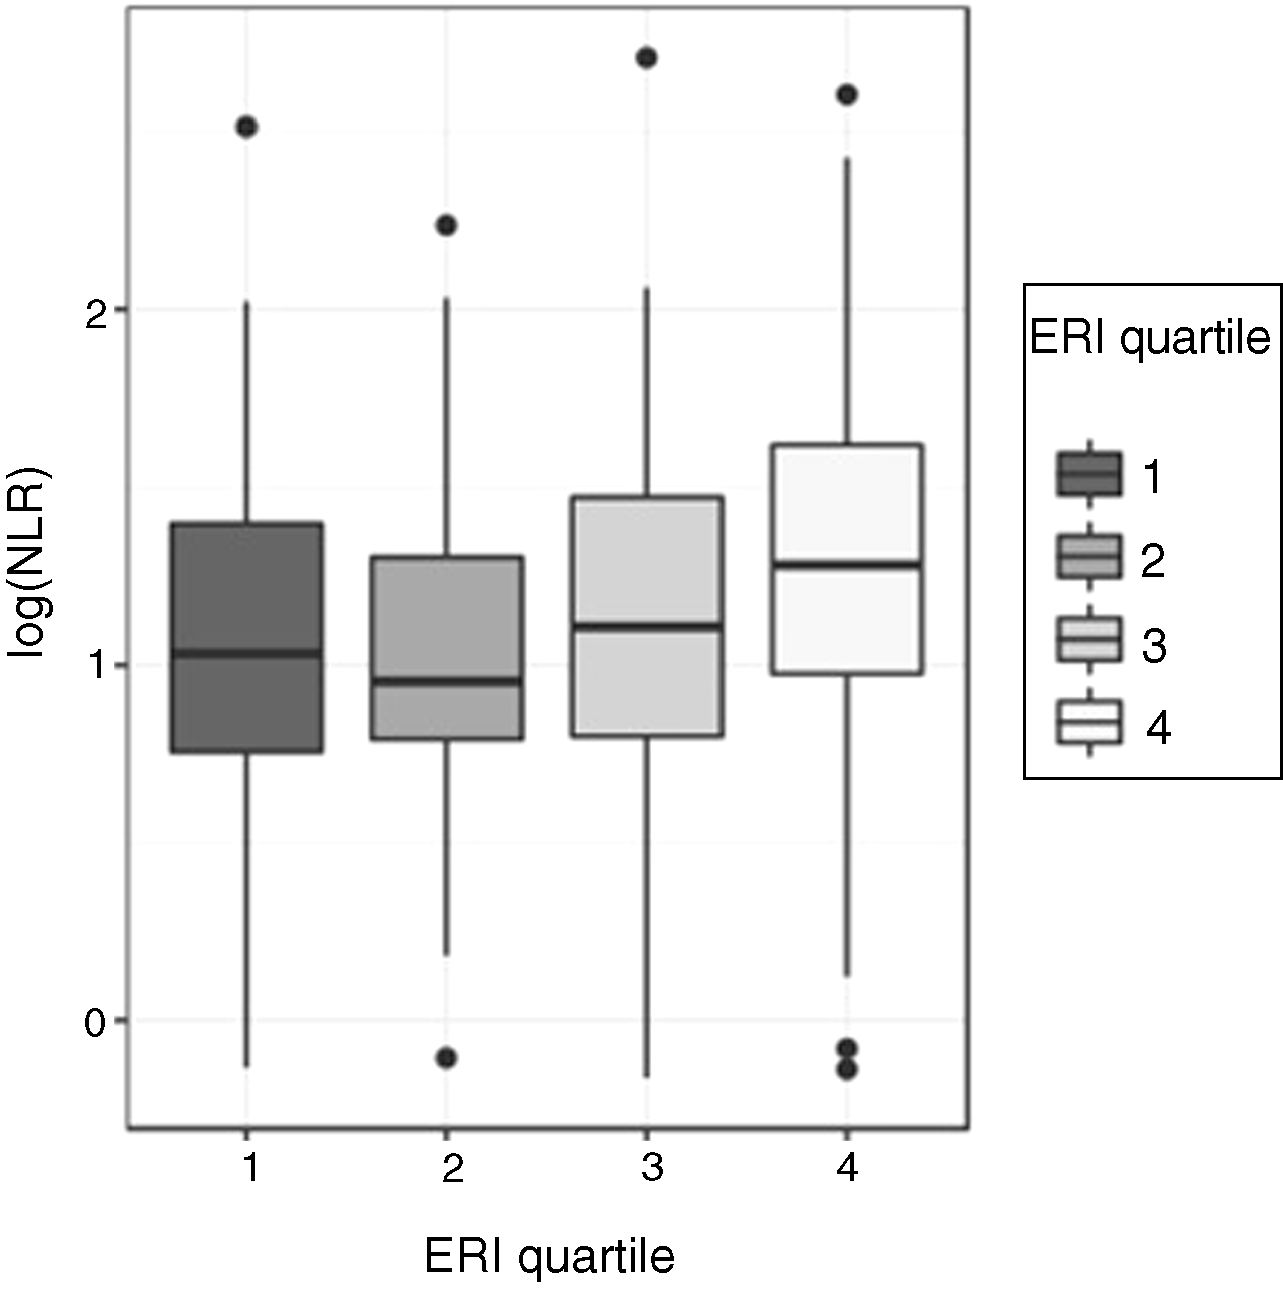
Relationship between the neutrophil-to-lymphocyte ratio (NLR) and the erythropoietin resistance index (ERI)Given the asymmetry of the NLR variable for each ERI quartile, the comparison of the NLR values between the four ERI quartiles was performed initially using the non-parametric Kruskal–Wallis test: this test showed significant differences in the distribution of the ERI for the different ERI quartiles (p=0.00058). To determine the quartiles among which these differences occur, ANOVA and a post hoc test were used. For this, the asymmetry was corrected, transforming the NLR values to a logarithmic scale. The analysis of variance of the log (NLR) confirmed that there are significant differences in the log (NLR) values according to the ERI quartiles (p=0.0004296). The Shapiro–Wilk test did not find evidence of lack of normality in the residuals (p=0.3808) and Levene's test did not detect heteroscedasticity among groups (p=0.4492), which validates the performance of ANOVA (Fig. 1). The Tukey multiple comparison test was used to determine among which quartiles the NLR differences were found: the log values (NLR) for the fourth ERI quartile differ significantly from the values in the first and second quartile. The log value (NLR) in the third ERI quartile does not differ significantly from the others.
 vs. ERI quartiles.")
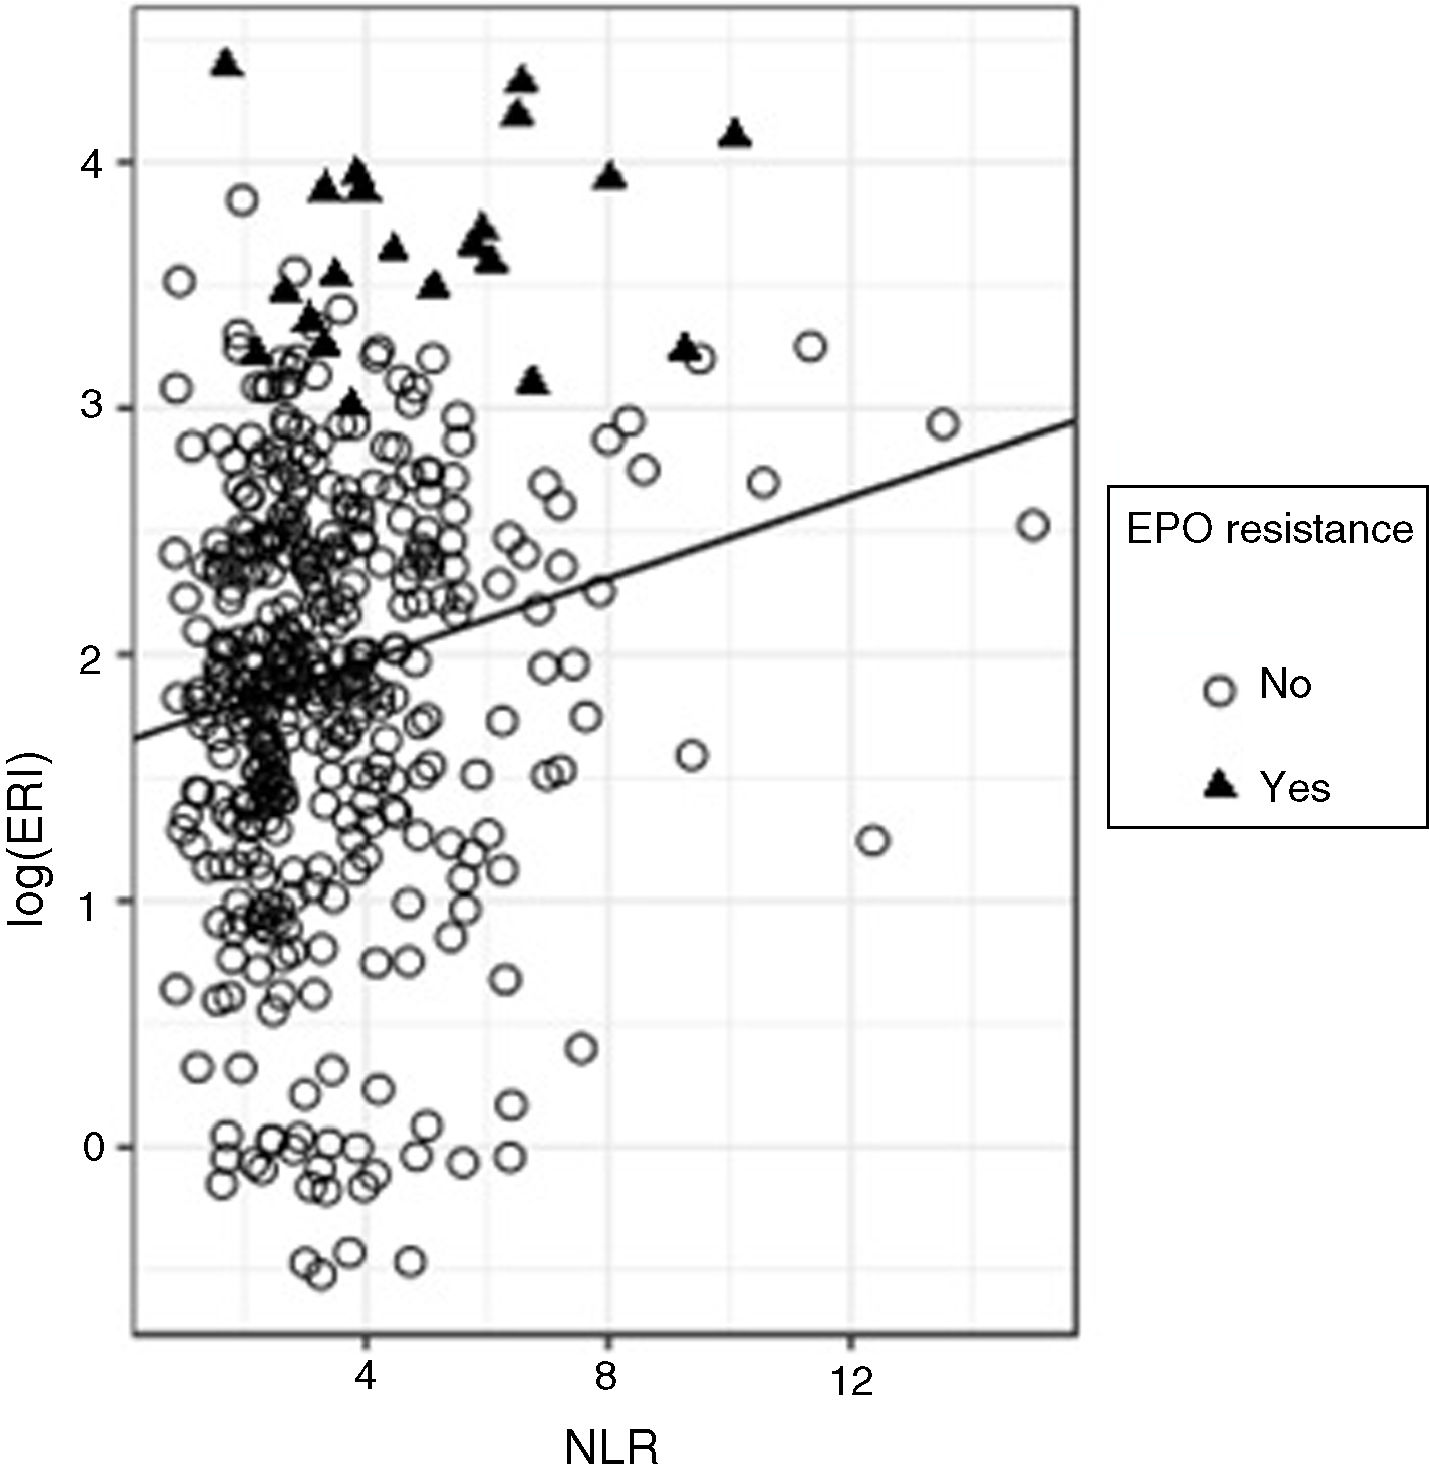
To evaluate the predictive ability of the NLR on the log (ERI), a regression model was adjusted; although the effect of the NLR on the log (ERI) turned out to be significant (standardised beta=0.173, p<0.0001), the R2 value turned out to be very low (R2=0.029), which indicates that, although the ERI value tends to grow with the NLR, the predictive ability of the latter variable is limited. Fig. 2 shows the overall regression line adjusted for all the data, in which the growing trend of the ERI with the NLR is observed and in which the presence of considerable variability can be seen. If we analyse this graph carefully, we can observe that, in particular, the majority of the subjects (90%) have NLR values lower than 6; within this group, only 3.9% are resistant to erythropoietin; subjects with NLR >6 only make up 10% of the total; but within this group there are proportionally more subjects with erythropoietin resistance (18.9%). In other words, the risk of erythropoietin resistance is higher among subjects with high NLR values.
 and NLR.")
This motivates adjusting a logistic regression model to predict the erythropoietin resistance depending on the NLR. With this model, we obtain that the OR of suffering from erythropoietin resistance is 1.32 (p<0.0001; 95% CI: 1.118–1.544) for each unit of increase in the NLR.
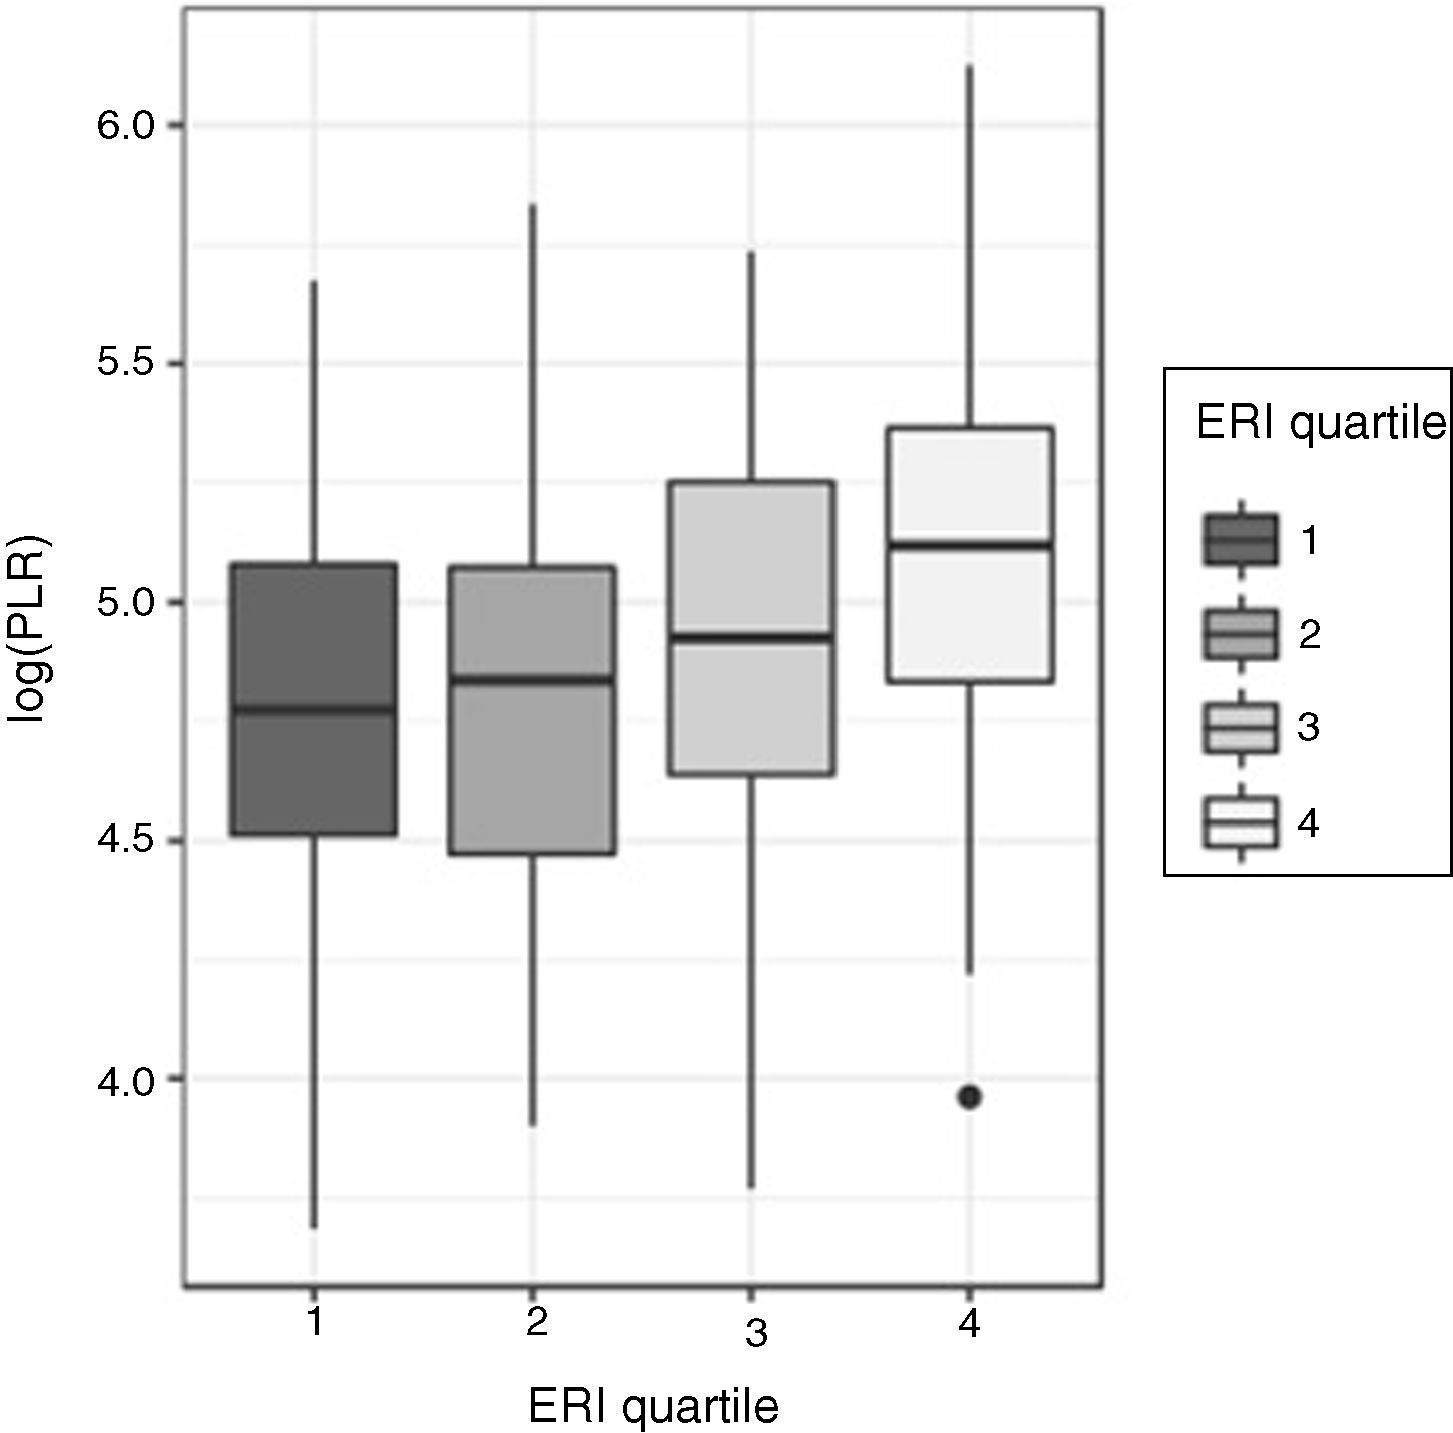
Relationship between the platelet-to-lymphocyte ratio (PLR) and the erythropoietin resistance index (ERI)As with the NLR, the asymmetry of distributions of the PLR for each ERI quartile led to the comparisons of the PLR according to ERI quartiles being carried out using the Kruskal–Wallis test, with the differences turning out to be statistically significant (p<0.00001) (Fig. 3).
 vs. ERI quartiles.")
Similarly, to decide in which quartiles these differences occur, an ANOVA of the log (PLR) was carried out, with the differences being significant (p<0.0001). The normality of the log (PLR) was analysed using the Shapiro–Wilk test (p=0.65) and homoscedasticity with Levene's test (p=0.737).
The Tukey test indicated that the differences were in the fourth ERI quartile compared to the rest. No significant differences in the distribution of the log (PLR) were detected in the other three quartiles.
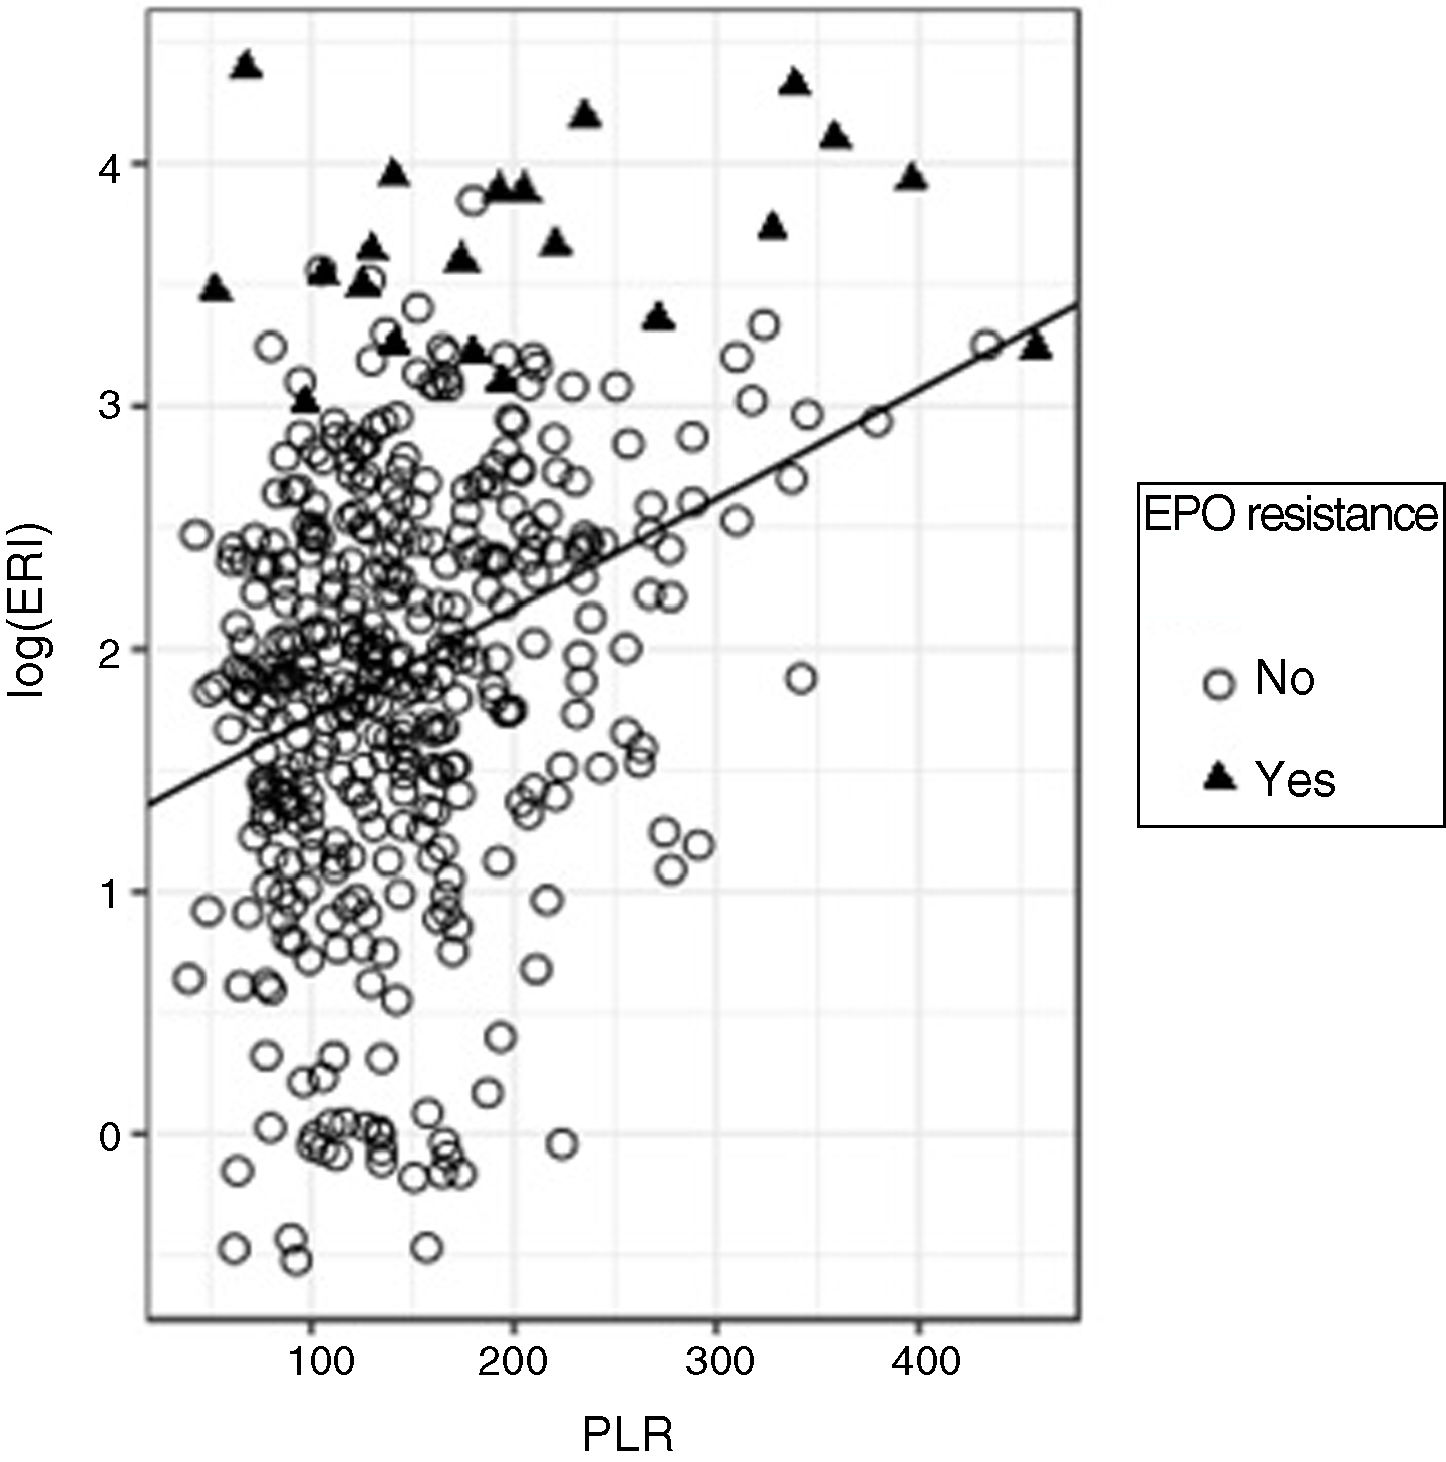
In the regression adjustment to predict the log (ERI) based on the PLR, a significant positive slope (standardised beta=0.32, p<0.0001) was obtained, although, once again, the R2 value turned out to be low (R2=0.103) although higher than that obtained with the NLR, which means that the predictive ability of the PLR is better than that of the NLR (Fig. 4).
 and PLR.")
As occurred with the NLR, it is observed that the log (ERI) increases with the PLR value; as in that case 90% of the PLR values are below 233; in this group, some 3.9% of patients are resistant to erythropoietin; however, when the PLR is above 233, 17.5% of the subjects are resistant to erythropoietin; therefore, the risk of being resistant to erythropoietin increases with the PLR value.
To assess this risk, the logistic regression model indicates that an increase of one unit in the PLR translates into an OR of 1.011 (p<0.0001; 95% CI: 1.005–1.015) of presenting erythropoietin resistance. An additional calculation makes it possible to estimate that the OR of suffering from erythropoietin resistance doubles for each increase of 67 units in the PLR value.
Furthermore, a multivariate regression analysis was carried out, in which variables such as the TSI, serum iron, C-reactive protein and the PLR were included. The correlation of the PLR with logERI continued to be significant (p<0.0001), with the total predictive capacity of the model, measured in terms of R2, of 17.26%.
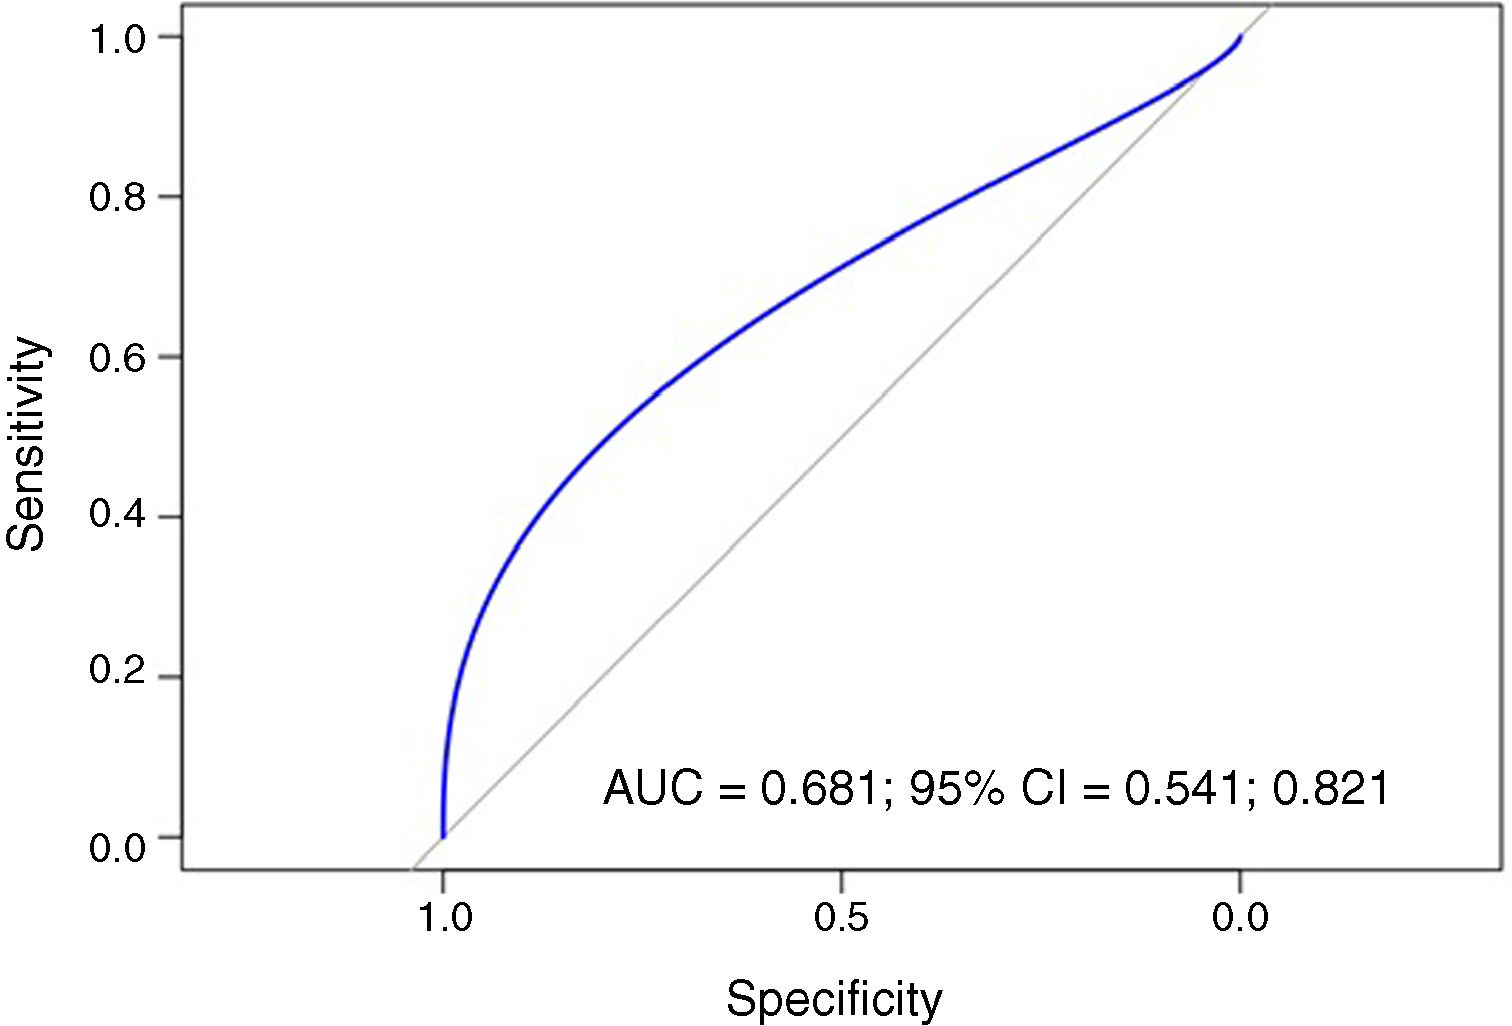
To analyse the capacity of the PLR to predict erythropoietin resistance, the area under the ROC curve was measured (AUC=0.681) (95% CI: 0.541–0.821). A PLR cut-off point of 125.5 would result in 80.95% sensitivity and 42.82% specificity (Fig. 5).
Discussion
Cardiovascular risk in haemodialysis patients is well known.1 From the pathophysiological point of view, inflammation plays a very important role. Historically, multiple parameters have been listed to measure this, including C-reactive protein, serum albumin and B-type natriuretic peptide. The NLR and the PLR have emerged in recent years as markers of inflammation and endothelial damage in different types of patients. Given the fact that they are easy to obtain, inexpensive and routinely extracted in patients on haemodialysis, they are a very interesting analytical parameter in this group of patients.6,25,26
Likewise, the management of anaemia with erythropoiesis-stimulating agents and intravenous iron have been set up as the basis for the treatment of patients on haemodialysis for many years.5,10
The ERI is a good marker of erythropoietin resistance and is related to both intercurrent processes (neoplasia, infections, etc.) and to a worse prognosis in patients on haemodialysis, which is why their detection and follow-up is very important.10,11,15,16
The objective of our study was to determine whether resistance to erythropoietin is related to the NLR and the PLR. It is worth pointing out that patients who were admitted to hospital for infection, cancer or haematological causes; those who had received a blood transfusion in the last three months; those who presented active onco-haematological comorbidities and those who were receiving steroid treatment were ruled out from the study. All of these are factors which could, a priori, alter the count of these blood cells.
Unlike a previous study, which only found a significant association of the ERI with the PLR (and not with the NLR),11 our study found an association with both parameters. An explanation could be that the low number of lymphocytes, the common parameter of both ratios, could be the most important factor. In isolation, the reduction in absolute number of lymphocytes has been used as a marker of ischaemic heart disease.27,28 One factor to bear in mind, found in our study, is that the fourth quartile had the lowest levels of albumin and dry weight. Despite the fact that this result could be due to the influence of malnutrition, other studies would be necessary to truly determine which of the causes of hypoalbuminaemia is that which influences this finding most (for example: malnutrition, inflammation, liver disease, etc.).
It should be noted that pathophysiological stress causes cortisol release (not analysed in our study) which reduces lymphocyte levels. This could translate into an altered immune response which would result in erythropoietin resistance. Furthermore, lymphopenia could be caused by apoptosis of these cells in atherosclerotic lesions.22
Individually, platelets are involved in atherosclerosis, in the activation of proinflammatory cytokines and, through interaction with the endothelium, they are probably also related to leucocyte chemotaxis and to arterial wall inflammation.29,30
Neutrophils have demonstrated an important role in endothelial dysfunction, atherogenesis and plaque destabilisation. Activated neutrophils adhere to and penetrate the endothelial wall easily and are involved in the generation and release of free radicals, hydrolytic enzymes and cytokines.31
In our study, the PLR has a significant correlation with the logERI similar to that presented by C-reactive protein and serum iron, which is consistent given that the main causes of erythropoietin resistance are inflammation and iron deficiency.14
Regarding the NLR, the correlation with the logERI is significant but less than that found with the PLR. Our results improve on aspects envisaged by other authors, probably due to the fact that our study had a higher number of samples.32 However, the reasons for this difference are still not known, although it is suggested that the PLR would be higher because, at the same time, it is a better inflammatory marker than the NLR.11,25
However, given the low R2 value in both correlations, the predictive power of these associations is low. Nevertheless, when combined with other variables of inflammation and iron kinetics, the PLR did provide additional explanatory power.
The strengths of the study are its sample size, which was much larger than that of previous studies, and its multicentre nature.25
The following can be mentioned within the limitations of the study: the fact that the recruited population belongs to a single province in Spain and that, although the results obtained demonstrate statistically significant associations, they have a limited predictive power.
In view of the results obtained, the mean values of the two ratios could be used as cut-off points for subsequent studies that deem the stratification of these parameters necessary.
In conclusion, the high values of the NLR and the PLR were associated with higher ERI values in a population at high cardiovascular risk, such as prevalent patients on haemodialysis. Both ratios can be a good cost-effective marker for the monitoring of erythropoietin resistance.
AuthorsStudy design: F.V.A and T.M.V.
Performance of the study: F.V.A, T.M.V, F.H.P and G.A.
Data collection: F.V.A, T.M.V, F.H.P and G.A.
Data analysis: F.V.A, T.M.V, F.H.P, A.S.D.P and G.A.
Interpretation of the results: F.V.A, T.M.V, F.H.P and G.A.
Drafting of the manuscript: F.V.A, T.M.V, F.H.P, A.S.D.P and G.A.
Review of the manuscript content: F.V.A, T.M.V, F.H.P, A.S.D.P and G.A.
Approval of the final version of the manuscript: F.V.A, T.M.V, F.H.P, A.S.D.P and G.A.
F.V.A, A.S.D.P and G.A accept responsibility for the integrity of the data analysis.
Conflicts of interestThe authors declare that they have no conflicts of interest.
Please cite this article as: Valga F, Monzón T, Henriquez F, Santana-del-Pino A, Antón-Pérez G. Índices plaquetas-linfocito y neutrófilo-linfocito como marcadores de resistencia a la eritropoyetina en pacientes en hemodiálisis crónica: estudio transversal-multicéntrico. Nefrologia. 2020;40:320–327.


