



Chronic kidney disease (CKD) is linked to delayed diagnoses, non-compliant assessments, and under-registration. This study assessed the clinical profiles and patterns of CKD detection and registration in Catalonian primary care over 10 years.
MethodsWe used a large primary care database to identify adults with CKD diagnoses or abnormal estimated glomerular filtration rate (eGFR) or urine albumin/creatinine ratio (UACR) values persisting for over 90 days between 2012 and 2021. Outcomes included clinical profiles, time to confirmatory testing, diagnosis rates, and time to code registration.
Results447,202 adult patients met the criteria for CKD evidence. The frequency of newly identified cases tended to stabilise and showed a progressive decline in age and eGFR and UACR severity, and a change in pattern comorbidities.
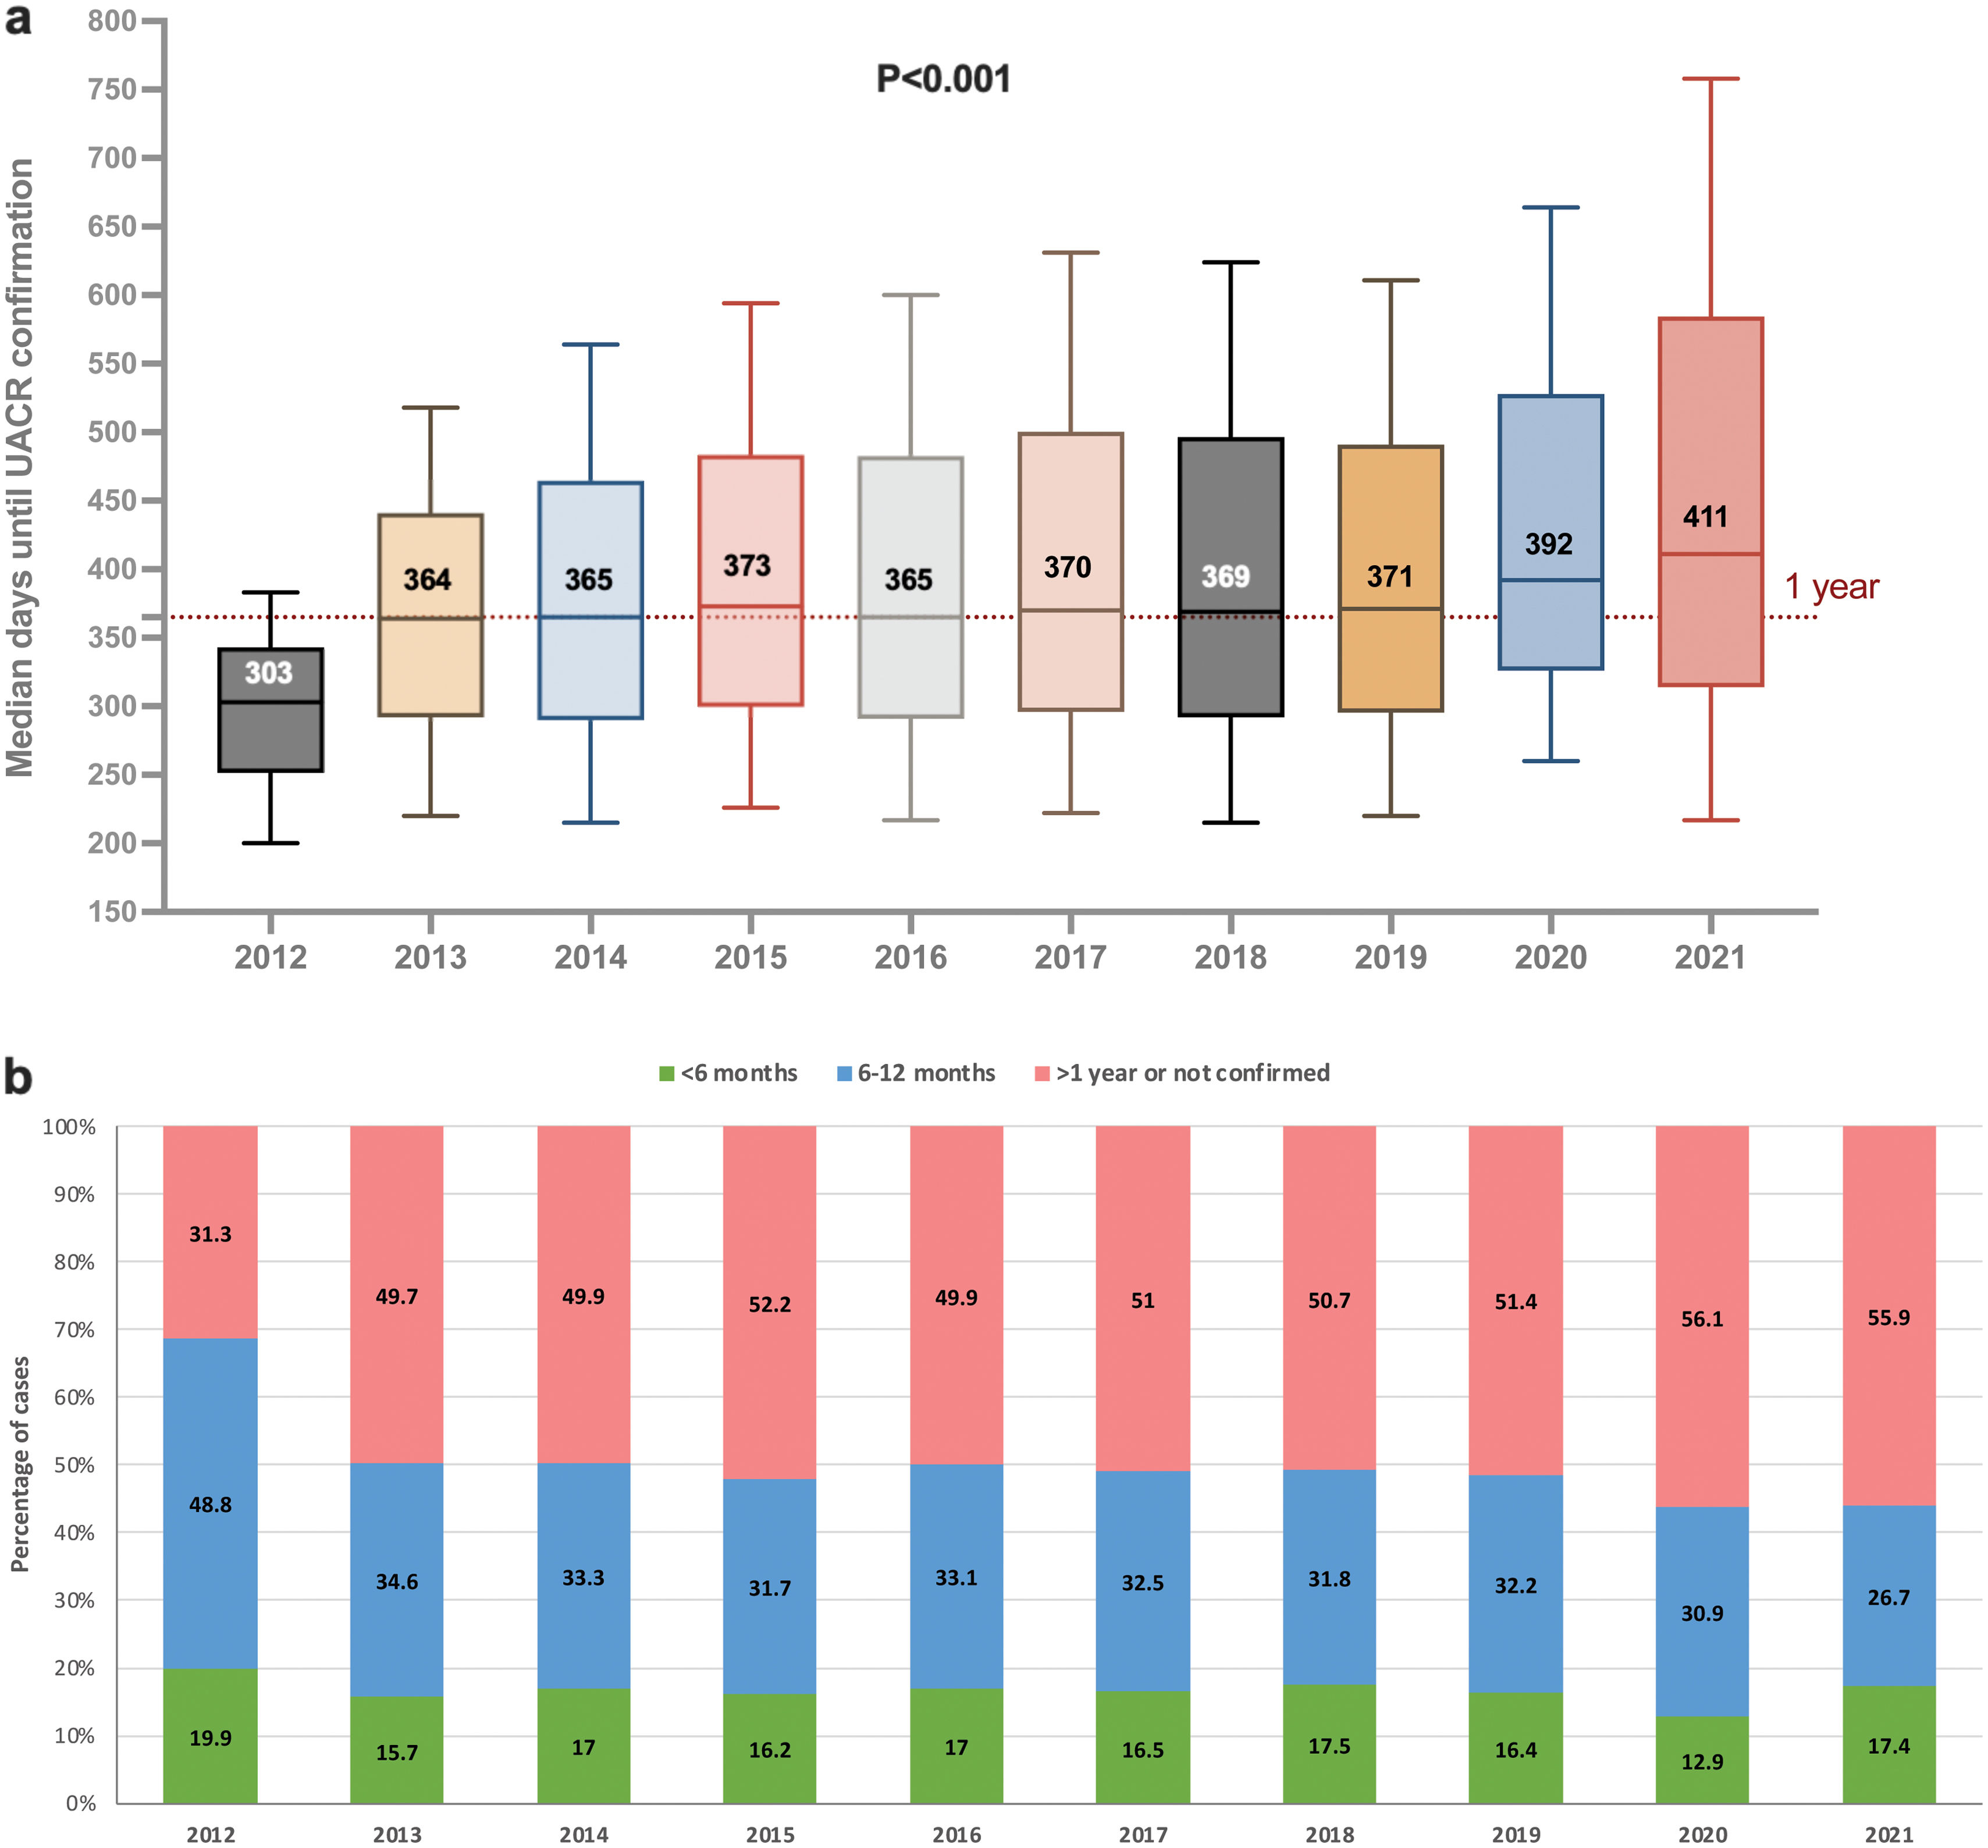
In patients identified by altered biochemical parameters, the median time between the first and confirming eGFR determination decreased, resulting in a 50% increase in confirmations within 6 months. Conversely, the time until UACR confirmation increased, and a persistent<20% of patients received a confirmatory UACR test within 6 months. The proportion of newly identified patients without UACR measures at baseline decreased from 59.3% in 2012 to 25.5% in 2021 (P<0.001).
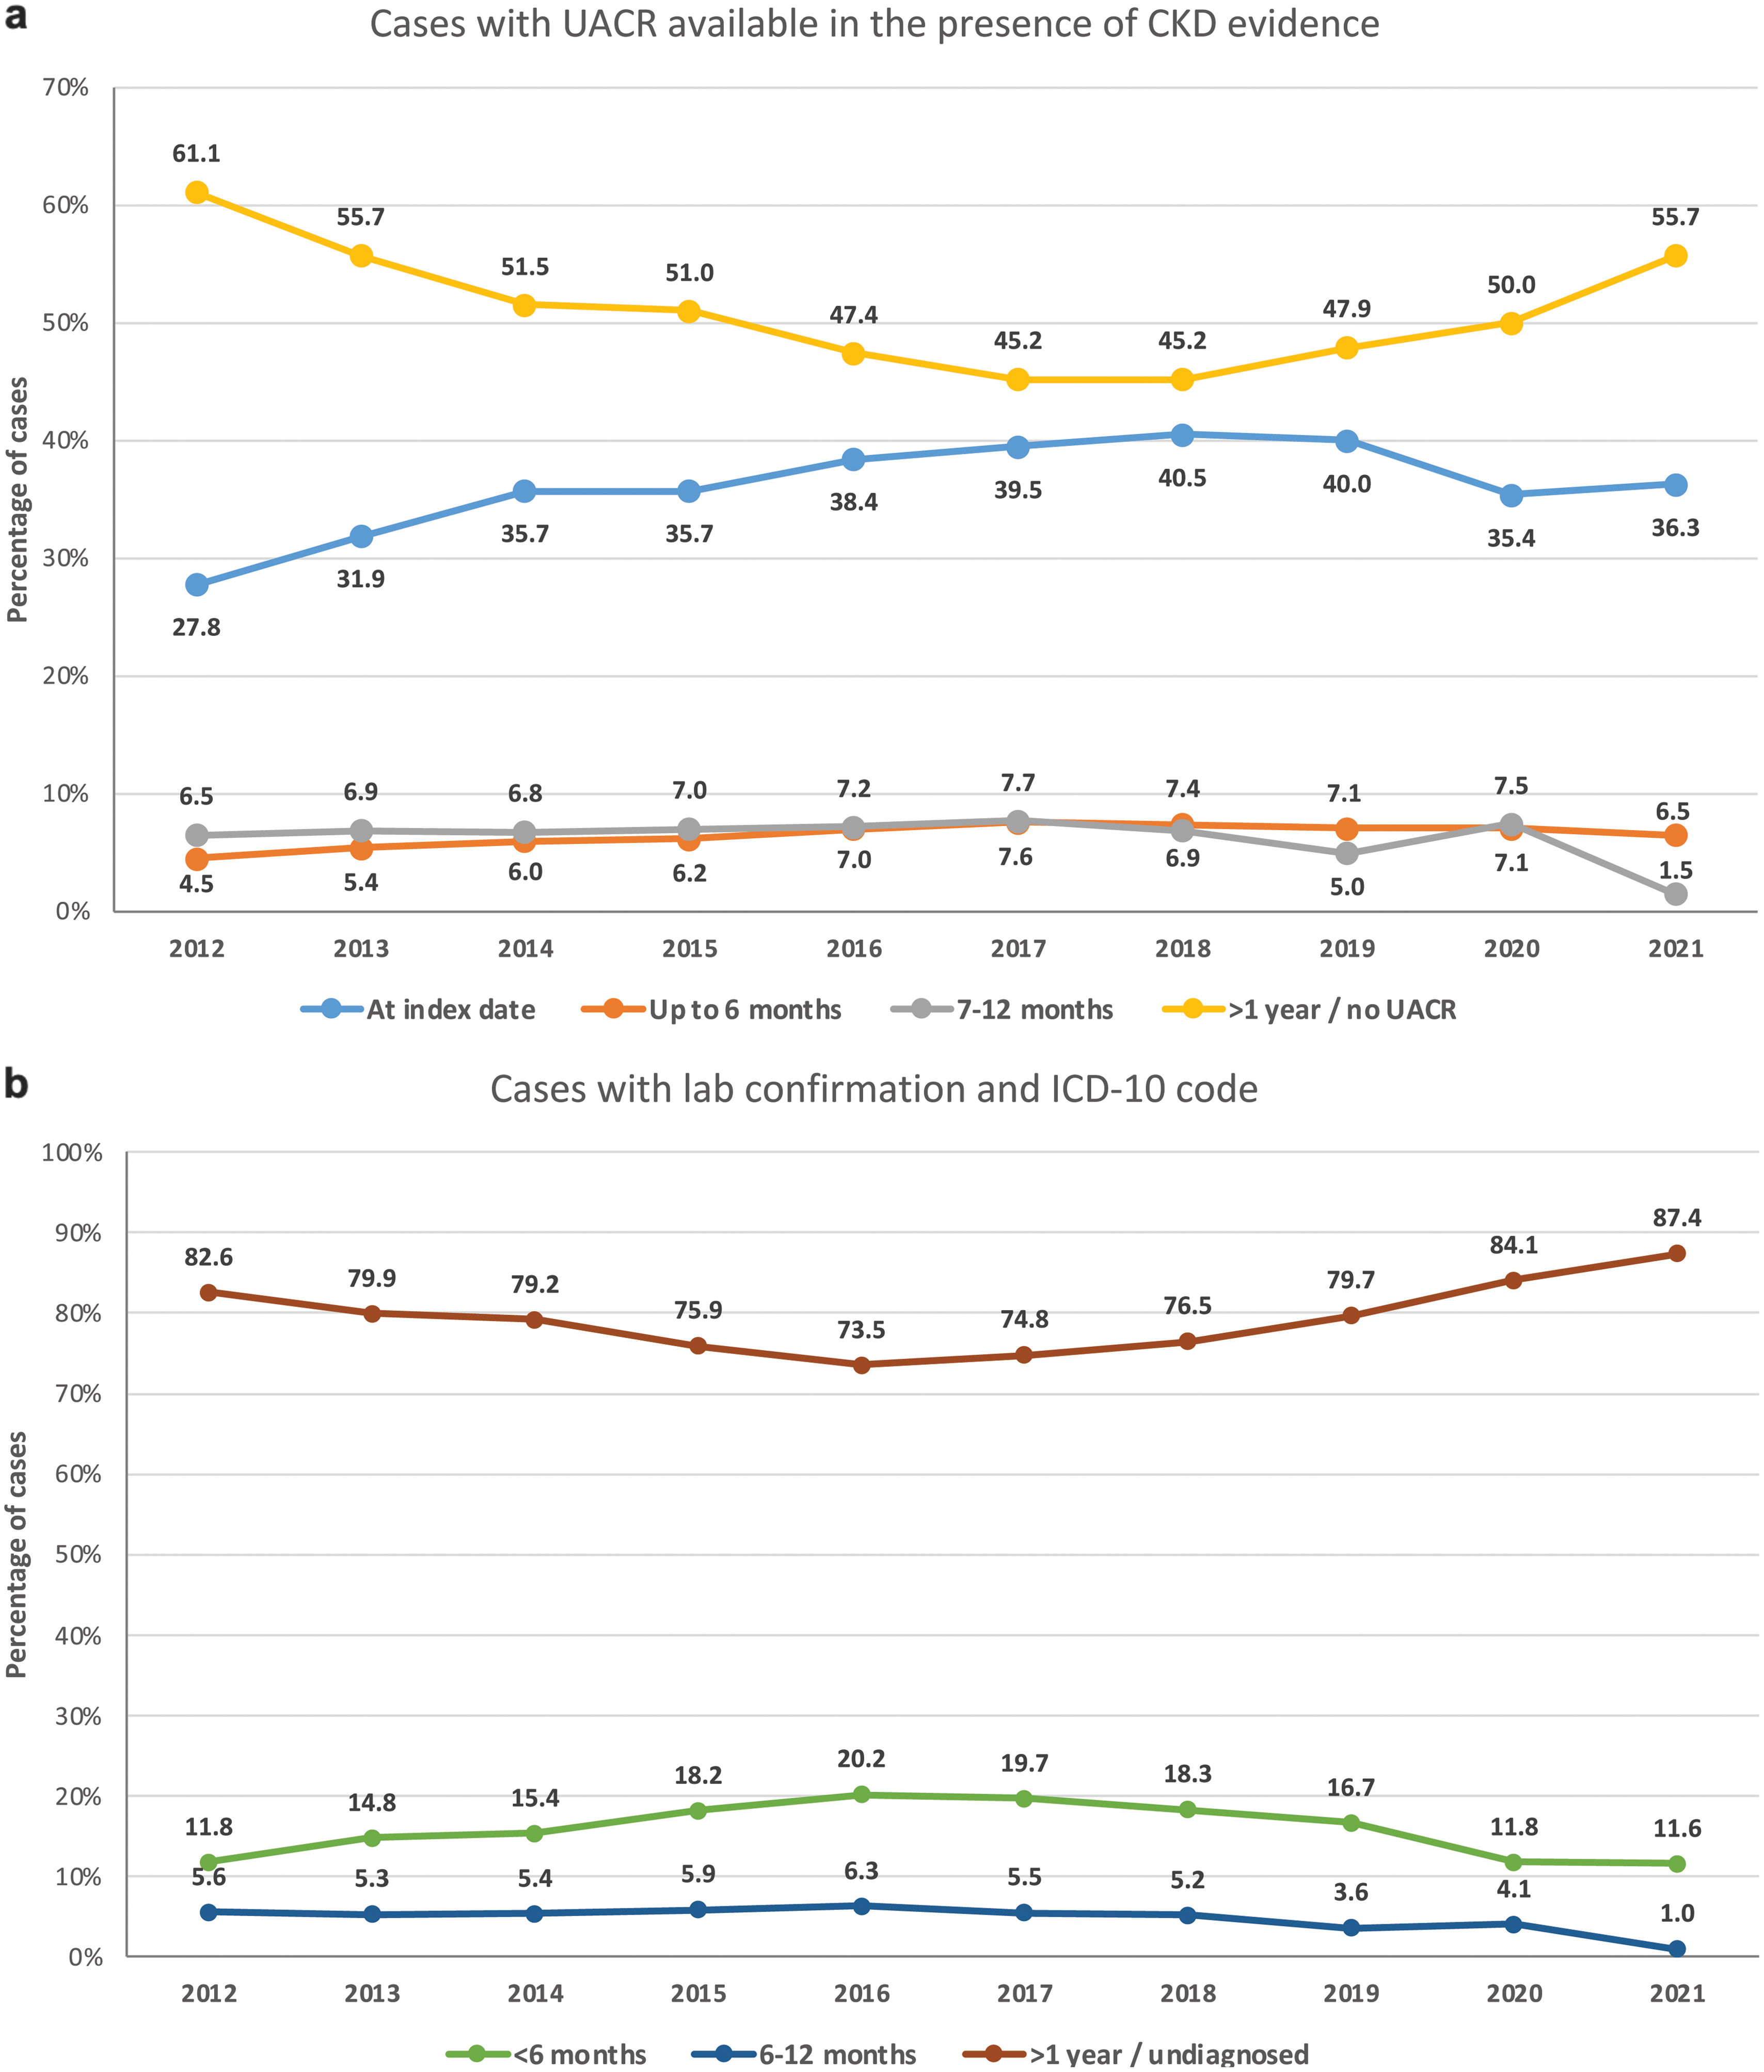
Dual eGFR and UACR evaluation evolved, with UACR availability at the index date increasing from 27.8% in 2012 to 40.5% in 2018 and then declining slightly. The proportion of CKD cases without a UACR request within 12 months decreased from 61.1% to 55.7%.
For cases entering the study based on laboratory evidence, diagnostic codification within 6 months rose from 11.8% in 2012 to 20.2% in 2016, then fell to 11.6% in 2021. Cases without a diagnosis after 12 months dropped from 82.6% in 2012 to 73.5% in 2016, then increased to 87.4% in 2021. By 2021, timely diagnoses were highest among very high-risk patients (25.1%), followed by high-risk (18.3%) and moderate-risk (9.0%).
ConclusionsOur study shows progress and ongoing challenges in timely CKD detection and registration. Despite improvements, too many patients lacked UACR testing or were not registered despite evidence of CKD, risking suboptimal treatment. Addressing these gaps is essential to reduce disease progression and enhance patient outcomes.
La enfermedad renal crónica (ERC) se asocia con retrasos en el diagnóstico, evaluaciones incompletas y un infraregistro en la historia clínica. Este estudio analizó los perfiles clínicos y los patrones de detección y registro de la ERC en la atención primaria de Cataluña durante un período de 10 años.
MétodosSe utilizó una base de datos de atención primaria para identificar adultos con diagnóstico de ERC o valores alterados y persistentes (>90 días) de la tasa de filtrado glomerular estimada (TFGe) o del cociente albúmina/creatinina en orina (CACU) entre 2012 y 2021. Las variables de estudio incluyeron perfiles clínicos, tiempo hasta la prueba confirmatoria, tasas de diagnóstico y tiempo hasta la codificación en la historia clínica.
ResultadosUn total de 447.202 pacientes adultos cumplieron criterios de evidencia de ERC. Los nuevos casos identificados tendieron a estabilizarse, con una disminución progresiva en la edad y en la gravedad de TFGe y CACU, así como un cambio en el patrón de comorbilidades. En los pacientes identificados por alteraciones bioquímicas, la mediana del tiempo entre la primera y la segunda determinación de TFGe disminuyó, con un aumento del 50% en las confirmaciones dentro de los primeros 6 meses. En cambio, el tiempo hasta la confirmación del CACU aumentó, y menos del 20% de los pacientes recibieron una prueba confirmatoria de CACU dentro de ese mismo período. La proporción de nuevos pacientes identificados sin medición de CACU al inicio bajó del 59,3% en 2012 al 25,5% en 2021 (p < 0,001). La evaluación conjunta de TFGe y CACU evolucionó: la disponibilidad de CACU en la fecha índice aumentó del 27,8% en 2012 al 40,5% en 2018, con un leve descenso posterior. La proporción de casos sin solicitud de CACU en los 12 meses siguientes disminuyó del 61,1% al 55,7%. En los casos identificados por evidencia analítica, la codificación diagnóstica dentro de los 6 meses aumentó del 11,8% en 2012 al 20,2% en 2016, para luego descender al 11,6% en 2021. Los casos sin diagnóstico tras 12 meses bajaron del 82,6% en 2012 al 73,5% en 2016, y subieron nuevamente al 87,4% en 2021. En 2021, los diagnósticos oportunos fueron más frecuentes entre los pacientes de muy alto riesgo (25,1%), seguidos de los de alto riesgo (18,3%) y riesgo moderado (9,0%).
ConclusionesNuestro estudio evidencia avances, pero también desafíos persistentes en la detección y registro oportuno de la ERC. A pesar de las mejoras observadas, un número significativo de pacientes no fue evaluado con CACU ni registrado formalmente, a pesar de cumplir criterios de enfermedad, lo que puede limitar un tratamiento adecuado. Abordar estas brechas es fundamental para frenar la progresión de la enfermedad y mejorar los resultados clínicos.
Chronic kidney disease (CKD) is defined as the persistence of structural or functional kidney abnormalities for at least three months, impacting health.1 As of 2017, the global prevalence of CKD stood at 9.1%, marking a substantial 29.3% increase since 1990.2 This rise was accompanied by a steady escalation in the age-standardized incidence rate, experiencing an estimated annual percentage change of 3.2%.3 Furthermore, CKD-related mortality has increased by 41.5% since 1990, constituting 4.6% of all deaths in 2017, with cardiovascular disease (CVD) deaths attributed to impaired kidney function contributing significantly to this trend.2
In Spain, population-based and primary care studies, including EPIRCE,4 ENRICA-Renal,5 and IBERICAN-Renal,6 have shown that CKD represents a substantial public health burden. These studies provide important epidemiological context, although most have focused on CKD prevalence rather than on temporal patterns of CKD detection, confirmation, and registration in routine primary care.
Typically, individuals with CKD remain asymptomatic until the disease progresses, underscoring the potential benefits of proactive early treatment within primary care settings to mitigate the risk of progression, CKD-related morbidity and mortality, and associated complications.1,7 According to the clinical practice guideline developed by the Kidney Disease: Improving Global Outcomes (KDIGO), the recommended detection algorithm for identifying CKD involves the assessment of urine albumin-creatinine ratio (UACR) to identify albuminuria, along with serum creatinine to estimate the glomerular filtration rate (eGFR).1,7 In line with KDIGO guidance, Spanish consensus recommendations also emphasise early CKD detection, assessment using both eGFR and albuminuria, risk stratification, and coordinated management between primary care and nephrology.8 To confirm the chronicity of CKD, abnormal parameters must be observed persistently for at least three months.1,7 Afterwards, the prognosis evaluation of CKD involves categorising eGFR and albuminuria into risk stages to determine the likelihood of CVD, renal adverse outcomes, and mortality.1,7
Quality of care indicators for CKD draw from recommendations on recognition and diagnosis outlined in clinical.9,10 These indicators include dual eGFR/UACR determination, delay from initial signs to a confirmed diagnosis, or rates of diagnosed and undiagnosed cases. These measures have significant clinical implications and are crucial for evaluating the effectiveness of CKD management and monitoring practices.11–13 Despite the KDIGO recommendations being in place for a decade,14 there are notable gaps in their implementation in clinical practice. For instance, clinicians often fail to conduct dual albuminuria and eGFR testing or confirm diagnoses, leading to a high prevalence of non-guideline-concordant assessment and undiagnosed cases of CKD.7,10,11,15–21 Moreover, delayed diagnosis and under-registration in health records are frequent and have been observed in general practices worldwide.11,12,17,20–29
While most available retrospective studies assessing the prevalence of CKD quality of care indicators span several years, only a few have conducted detailed yearly analyses.11,18,19,22,25 Moreover, understanding variations in demographic and clinical profiles is essential as they provide insights into patient-centred quality of care and management outcomes.30 For instance, according to a recent survey conducted by the International Society of Nephrology (ISN), 65% of CKD diagnoses occur during assessments for other risk factors -such as diabetes or hypertension- or routine visits to the primary care physician (PCP), rather than by kidney specialists in secondary care settings.12,31 Therefore, time-based analyses assessing variations in clinical profiles alongside traditional quality indicators are crucial for a comprehensive understanding of CKD care and management practices.
This study aimed to retrospectively investigate CKD in primary care practices in Catalonia, a Northeastern region in Spain, over 10 years using electronic medical record data from a real-world database. The research evaluated variations in the clinical profile of newly identified CKD patients and trends in PCPs’ performance in accurately identifying, diagnosing, and registering CKD based on existing guidelines. With this comprehensive approach, the study sought to identify areas for improvement in CKD care delivery that could inform targeted interventions to optimise patient outcomes and enhance the overall efficiency of CKD management in primary healthcare.
Materials and methodsDesign, setting, and data sourceThis retrospective, population-based, non-interventional study was based on real-world data extracted from the SIDIAP (Information System for the Development of Research in Primary Care) database. The SIDIAP is a large public administrative regional healthcare claims system owned by the Catalan Health Institute (ICS) that encompasses 328 primary care centres (PCCs), covering approximately six million people, 75% of the population in Catalonia, an autonomous community in north-eastern Spain.32 The SIDIAP database contains data collected by over 30,000 healthcare professionals who use a common electronic medical record system (eCAP) to record structured information during primary care visits.32 The recorded data are pseudo-anonymised and include demographic information, medical history, International Classification of Diseases, 10th Revision, Clinical Modification (ICD-10-CM) coded diagnoses, clinical variables, prescriptions, immunisations, referrals, and laboratory results, among others.32
The SIDIAP database is representative of the population of Catalonia in terms of age, sex, and geographic distribution,32,33 and has been validated and extensively used for other research studies on CKD, cardiovascular, and metabolic disorders.34–38
The study was conducted according to the principles of the Declaration of Helsinki and was approved by the Ethical Committee of the Fundació per a la Investigació en Atenció Primària Jordi Gol (23/146-P). The requirement for informed consent was waived because of the retrospective nature and the use of de-identified data.
Study populationThe retrospective study sample was drawn from individual records within the SIDIAP database from 1st January 2012 to 31st December 2021. Eligible patients were those aged 18 years and above, with a minimum of 12 months of continuous presence in the database and a newly identified case of CKD. Newly identified CKD case was defined as either the presence of a registered ICD-10-CM code for CKD (see Supplementary Table 1 for codes used) or the observation of at least two abnormal eGFR or UACR values (<60ml/min/1.73m2 and ≥30mg/g, respectively) persisting for more than 90 days, without normal values in-between. The eGFR value was determined using the 2009 CKD-EPI creatinine equation.39 Patients with a CKD code registration before 2012 or laboratory CKD evidence during 2011 were excluded from the analysis. Thus, the extracted analytical dataset included only individuals with newly identified CKD evidence during the study period, in accordance with the study objectives and predefined analysis plan.
The index date was defined as the date of the first confirmed evidence of CKD. This could be either the date of the first registration of a CKD ICD-10-CM code or the laboratory confirmation date, specifically the first abnormal eGFR or UACR measurement confirming chronicity (i.e., persisting beyond 90 days from the initial abnormal value).
Study variables and outcomesThe following baseline data were extracted from the SIDIAP database at the index date: (1) sociodemographic variables (age and sex); (2) analytical parameters related to kidney function (eGFR and UACR), allowing up to one month after the index date; (3) presence of CKD diagnosis, defined as the registration of at least one of the ICD-10-CM codes for CKD; and (4) comorbidities including type 2 diabetes (T2DM), heart failure (HF), hypertension, smoking habit, obesity, hypercholesterolemia, CVD, coronary heart disease (CHD), and Charlson comorbidity index (see Supplementary Table 1 for definitions and ICD-10-CM codes used). Finally, patients were classified into KDIGO eGFR and UACR categories and risk stages1 based on the available eGFR and UACR measurements at baseline.
Based on the extracted analytical data, the study assessed several outcomes. Patterns and timeliness of CKD detection and recognition were evaluated in terms of availability of eGFR or UACR values at baseline up to one month post-index date and time (in days and stratified by <6 months, 6–12 months, and >1 year) from the first altered eGFR or UACR measurement to confirmed measurement at index date in cases identified due to values indicative of CKD. Individuals were classified according to the time from the index date to the first posterior UACR determination as “UACR at index date”, “Up to 6 months”, “7–12 months”, or “Over a year/No UACR”.
We also investigated the patterns and timeliness of CKD registration among newly identified cases due to biochemical evidence indicative of CKD. We measured the time to diagnosis and categorised patients based on whether they were diagnosed within “<6 months”, “6–12 months”, or “>1 year or undiagnosed”.
Statistical analysisThe study provides a descriptive analysis of the demographic and clinical characteristics among newly identified CKD patients from 2012 to 2021, stratified by the index date year.
The annual frequency of newly identified cases was estimated as the total number of patients with newly identified CKD evidence and an index date within the respective year and expressed per 1000 individuals at risk. The population at risk for each calendar year was defined as adults aged ≥18 years registered in SIDIAP with at least 12 months of prior continuous registration and without previous evidence of CKD according to the study definition. We examined the number of newly identified cases by year and the demographic and clinical profile through variations in baseline gender, age, median eGFR and UACR values at the first evidence of CKD, and prevalence of comorbid diseases.
Variables were expressed as yearly absolute and relative frequencies and continuous variables as median and interquartile range (P25–P75; IQR). Comparisons across calendar years were conducted using Chi-square for categorical variables and Kruskal–Wallis for continuous variables. Additionally, simple regression models were used to assess linear time trends in time from altered eGFR or UACR to confirmation and diagnostic delay. For CKD registration patterns, additional analyses included stratification according to the KDIGO risk stage.
Statistical significance was determined at a threshold of a 2-sided P<0.05. All analyses were performed using the R Core Team software environment, version 4.3.1.40
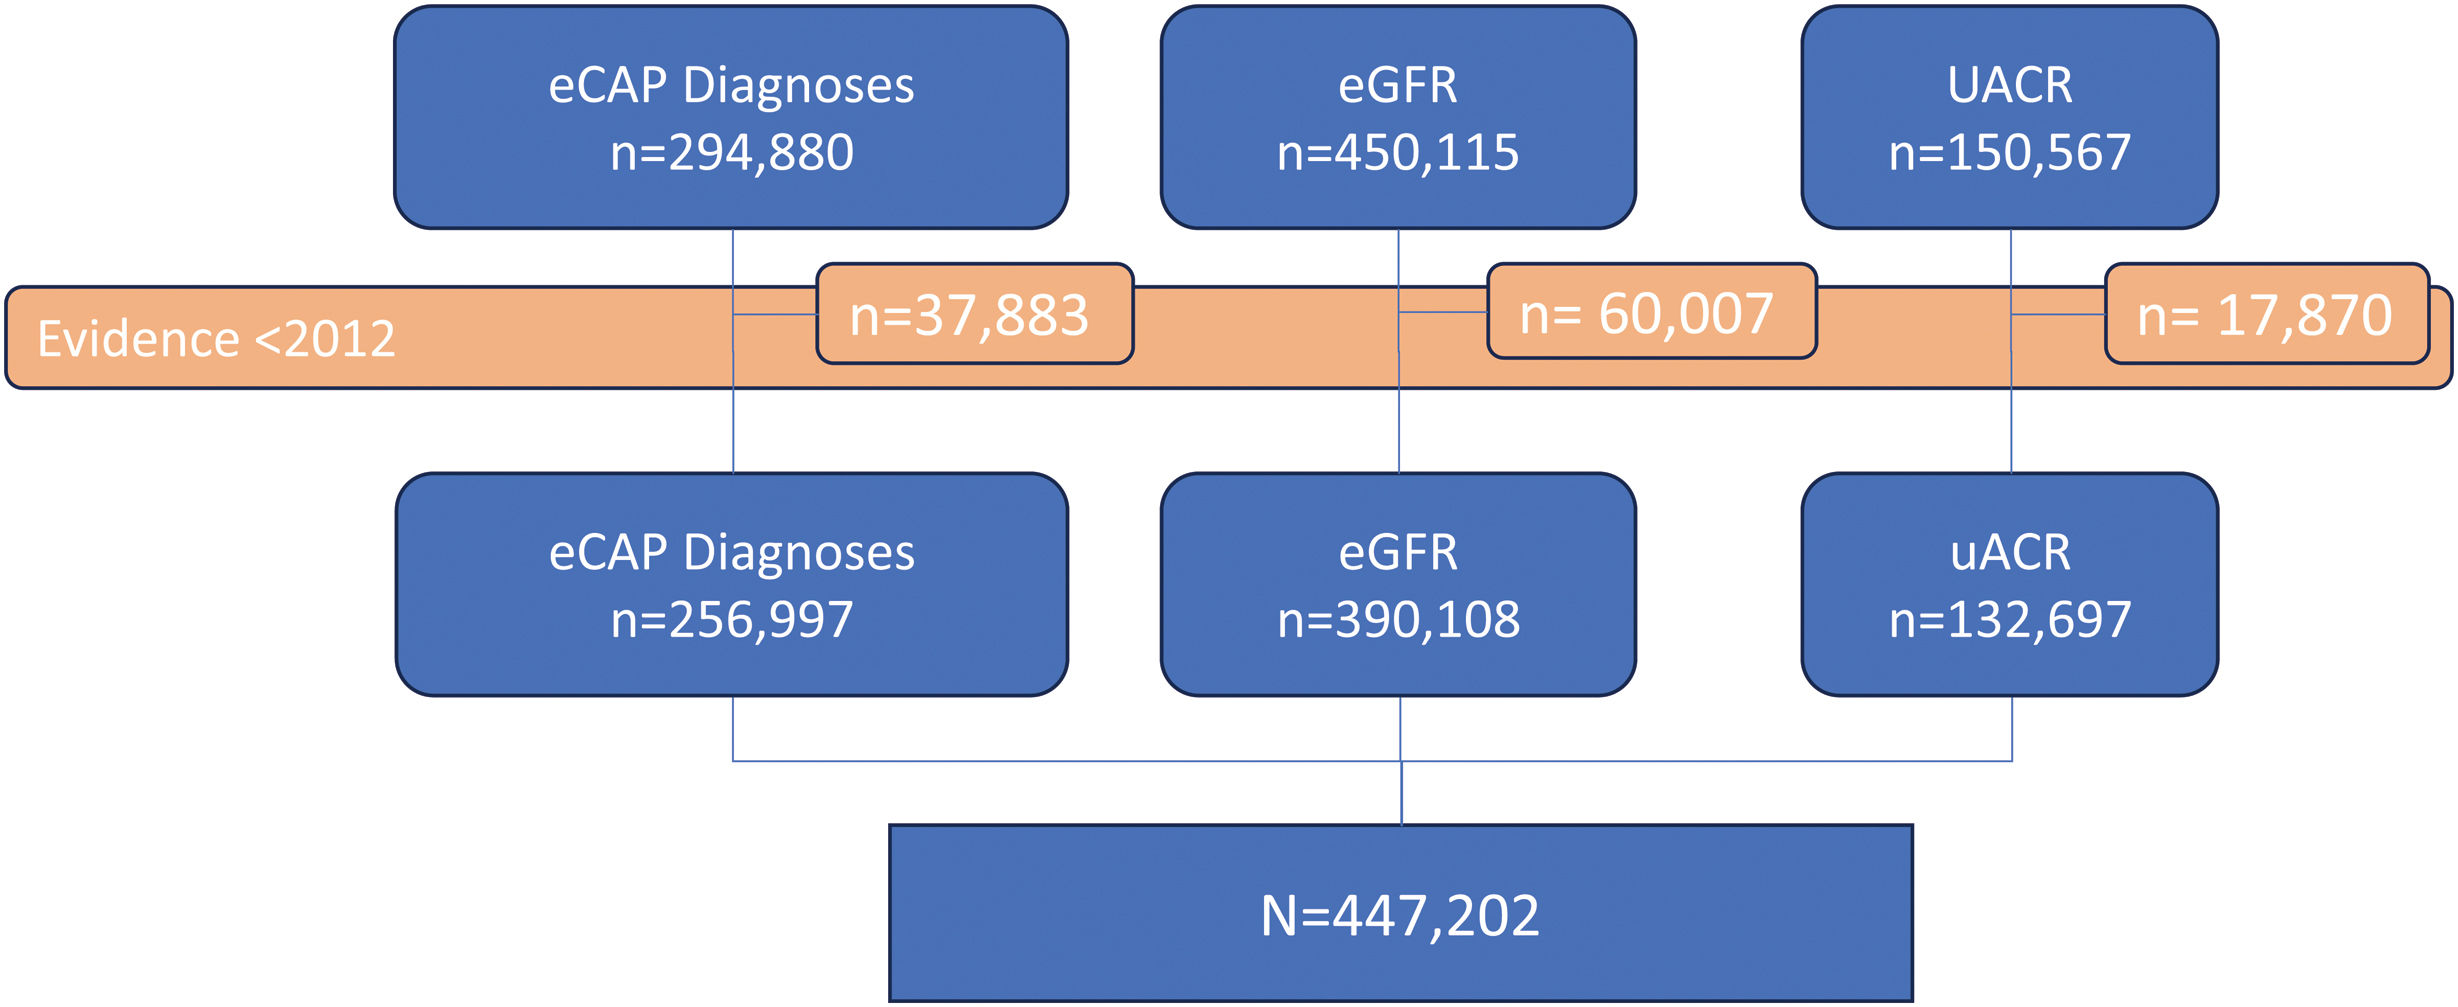
ResultsThe overall population meeting any criteria for CKD evidence comprised 447,202 subjects. Among them, 256,997 (57.5%) presented a diagnostic code for CKD at any moment during the study period, 390,108 (87.23%) had a confirmed eGFR measure<60ml/min/1.73m2, and 132,697 (29.7%) had a confirmed UACR test ≥30mg/g (Fig. 1).
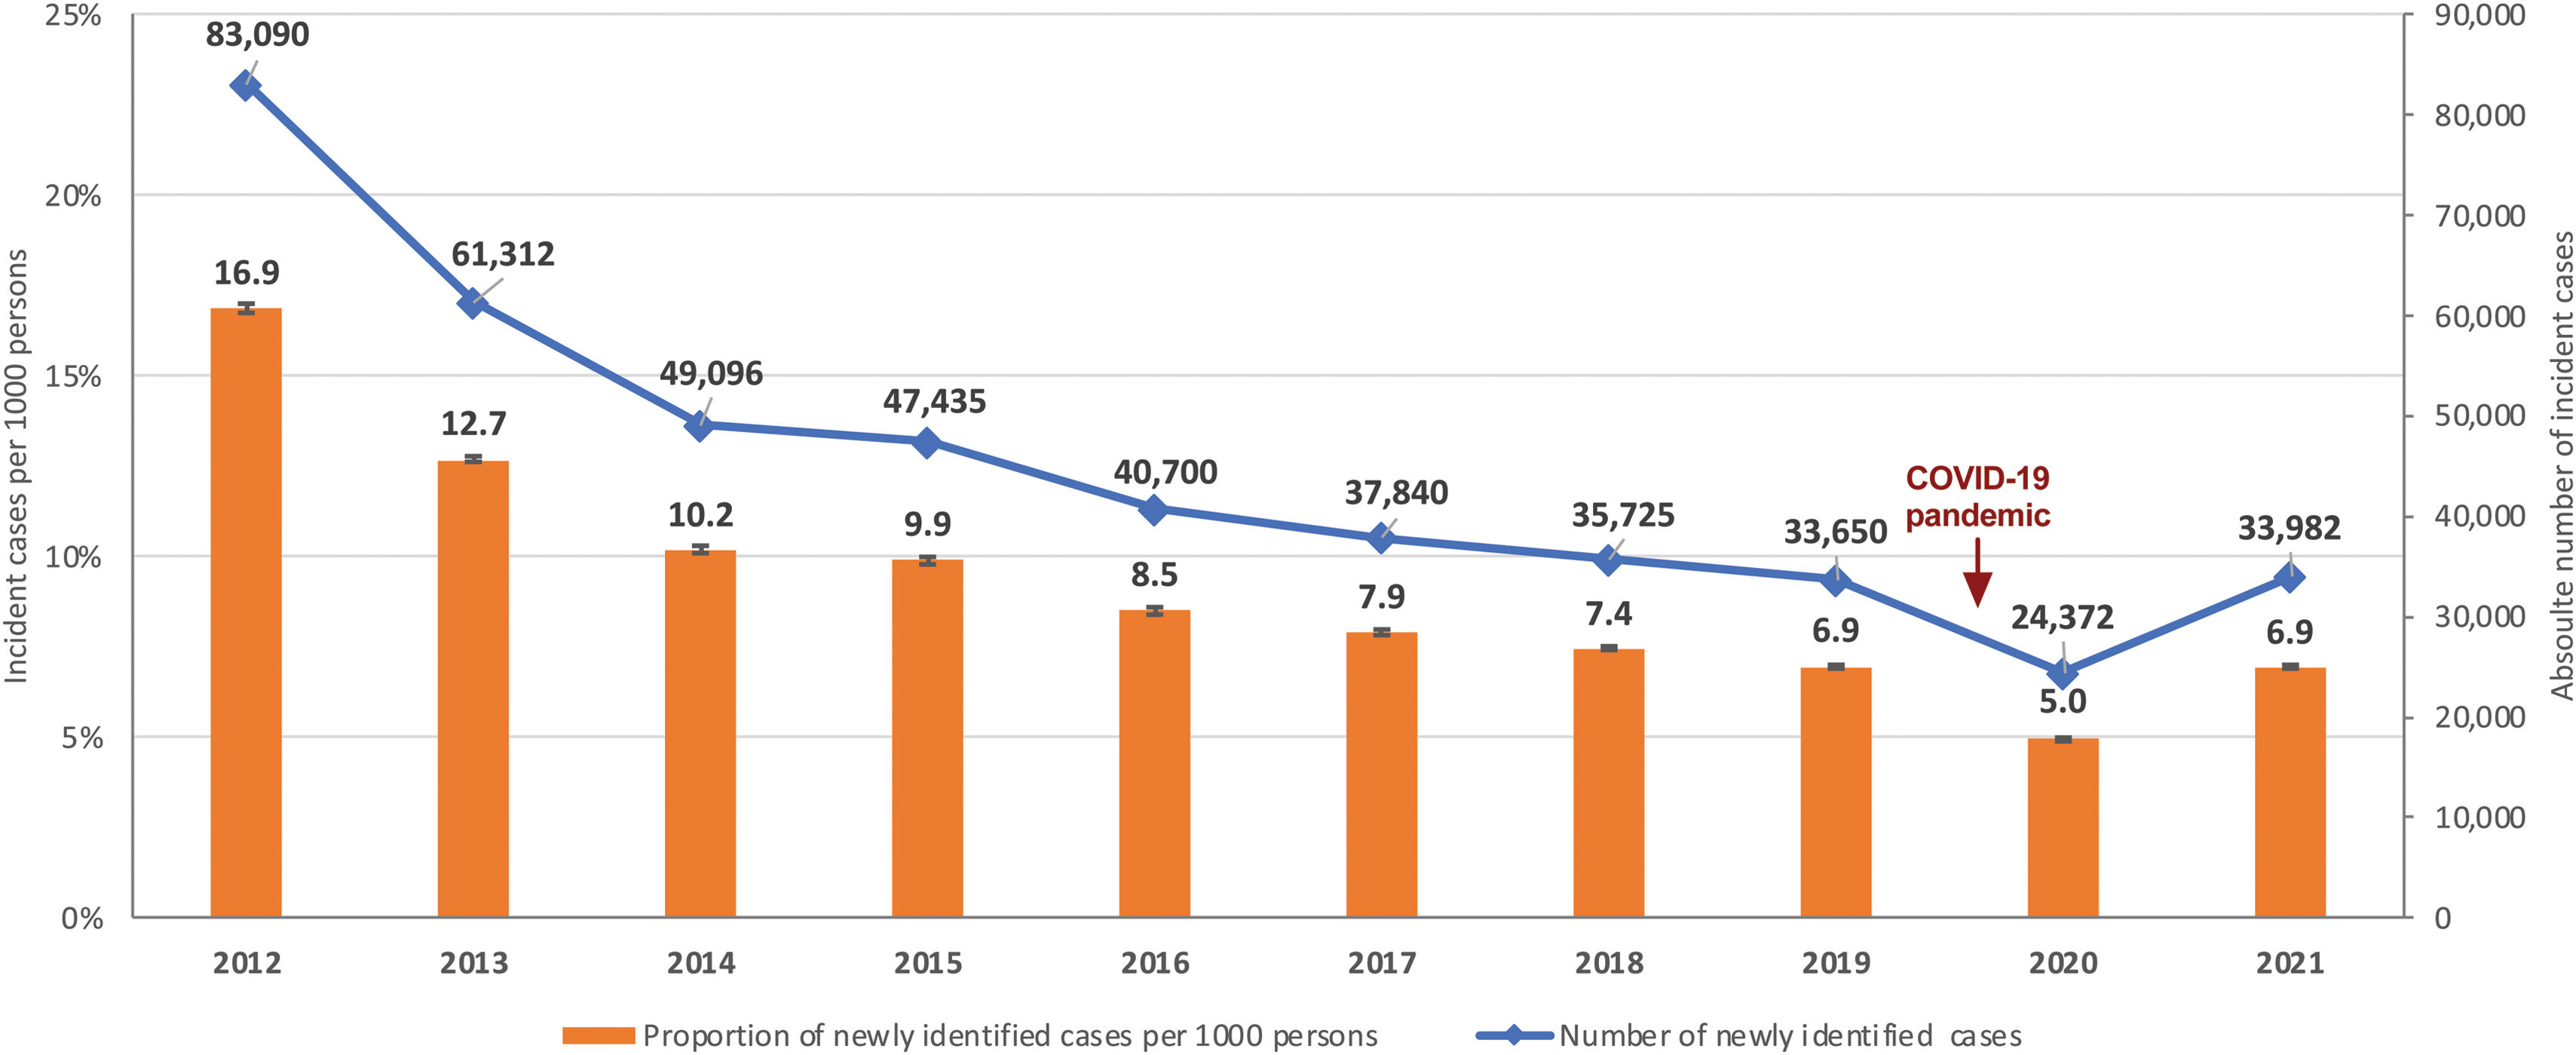
The number of newly identified cases significantly decreased during the initial years of the study, halving by 2016 and declining more steadily until 2019 (Fig. 2). There was another notable decrease in 2020, coinciding with the onset of the COVID-19 pandemic, with the number of newly identified cases falling to nearly one-third of those observed in 2019, followed by a recovery in 2021.
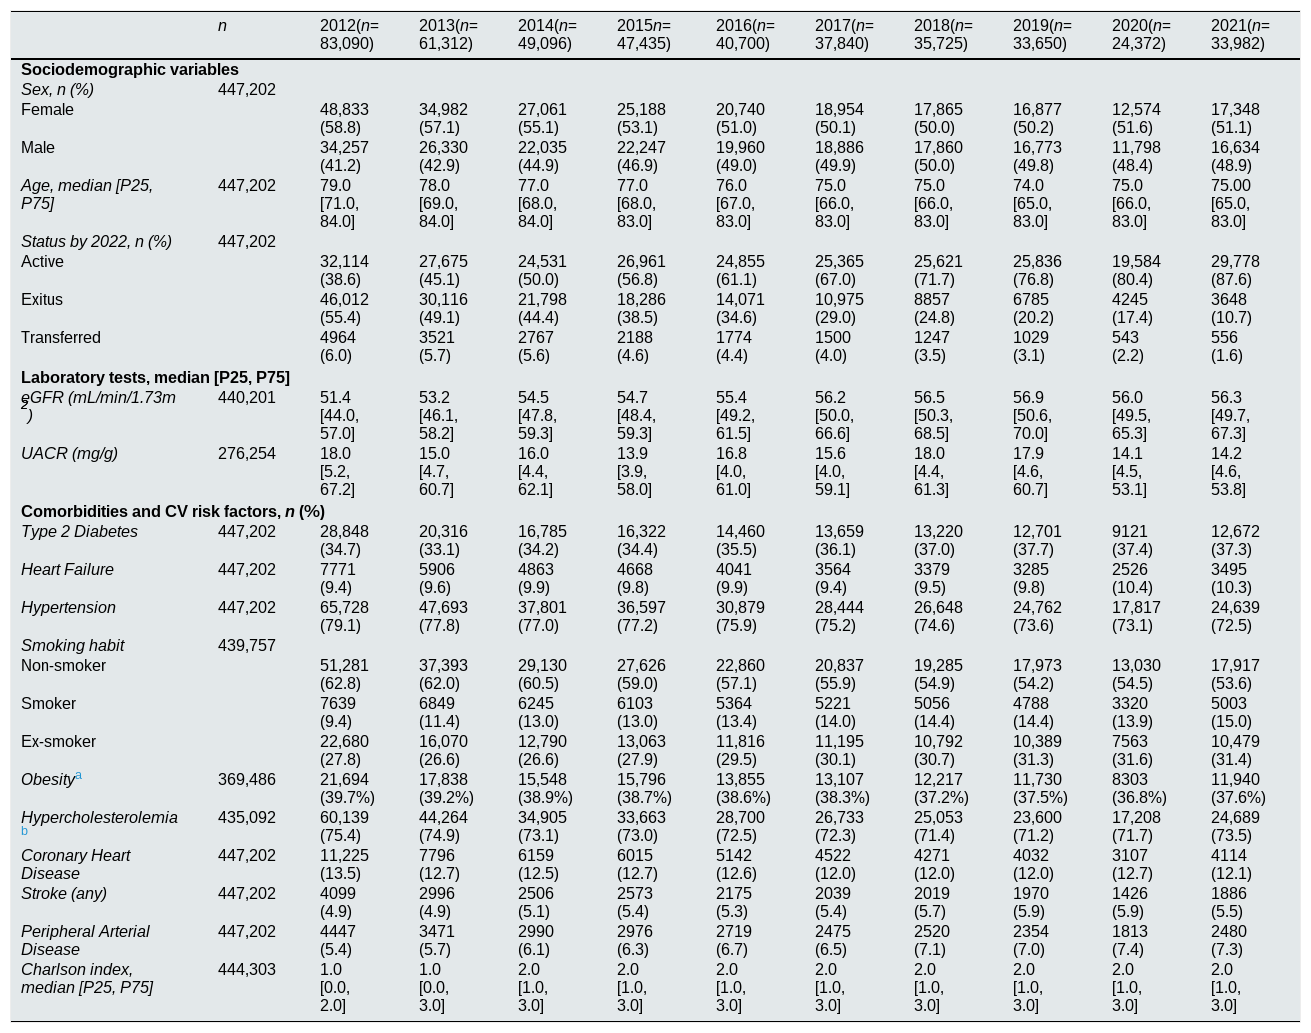
Over the years, there was a noticeable shift in the sex distribution among newly detected cases (Table 1). The proportion of females decreased until 2017 to match that of males and then stabilised (58.8% females in 2012, 50% in 2017, and 51.1% in 2021; P<0.001). Conversely, the trend for age moved in the opposite direction: the median [IQR] age was 79 [71–84] years in 2012, decreased to 75 [66–83] years in 2017, and remained at 75 [65–83] years in 2021 (P<0.001).
Sociodemographic and clinical variables of the CKD cohort by year.
| n | 2012(n=83,090) | 2013(n=61,312) | 2014(n=49,096) | 2015n=47,435) | 2016(n=40,700) | 2017(n=37,840) | 2018(n=35,725) | 2019(n=33,650) | 2020(n=24,372) | 2021(n=33,982) | |
|---|---|---|---|---|---|---|---|---|---|---|---|
| Sociodemographic variables | |||||||||||
| Sex, n (%) | 447,202 | ||||||||||
| Female | 48,833 (58.8) | 34,982 (57.1) | 27,061 (55.1) | 25,188 (53.1) | 20,740 (51.0) | 18,954 (50.1) | 17,865 (50.0) | 16,877 (50.2) | 12,574 (51.6) | 17,348 (51.1) | |
| Male | 34,257 (41.2) | 26,330 (42.9) | 22,035 (44.9) | 22,247 (46.9) | 19,960 (49.0) | 18,886 (49.9) | 17,860 (50.0) | 16,773 (49.8) | 11,798 (48.4) | 16,634 (48.9) | |
| Age, median [P25, P75] | 447,202 | 79.0 [71.0, 84.0] | 78.0 [69.0, 84.0] | 77.0 [68.0, 84.0] | 77.0 [68.0, 83.0] | 76.0 [67.0, 83.0] | 75.0 [66.0, 83.0] | 75.0 [66.0, 83.0] | 74.0 [65.0, 83.0] | 75.0 [66.0, 83.0] | 75.00 [65.0, 83.0] |
| Status by 2022, n (%) | 447,202 | ||||||||||
| Active | 32,114 (38.6) | 27,675 (45.1) | 24,531 (50.0) | 26,961 (56.8) | 24,855 (61.1) | 25,365 (67.0) | 25,621 (71.7) | 25,836 (76.8) | 19,584 (80.4) | 29,778 (87.6) | |
| Exitus | 46,012 (55.4) | 30,116 (49.1) | 21,798 (44.4) | 18,286 (38.5) | 14,071 (34.6) | 10,975 (29.0) | 8857 (24.8) | 6785 (20.2) | 4245 (17.4) | 3648 (10.7) | |
| Transferred | 4964 (6.0) | 3521 (5.7) | 2767 (5.6) | 2188 (4.6) | 1774 (4.4) | 1500 (4.0) | 1247 (3.5) | 1029 (3.1) | 543 (2.2) | 556 (1.6) | |
| Laboratory tests, median [P25, P75] | |||||||||||
| eGFR (mL/min/1.73m2) | 440,201 | 51.4 [44.0, 57.0] | 53.2 [46.1, 58.2] | 54.5 [47.8, 59.3] | 54.7 [48.4, 59.3] | 55.4 [49.2, 61.5] | 56.2 [50.0, 66.6] | 56.5 [50.3, 68.5] | 56.9 [50.6, 70.0] | 56.0 [49.5, 65.3] | 56.3 [49.7, 67.3] |
| UACR (mg/g) | 276,254 | 18.0 [5.2, 67.2] | 15.0 [4.7, 60.7] | 16.0 [4.4, 62.1] | 13.9 [3.9, 58.0] | 16.8 [4.0, 61.0] | 15.6 [4.0, 59.1] | 18.0 [4.4, 61.3] | 17.9 [4.6, 60.7] | 14.1 [4.5, 53.1] | 14.2 [4.6, 53.8] |
| Comorbidities and CV risk factors, n (%) | |||||||||||
| Type 2 Diabetes | 447,202 | 28,848 (34.7) | 20,316 (33.1) | 16,785 (34.2) | 16,322 (34.4) | 14,460 (35.5) | 13,659 (36.1) | 13,220 (37.0) | 12,701 (37.7) | 9121 (37.4) | 12,672 (37.3) |
| Heart Failure | 447,202 | 7771 (9.4) | 5906 (9.6) | 4863 (9.9) | 4668 (9.8) | 4041 (9.9) | 3564 (9.4) | 3379 (9.5) | 3285 (9.8) | 2526 (10.4) | 3495 (10.3) |
| Hypertension | 447,202 | 65,728 (79.1) | 47,693 (77.8) | 37,801 (77.0) | 36,597 (77.2) | 30,879 (75.9) | 28,444 (75.2) | 26,648 (74.6) | 24,762 (73.6) | 17,817 (73.1) | 24,639 (72.5) |
| Smoking habit | 439,757 | ||||||||||
| Non-smoker | 51,281 (62.8) | 37,393 (62.0) | 29,130 (60.5) | 27,626 (59.0) | 22,860 (57.1) | 20,837 (55.9) | 19,285 (54.9) | 17,973 (54.2) | 13,030 (54.5) | 17,917 (53.6) | |
| Smoker | 7639 (9.4) | 6849 (11.4) | 6245 (13.0) | 6103 (13.0) | 5364 (13.4) | 5221 (14.0) | 5056 (14.4) | 4788 (14.4) | 3320 (13.9) | 5003 (15.0) | |
| Ex-smoker | 22,680 (27.8) | 16,070 (26.6) | 12,790 (26.6) | 13,063 (27.9) | 11,816 (29.5) | 11,195 (30.1) | 10,792 (30.7) | 10,389 (31.3) | 7563 (31.6) | 10,479 (31.4) | |
| Obesitya | 369,486 | 21,694 (39.7%) | 17,838 (39.2%) | 15,548 (38.9%) | 15,796 (38.7%) | 13,855 (38.6%) | 13,107 (38.3%) | 12,217 (37.2%) | 11,730 (37.5%) | 8303 (36.8%) | 11,940 (37.6%) |
| Hypercholesterolemiab | 435,092 | 60,139 (75.4) | 44,264 (74.9) | 34,905 (73.1) | 33,663 (73.0) | 28,700 (72.5) | 26,733 (72.3) | 25,053 (71.4) | 23,600 (71.2) | 17,208 (71.7) | 24,689 (73.5) |
| Coronary Heart Disease | 447,202 | 11,225 (13.5) | 7796 (12.7) | 6159 (12.5) | 6015 (12.7) | 5142 (12.6) | 4522 (12.0) | 4271 (12.0) | 4032 (12.0) | 3107 (12.7) | 4114 (12.1) |
| Stroke (any) | 447,202 | 4099 (4.9) | 2996 (4.9) | 2506 (5.1) | 2573 (5.4) | 2175 (5.3) | 2039 (5.4) | 2019 (5.7) | 1970 (5.9) | 1426 (5.9) | 1886 (5.5) |
| Peripheral Arterial Disease | 447,202 | 4447 (5.4) | 3471 (5.7) | 2990 (6.1) | 2976 (6.3) | 2719 (6.7) | 2475 (6.5) | 2520 (7.1) | 2354 (7.0) | 1813 (7.4) | 2480 (7.3) |
| Charlson index, median [P25, P75] | 444,303 | 1.0 [0.0, 2.0] | 1.0 [0.0, 3.0] | 2.0 [1.0, 3.0] | 2.0 [1.0, 3.0] | 2.0 [1.0, 3.0] | 2.0 [1.0, 3.0] | 2.0 [1.0, 3.0] | 2.0 [1.0, 3.0] | 2.0 [1.0, 3.0] | 2.0 [1.0, 3.0] |
The eGFR values at the first evidence of CKD showed similarly a steady upward trend until 2017, increasing from 51.4 [44.0–57.0]mL/min/1.73m2 in 2012 to 56.2 [50.0–66.6]mL/min/1.73m2, and then remained stable to 2021 (P<0.001; Table 1). Although the median UACR values showed variations across time, there was a general trend to a decrease from 18 [5.2–67.2]mg/g in 2012 to 14.2 [4.6–53.8]mg/g in 2021 (Table 1), with a mean annual decrease of 0.56mg/g (P<0.001).
There was a lowering prevalence of some comorbid diseases throughout the period (Table 1), such as hypertension (from 79.1% in 2012 to 72.5% in 2021; P<0.001) and obesity (39.6% in 2012 and 37.5% in 2021; P<0.001). On the contrary, we observed an increase in T2DM (34.7–37.3%; P<0.001), HF (9.4 to 10.3%; P<0.001), stroke (4.9–5.5%; P<0.001), and peripheral arterial disease (5.4–7.3%; P<0.001). The median Charlson comorbidity index showed an upper trend over time, rising from 1.0 [0–3] in 2012 to 2.0 [1–3] in the latest assessment (P<0.001), indicating a shift from a low to a moderate burden of comorbid conditions.
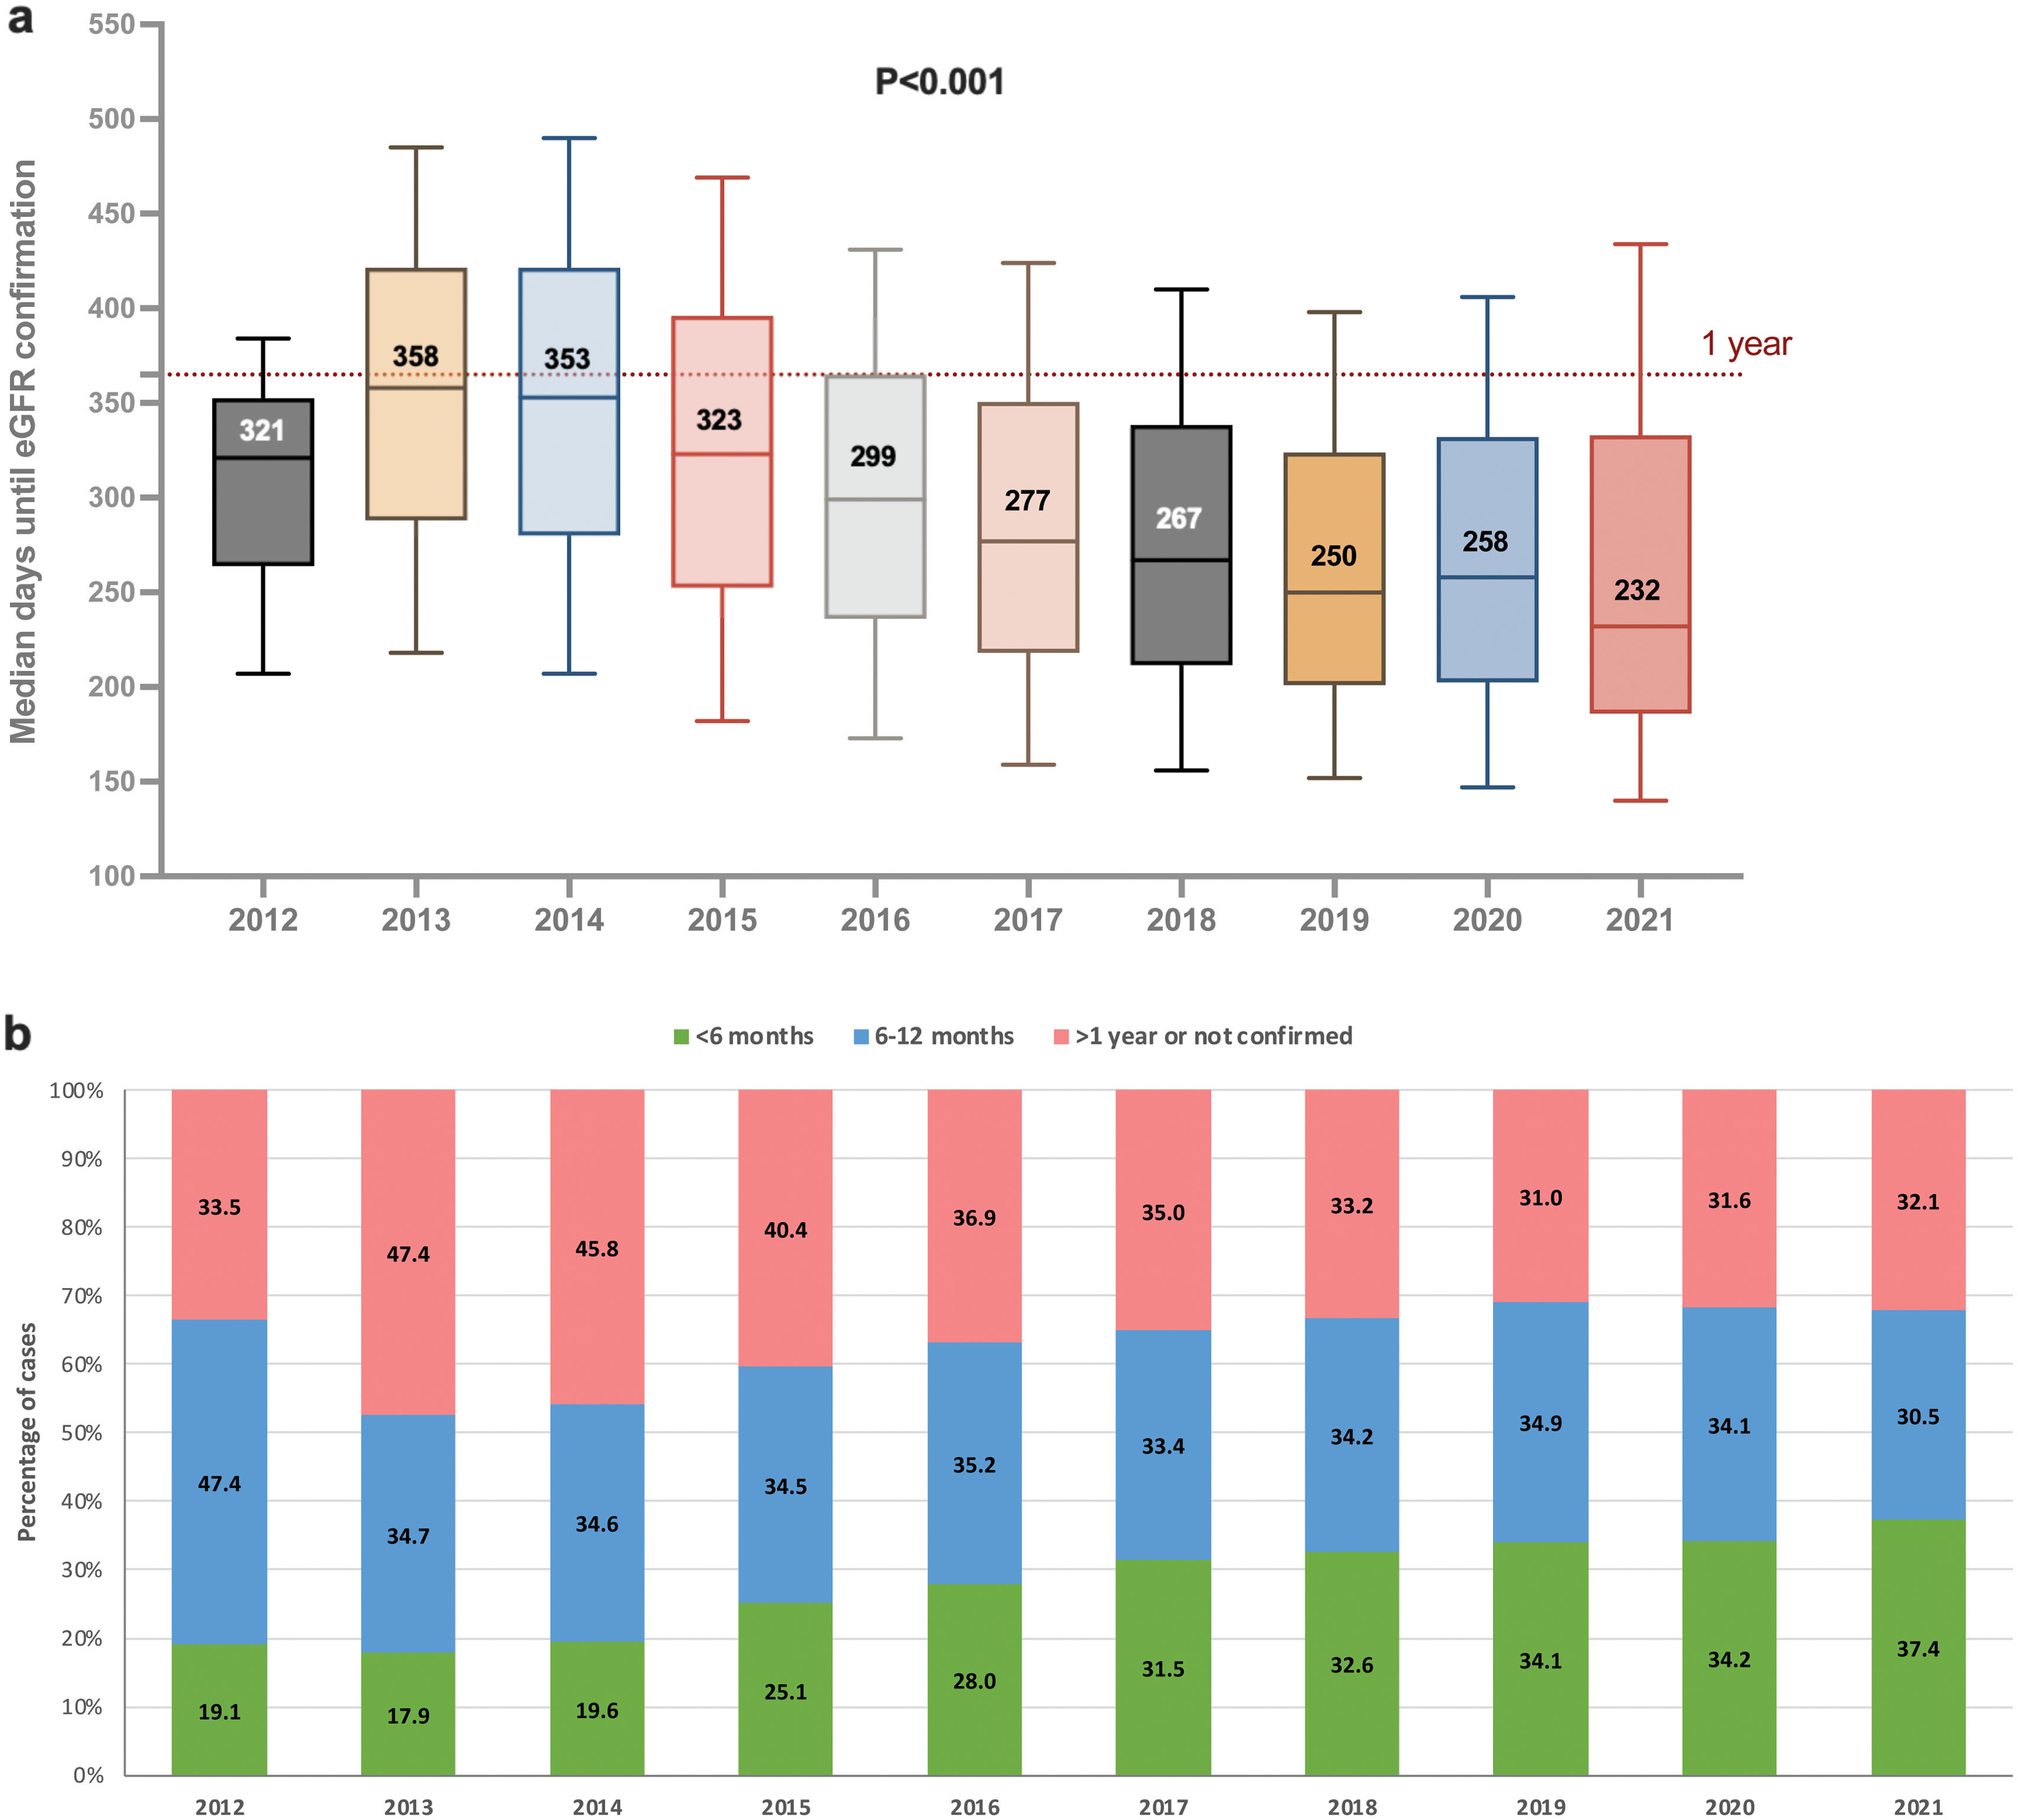
In the identification of CKD cases by altered eGFR, the median time between the first and confirming eGFR determination showed a decline over time from almost one year in 2012 (median 321 [207–348] days) to 232 [140–434] days in 2021 (Fig. 3a). Consequently, the percentage of confirmed CKD cases eGFR-tested within 6 months increased notably in 2021, although 32.1% were not confirmed at 12 months (Fig. 3b). Conversely, in cases identified by altered UACR, the median time elapsed until that UACR confirmation increased over time, from 303 [200–383] days in 2012 to 411 [217–758] days in 2021 (Fig. 4a), with less than 20% of cases undergoing a UACR confirmatory test in the first 6 months throughout the years and 55.9% of cases without a confirmation within 12 months still in 2021 (Fig. 4b).
The availability of renal parameters to classify the identified CKD patients at baseline vastly varied (Supplementary Fig. 1). The proportion of newly identified patients without available eGFR measurements at baseline was very low (2.3% in 2012) and decreased progressively to 0.6% in 2021, while the proportion of newly detected cases without concomitant UACR measures at baseline decreased from 59.3% in 2012 to 25.5% in 2021 (P<0.001). According to these baseline lab measurements, the proportion of newly identified cases at the moderate KDIGO risk stage increased from 64.4% in 2012 to 72.5% in 2017 and then stabilised at 71.1% in 2021. Conversely, those at high and very high risk decreased from 25.7% and 7.1% in 2012 to 17.1% and 4.8% in 2017 and to 17.3% and 5.4% in 2021, respectively (Supplementary Fig. 2).
In the presence of CKD evidence, professional approaches to dual evaluation using eGFR and UACR for prognostic purposes also evolved. In 2012, UACR was available at the index date for 27.8% of patients, with an additional 4.5% being evaluated within the first 6 months after CKD evidence (Fig. 5a). These percentages increased steadily until 2018, reaching 40.5% and 7.4%, respectively. Subsequently, there was a slight decline until 2021. The proportion of CKD cases where UACR was not requested within 12 months of the index date decreased consistently from 61.1% in 2012 to 55.7% in 2021.
(a) Evolution of the time from index date and first posterior UACR determination in the presence of CKD evidence, and (b) evolution of the proportion of newly identified patients with biochemical evidence of CKD and a documented ICD-10-CM code before 6 months, between 6 and >12 months. Footnote: CKD, chronic kidney disease; ICD-10-CM, International Classification of Diseases, tenth revision, clinical modification; UACR, urine albumin/creatinine ratio.
A 33.3% of all newly identified cases were diagnosed at index date or within six months after their first evidence of CKD. For cases entering the study based on laboratory evidence, diagnostic codification within six months after the initial evidence increased from 11.8% in 2012 to 20.2% in 2016, then decreased to 11.6% in 2021 (Fig. 5b). Conversely, the percentage of cases without a registered diagnosis after 12 months decreased from 82.6% in 2012 to 73.5% in 2016, but then increased to 87.4% in 2021. The pattern of patients receiving a CKD diagnosis within one year of lab evidence was consistent across KDIGO risk stages (Supplementary Fig. 3). Initially, there was an increase in timely diagnoses within six months for all risk stages until 2016 (18–36% across stages), followed by a steady decline through the end of the observation period (9–25% across stages). By 2021, the highest proportion of timely diagnoses was observed among patients classified as very high risk (25.1%), followed by those at high risk (18.3%) and those at moderate risk (9.0%).
DiscussionIn the present study, 447,202 cases with newly identified CKD evidence were identified in primary care from 2012 to 2021. The study revealed changes in the profile of comorbidities and some improvements in disease evaluation, diagnosis, and early recognition. Despite these advances, there remains significant potential for further improvement.
Our findings complement previous Spanish epidemiological studies on CKD. Population-based studies such as EPIRCE and ENRICA-Renal, as well as the IBERICAN-Renal study in primary care,4–6 have established the substantial burden of CKD in Spain. More recent real-world evidence from Spanish routinely collected healthcare data has further characterised patients with CKD according to KDIGO risk categories, reinforcing the value of using both eGFR and albuminuria for risk stratification in clinical practice.41 Unlike these studies, the present analysis focused on newly identified CKD evidence and on temporal patterns in biochemical confirmation, UACR assessment, and diagnostic coding. Therefore, our results add a complementary perspective by describing not only who is identified with CKD in primary care, but also how and when CKD evidence is confirmed and registered in routine clinical practice.
While some observations suggest an increasing trend in CKD incidence over the last decades,3,42 other studies report conflicting results, with no clear evidence of such a rise.43 In the present study, we observed a steep decrease, smoother afterwards, with eventual stabilisation of newly identified cases until 2020, with a 30% decrease linked to the COVID-19 pandemic and recovery in 2021.44 A study conducted in Italy between 2012 and 2021 also reported a marginal reduction in the yearly CKD-diagnosed incidence that transitioned towards a slight increase during the COVID-19 pandemic.45 This rise in newly detected cases in 2021 could be attributed to the resumption of healthcare services and the backlog of delayed reporting from 2020.46
From 2012 to 2017, we saw demographic and clinical shifts among newly identified CKD cases over the follow-up period, which then stabilised. By 2021, the proportion of females newly identified with CKD decreased, and patients were identified at younger ages and earlier renal risk stages. Although these findings may indicate improvements in CKD screening and detection, we mainly attribute them to a ‘cleaning effect’ of the cohort, as detailed in the limitations section. Additionally, while we observed modest declines in hypertension and obesity, other comorbidities, such as T2DM, HF, and peripheral arterial disease, increased. Ageing, T2DM, hypertension, and obesity are important risk factors for the development and progression of CKD.2,47 T2DM is the leading contributor to the global CKD burden and is the only cause that has continued rising since 1990.2 This rise is driven significantly by population growth and ageing, with obesity and hypertension identified as primary modifiable risk factors.2,47 Detection at an earlier age and increased risk-oriented screening could explain the decrease in hypertension and obesity that we observed. However, the growth in the global increase in the prevalence of T2DM, where CKD screening is more frequent, may explain the rise in T2DM-associated CKD cases. The results underscore the need for early T2D detection and the development of tailored early intervention strategies, which are crucial to prevent or delay the development of CKD due to T2DM and to improve survival rates.47
Primary care has a crucial role in the early detection of CKD, and the quality of care indicators are of utmost importance.9,48 In our study, most patients had available eGFR measurements at baseline. Additionally, during the observation period, we noted a reduction in the median time between the first and second qualifying eGFR determinations, with a 50% increase in confirmations within 6 months. However, a significant third of cases were not confirmed beyond 1 year. The 99.4% of patients with a measured eGFR in 2021 compares favourably with the 78–90% observed in cross-sectional studies,18,19 and the median time to confirmation of eight months is similar to the approximately six-month interval previously reported.11
Regarding UACR testing, our findings indicated a 50% increase in available measures at baseline during the study period, which we mainly attribute to more extended observation periods. In fact, the proportion of cases with UACR requested within 12 months decreased from 2017 to 2021. The very low prevalence of UACR testing aligns with previous research, ranging from 36% to 60% in patients with established CKD.15,16,25,28 The proportion of patients undergoing a second confirmatory UACR test within 6 months was persistently below 20% across the years. This aligns with studies reporting that 16.3–39% of patients received UACR testing within 6 months of CKD evidence 10,49 or 17.4–21.2% underwent annual dual eGFR/UACR testing.19
Overall, previous findings indicate that less than half of incident CKD patients undergo either eGFR or UACR confirmatory tests within six months of the first abnormal value.50,51 Although we observed improvements in the prevalence and timeliness of follow-up assessments for eGFR over time, the persistent high proportion of patients without UACR measurements and the increasing delay in obtaining confirmatory tests cause significant concern. Dual evaluation is strongly recommended because both abnormal eGFR and albuminuria are independently associated with an increased risk of CV complications such as coronary artery disease, stroke, or heart failure, CKD progression to end-stage renal disease (ESRD), and death.1,52–54 Furthermore, studies have shown that patients with CKD who do not undergo albuminuria testing have reduced odds of being referred to a nephrologist.16,18 Lastly, albuminuric patients can benefit from several therapeutic agents that reduce albuminuria levels to provide cardiorenal protection, decreasing the risk of CVD outcomes and CKD progression.1,54
In our study, an important number of newly identified cases (more than 85%) lacked a documented ICD-10-CM CKD code within 6 months of confirmed biochemical evidence, a proportion that was even higher in moderate-risk stages. Moreover, we observed a negative trend over time, with a decrease in timely coded CKD cases across all risk stages starting in 2017. These results align with the CVD-REAL international retrospective study, where 62–84% of patients at stage G3 CKD were not ICD-9/10 documented up to 6 months after the second qualifying eGFR measurement, and only 4–25% of undiagnosed cases received a diagnosis at follow-up.22 Individual studies have also described low CKD registration, with the proportion of registered cases in CKD patients at stages G3-G5 ranging from 25–55%.12,15,24,29,49 Although only a few studies are available to compare our observed time variations, a recent Japanese cohort of patients with eGFR and/or quantitative proteinuria indicated that patient coding slightly increased between 2005 and 2020.20 Accurate CKD coding is crucial in assessing the quality of care provided to CKD patients in primary care settings. Timely coding has been correlated with an improvement in CKD management and monitoring practices (BP, creatinine, UACR, and HbA1c monitoring), increased rates of appropriate medication prescriptions (angiotensin-converting enzyme inhibitors [ACEi], angiotensin receptor blockers [ARBs], MRAs, SGLT2i, and lipid-lowering drugs) and attenuation in eGFR decline.23 Conversely, delayed diagnosis and coding are associated with adverse outcomes in CKD progression, such as advancement to stage G4/5 and eventual kidney failure, elevated risks of myocardial infarction, stroke, and a composite outcome comprising myocardial infarction, stroke, and hospitalisation for heart failure.23
Based on the need to increase disease coding and reduce delayed time to diagnosis in CKD in the primary care setting, several interventions have been proposed or implemented, including targeted training and education, education of clinical decision support systems (CDSS), automated alerts and reminders, country-specific prediction models, or digital health interventions.7,45,55–59 These interventions have moderately increased CKD awareness, UACR, and eGFR testing, highlighting the critical role of innovative interventions, including IT tools, education initiatives, and interdisciplinary collaboration. However, further efforts are needed to fully address the early detection and diagnosis gaps, ensuring more widespread and consistent implementation.
The study exhibited several strengths. Its large-scale, population-based design using real-world data from routine clinical practice provided a comprehensive view of CKD epidemiology within a diverse demographic cohort. Furthermore, our study departs from conventional approaches by incorporating both eGFR and UACR values to define index cases, broadening the scope beyond the typical focus on eGFR alone, which often centres on stages G3a-5. This inclusive methodology enabled the identification of CKD cases across a wider spectrum of severity, encompassing patients with preserved or mildly reduced kidney function (eGFR categories G1 and G2) yet moderate or substantial kidney damage (albuminuria category A2 and A3, respectively). Furthermore, the study allowed for the examination of trends and changes over time, offering a more dynamic understanding of CKD management and helping identify temporal patterns that may inform targeted interventions and resource allocation.
Limitations include the potential inaccuracy and incompleteness of the data extracted from electronic medical records, which depend on the diligence of healthcare professionals in recording information. Moreover, while the SIDIAP database covers a significant portion of the Catalan population, findings may not be generalisable to populations outside Catalonia or those with different healthcare systems. In addition, as a retrospective study, it is subject to inherent limitations, such as the inability to establish causality or adjust for unmeasured variables. Another limitation is that our results suggest that prevalent cases were not thoroughly cleaned. Relying on CKD code registration history and a year of laboratory evidence at the study's start may have been insufficient to exclude prevalent cases. This likely resulted in a mixed population of newly identified and prevalent CKD patients in the early years, skewing the data. Since the study focused on newly detected cases, including prevalent cases from the initial years could have led to differences in the population across years, making the early data less representative of true incident cases and impacting overall data comparability. However, there was a shift in most trends starting in 2017 that may be interpreted as a change in the nature of patients, likely due to the inclusion of prevalent cases in the first years of the study. This collateral finding can be of huge importance for future research on newly identified cases, suggesting the need for a washout period of up to a 5-year of previous lab evidence to ensure accuracy. Despite this limitation, we believe that the 2017–2021 period truly represents newly detected cases. Additionally, varying follow-up periods may affect the comparability of results over the years, as later years had less posterior information available. Finally, this paper primarily focused on investigating trends in CKD incidence, detection, recognition, and registration over time. Forthcoming research will complement other aspects, such as BP control, CVD risk assessment, and the use of recommended treatments, as integral components of comprehensive CKD care that should provide a more comprehensive understanding of CKD management practices and their impact on patient outcomes. Finally, our estimates should not be interpreted as the true biological incidence of CKD in the underlying population. They reflect newly identified CKD cases captured in primary care electronic health records through diagnostic coding and/or available laboratory evidence. Therefore, temporal changes in the number of detected cases may have been influenced by testing practices, UACR availability, healthcare use, and diagnostic registration patterns.
ConclusionsOur study reveals some improvements in timely CKD detection and recognition, indicating advancements in diagnostic protocols and healthcare provider awareness. However, it also highlights persistent challenges that have shown no improvement over the years: an important number of patients lacked UACR testing, and many with biochemical evidence of CKD remained unregistered, potentially compromising access to treatments to preserve renal function. Targeted interventions must be developed to optimise CKD management and improve patient outcomes by identifying and addressing these gaps.
Authors’ contributionsB S-G, OC-P, M B-D, X T-P and N J-M contributed to the conception of the study. B-S-G and O C-P designed the study. B-S-G coordinated and supervised the study. O C-P was involved in data analysis and interpretation. B S-G, S C-G, J R-S and D B-L provided clinical and A A-R lab expertise in interpreting the results. M B-D, X T-P and N J-M were involved in interpreting results. All authors critically reviewed the paper, read and approved the final submitted version and are accountable for the accuracy and integrity of the work.
FundingThe Alliance Boehringer Ingelheim España and Eli Lilly S.A. funded this study. This was a collaborative research study where Boehringer Ingelheim was involved in the design and interpretation of the results but was not the regulatory sponsor. Boehringer Ingelheim and Eli Lilly S.A. were given the opportunity to review the manuscript for medical and scientific accuracy, as well as intellectual property considerations.
Conflict of interestsAuthors have received no honoraria for this work and declare no conflict of interest. The private funding of the study did not affect the integrity and objectivity of the research.
Availability of data and materialsThe datasets used and/or analysed during the current study are available from the corresponding author upon reasonable request.
Medical writing and editorial support were provided by Mònica Gratacòs funded by Boehringer Ingelheim España, S.A. and Eli Lilly and Company.
The followings are the supplementary data to this article: