



Malnutrition, sarcopenia, and protein–energy wasting (PEW) are frequent and clinically relevant in patients undergoing peritoneal dialysis (PD). Reliable and accessible tools to assess muscle and adipose tissue beyond bioimpedance are needed for routine clinical practice. Nutritional ultrasound allows bedside evaluation of regional muscle and fat compartments and may complement traditional nutritional assessment.
MethodsWe conducted a prospective, single-centre study in PD patients with a six-month follow-up. Nutritional ultrasound was used to assess quadriceps rectus femoris (QRF) thickness, width, and cross-sectional area, thigh supramuscular fat, and abdominal adipose layers. Ultrasound findings were integrated with bioimpedance-derived body composition indices, functional tests (handgrip strength and Short Physical Performance Battery), and nutritional scores, including the Malnutrition–Inflammation Score. PEW was classified according to the simplified 2014 International Society of Renal Nutrition and Metabolism score.
ResultsFifty-nine patients were included at baseline, and 45 completed the six-month follow-up. Ultrasound-derived QRF measurements showed consistent associations with lean tissue index, phase angle, handgrip strength, physical performance, and PEW severity. ROC analysis demonstrated moderate discriminatory ability of QRF thickness and reduced preperitoneal fat for identifying PEW and dynapenia. Over six months, quadriceps thickness and cross-sectional area increased, while functional performance and global nutritional scores remained stable. Fat accumulation was mainly observed in the thigh supramuscular compartment, with no significant changes in abdominal adipose layers. Sex-related differences in muscle and fat distribution were observed.
ConclusionsNutritional ultrasound is a feasible and informative tool for morphofunctional assessment and follow-up in peritoneal dialysis. It complements bioimpedance and functional evaluation by providing regional information on muscle and fat compartments and detecting longitudinal changes not captured by conventional methods. Its integration into routine PD care may support individualized nutritional monitoring. Further multicentre studies are required to define reference values and prognostic implications.
La desnutrición, la sarcopenia y el desgaste proteico-energético son frecuentes y clínicamente relevantes en pacientes en diálisis peritoneal. En la práctica clínica habitual se necesitan herramientas fiables y accesibles que permitan evaluar el tejido muscular y adiposo más allá de la bioimpedancia. La ecografía nutricional permite la evaluación a pie de cama de los compartimentos regionales muscular y graso, y puede complementar la valoración nutricional tradicional.
MétodosRealizamos un estudio prospectivo unicéntrico en pacientes en diálisis peritoneal con un seguimiento de seis meses. La ecografía nutricional se utilizó para evaluar el grosor, la anchura y el área transversal del recto femoral del cuádriceps, la grasa supramuscular del muslo y las capas adiposas abdominales. Los hallazgos ecográficos se integraron con índices de composición corporal derivados de bioimpedancia, pruebas funcionales —fuerza de prensión manual y Short Physical Performance Battery— y escalas nutricionales, incluido el Malnutrition–Inflammation Score. El desgaste proteico-energético se clasificó de acuerdo con la escala simplificada de 2014 de la Sociedad Internacional de Nutrición Renal y Metabolismo.
ResultadosSe incluyeron 59 pacientes en la evaluación basal, de los cuales 45 completaron el seguimiento a seis meses. Las mediciones ecográficas del recto femoral del cuádriceps mostraron asociaciones consistentes con el índice de tejido magro, el ángulo de fase, la fuerza de prensión manual, el rendimiento físico y la gravedad del desgaste proteico-energético. El análisis ROC mostró una capacidad discriminativa moderada del grosor del recto femoral del cuádriceps y de la reducción de la grasa preperitoneal para identificar desgaste proteico-energético y dinapenia. Durante los seis meses de seguimiento aumentaron el grosor y el área transversal del cuádriceps, mientras que el rendimiento funcional y las escalas nutricionales globales permanecieron estables. La acumulación de grasa se observó principalmente en el compartimento supramuscular del muslo, sin cambios significativos en las capas adiposas abdominales. También se observaron diferencias relacionadas con el sexo en la distribución muscular y grasa.
ConclusionesLa ecografía nutricional es una herramienta factible e informativa para la evaluación y el seguimiento morfofuncional en diálisis peritoneal. Complementa la bioimpedancia y la evaluación funcional al proporcionar información regional sobre los compartimentos muscular y graso, y al detectar cambios longitudinales no identificados por los métodos convencionales. Su integración en la atención habitual de la diálisis peritoneal puede apoyar una monitorización nutricional individualizada. Se necesitan estudios multicéntricos adicionales para definir valores de referencia y sus implicaciones pronósticas.
Patients with chronic kidney disease (CKD) on dialysis face multiple pathophysiological drivers of malnutrition, including metabolic acidosis, chronic inflammation, oxidative stress, and restrictive dietary patterns. Despite a trend toward liberalized diets, malnutrition remains highly prevalent in peritoneal dialysis (PD). Two syndromes are particularly relevant: sarcopenia, characterized by reduced muscle mass and strength; and protein–energy wasting (PEW) defined by the loss of muscle and fat mass in a catabolic inflammatory milieu.1 Both conditions are associated with poorer clinical outcomes, reduced technique survival, and impaired quality of life.2
In PD, the continuous absorption of dialysate glucose has been linked to fat gain and lean mass loss, and the development of adverse metabolic phenotypes.3 Appetite dysregulation may arise from abdominal distension and osmotic load of dialysate, although available evidence remains mixed.4–7
Accurate assessment of muscle and adipose compartments is therefore a core component of nutritional evaluation in PD. Dual-energy X-ray absorptiometry (DXA) remains the reference standard for body composition analysis but is limited by cost, radiation exposure, and restricted availability.2 In routine nephrology practice, bioimpedance analysis (BIA) is widely used to estimate lean and fat compartments and assess hydration status; however, its accuracy may be compromised in the presence of severe fluid overload, altered hydration states, or extreme body compositions, conditions frequently encountered in PD patients.8 These limitations highlight the need for complementary, bedside-applicable tools capable of monitoring regional muscle and fat changes longitudinally.
Nutritional ultrasonography (US) has emerged as such a tool under the García-Almeida protocol, which standardizes measurement of quadriceps rectus femoris (QRF) and abdominal fat layers.9,10
However, data in PD populations remain limited, particularly regarding the longitudinal behavior of muscle and fat compartments and their relationship with functional performance, nutritional scores, and PEW severity.
The present study was designed to address this gap by evaluating the clinical utility of nutritional US for morphofunctional assessment and follow-up in patients undergoing PD. Specifically, we aimed to (i) characterize muscle and adipose tissue compartments using standardized nutritional ultrasound, (ii) analyze their associations with bioimpedance-derived indices, functional performance tests, and nutritional scores, (iii) identify gender differences and (iv) assess longitudinal changes over a six-month follow-up period. By integrating ultrasound with established nutritional and functional assessments, we sought to explore its role as a complementary tool for monitoring nutritional status and identifying patients at risk of sarcopenia and protein–energy wasting in routine PD care.
MethodsStudy design and populationThis was a single-centre, prospective observational study with a six month follow-up, conducted in a cohort of adult patients undergoing peritoneal dialysis (PD) between 2024 and 2025. Eligible participants were ≥18 years old and receiving maintenance PD at the time of enrolment. Patients with PD vintage<3 months at baseline were classified as incident PD patients, whereas those with PD vintage ≥3 months were considered prevalent PD patients. Sensitivity analyses were performed according to PD vintage. Exclusion criteria included: (i) hospitalization within the previous month, and (ii) PD prescribed for cardiorenal syndrome with an estimated glomerular filtration rate>20mL/min. A detailed patient flowchart and the completed STROBE checklist are provided as supplementary material (Supplementary Fig. 1, Supplementary Table 1).
Nutritional US assessmentNutritional US was performed following the standardized protocol described by García-Almeida et al.9 All examinations were carried out using a digital color Doppler ultrasound system (SonoScape, China) equipped with a 6–12MHz linear probe, operating in B-mode.
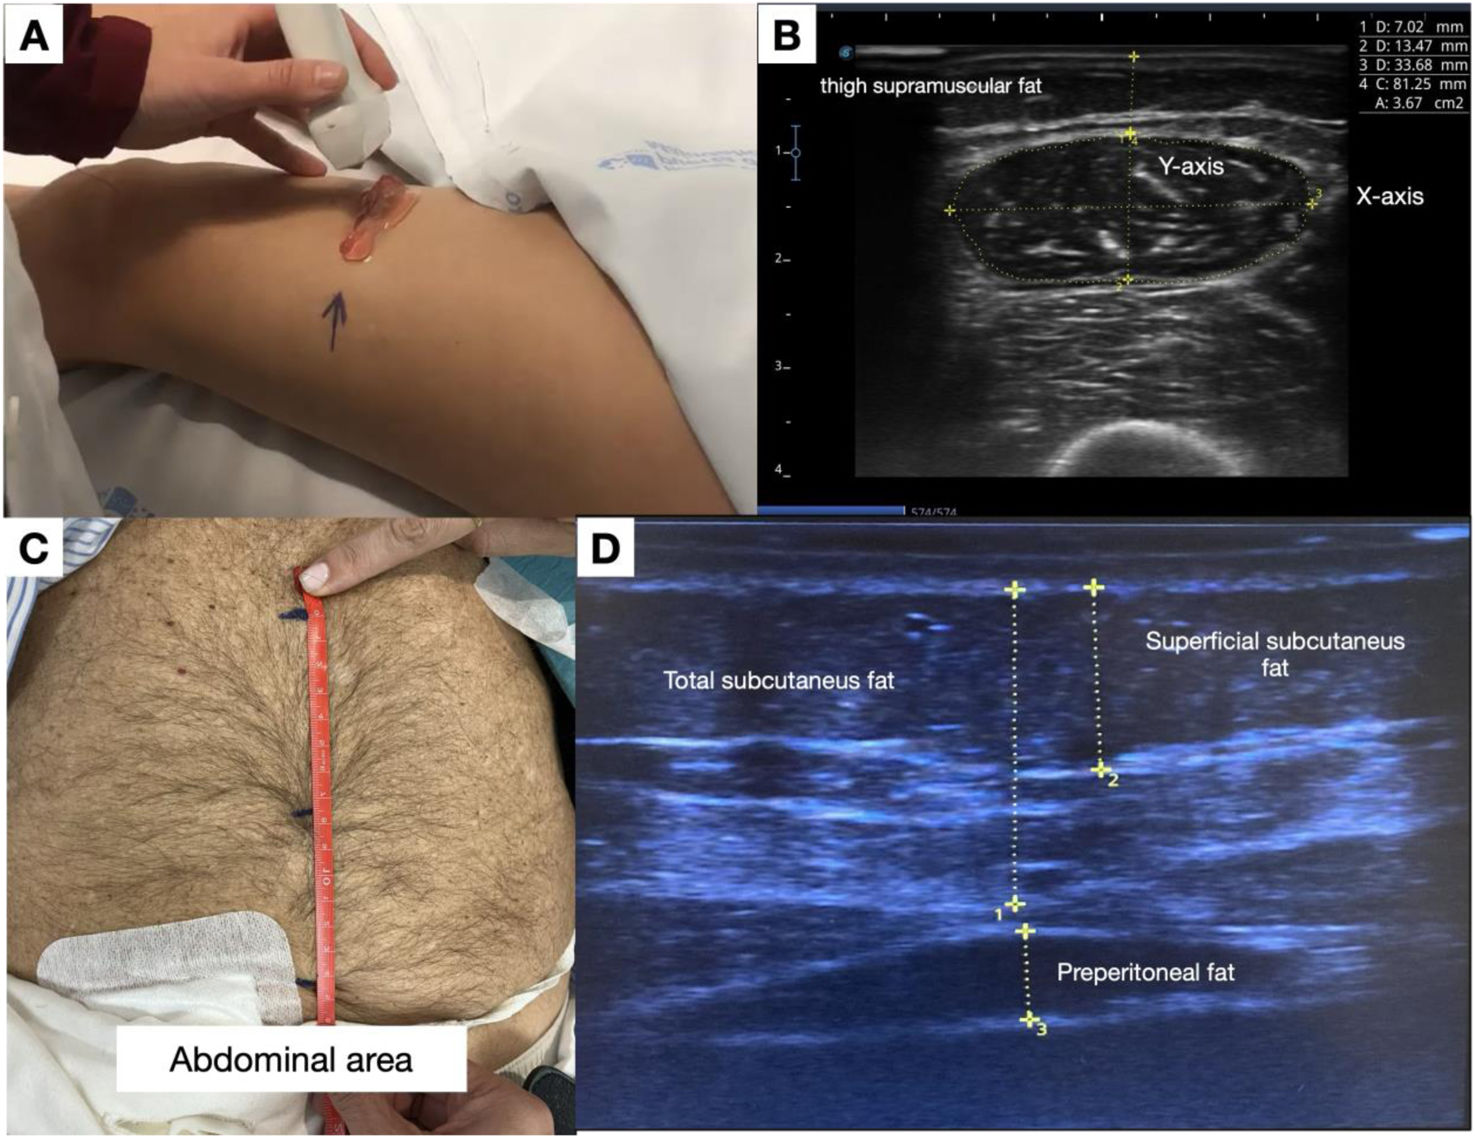
QRF measurements were obtained on the dominant leg, at the distal third of the line connecting the anterior superior iliac spine and the superior border of the patella, with the patient in the supine position and the muscle fully relaxed. The transducer was placed perpendicular to the muscle surface. The following parameters were recorded: Y-axis thickness (mm), X-axis width (mm), cross-sectional area (cm2), and thigh supramuscular fat thickness (mm) (Fig. 1). Three consecutive measurements were obtained and averaged. Muscle parameters were normalized to height squared (m2) and body surface area (BSA) using the Du Bois formula.11

(A) Anatomical location of the ultrasound measurement point at the distal third of the imaginary line connecting the anterior superior iliac spine and the superior border of the patella. (B) Ultrasound image of the quadriceps rectus femoris (QRF), showing the X- and Y-axes and the traced cross-sectional area. (C) Location of the measurement point, midway between the xiphoid process and the umbilicus. (D) Ultrasound image showing the different layers of abdominal fat.
Abdominal adipose tissue was assessed at the midpoint between the xiphoid process and the umbilicus during relaxed expiration, with the peritoneal cavity drained. Superficial subcutaneous, deep subcutaneous, and preperitoneal fat layers were measured according to the standardized technique (Fig. 1). All nutritional ultrasound examinations were performed by a single trained operator to ensure methodological consistency.
Nutritional, functional, and body composition assessmentBody composition was evaluated using multifrequency bioimpedance analysis (BCM®, Fresenius Medical Care, Germany) to obtain overhydration (OH), lean tissue index (LTI), fat tissue index (FTI), and phase angle at 50Hz.
Muscle strength was assessed using handgrip strength, measured with a handheld dynamometer (CAMRY EH101). Low muscle strength (dynapenia) was defined according to the EWGSOP2 criteria (handgrip<27kg in men and <16kg in women).12 Physical performance was evaluated using the Short Physical Performance Battery (SPPB).13
Nutritional status was assessed using the Malnutrition–Inflammation Score (MIS).14 Laboratory parameters included serum creatinine, phosphorus, dialysis adequacy (weekly Kt/V), and residual kidney function (RKF), normalized protein catabolic rate (nPCR), C-reactive protein (CRP), albumin, prealbumin, and lipid profile.
Protein–energy wasting definitionPEW was classified according to the simplified 2014 International Society of Renal Nutrition and Metabolism (ISRNM) score,15 using the following variables: serum albumin ≤3.8g/dL, body mass index (BMI) ≤23kg/m2, serum creatinine normalized by body surface area (sCr/BSA) ≤3.8mg/dL/m2, and protein intake ≤0.8g/kg/day. Protein intake was estimated using normalized protein catabolic rate (nPCR), which was used as a surrogate marker of dietary protein intake.16 Moderate PEW was defined by the presence of two criteria, and severe PEW by three or more criteria. Nutritional US, functional assessments, and biochemical measurements were performed on the same day to minimize variability.
Statistical analysisContinuous variables are presented as mean (standard deviation, SD) or median (interquartile range, IQR), according to their distribution. Categorical variables are expressed as frequencies and percentages. Between-group comparisons were performed using the Student's t-test or Mann–Whitney U test for continuous and independent variables or paired-Student's t/Wilcoxon test for paired samples, and χ2 test/McNemar test for categorical variables, as appropriate.
Associations between nutritional ultrasound parameters and body composition, functional, and nutritional markers were evaluated using Pearson correlation coefficients. The ability of ultrasound-derived parameters to discriminate PEW and dynapenia was assessed using receiver operating characteristic (ROC) curve analysis, with calculation of the area under the curve (AUC) and 95% confidence intervals (CI). Given the limited sample size, multivariable analyses were restricted to exploratory models adjusted for clinically relevant covariates (age, sex, BMI and PD vintage) to minimize overfitting. Additionally, given that missing data were likely not missing at random, with a probable higher proportion of patients lost to follow-up due to kidney transplantation, a complete-case analysis including only patients with at least 6 months of follow-up was performed. Separate multivariable linear regression models were constructed to assess the association between QRF Y-axis thickness and body composition variables (LTI and phase angle), with each model adjusted for these covariates.
Statistical significance was set at p<0.05. Analyses were performed using Stata version 16 (StataCorp LLC, College Station, TX, USA).
Ethical considerationsThe study was approved by the Ethics Committee (approval number PI 75/24). All procedures were conducted in accordance with the Declaration of Helsinki and Good Clinical Practice guidelines. Written informed consent was obtained from all participants prior to enrolment.
ResultsStudy population and baseline characteristicsA total of 59 patients undergoing PD were included in the baseline analysis. Mean age was 64.2±14.0 years, and 61.0% were male. The majority of patients were receiving automated peritoneal dialysis (69.5%), and 32% were using icodextrin. Median PD vintage was 0.9 months (IQR 0.4–15.5). At baseline, 37 patients (62.7%) were classified as incident PD patients (<3 months on PD), whereas 22 patients (37.3%) were classified as prevalent PD patients (≥3 months on PD).
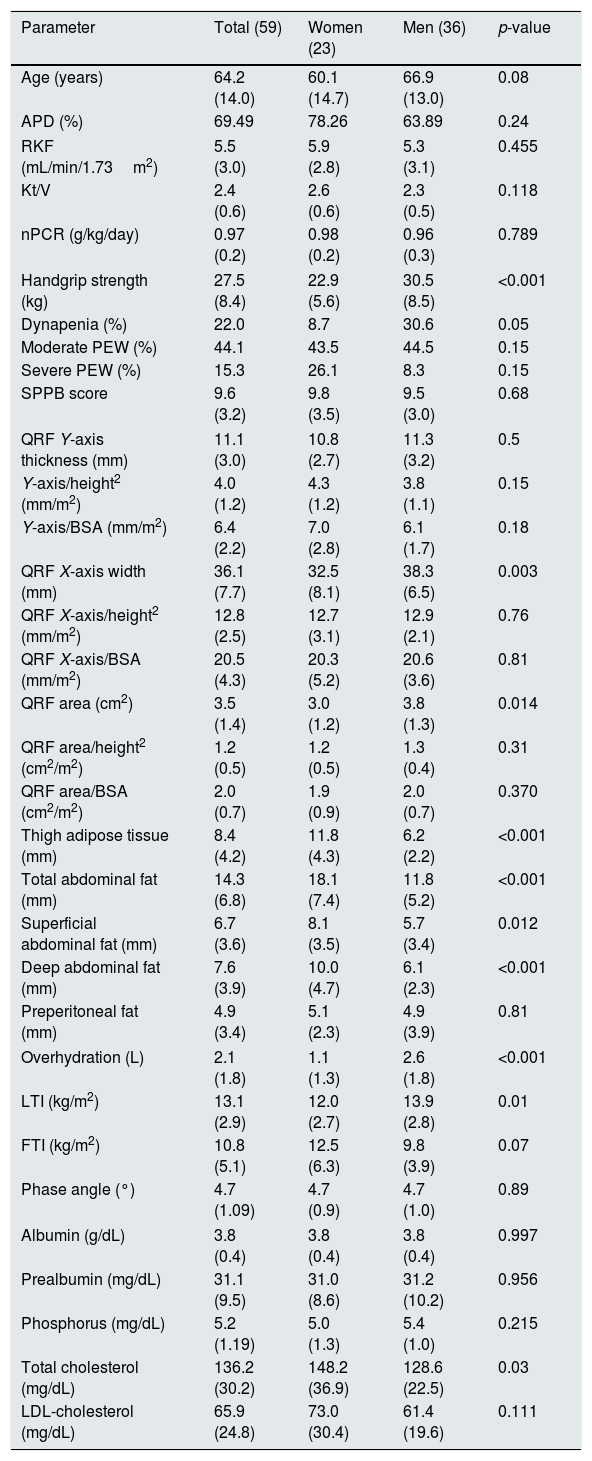
Comorbid conditions included hypertension (86.4%), diabetes mellitus (33.9%), and ischemic heart disease (20.3%). The most frequent causes of kidney failure were glomerular disease (32.7%) and diabetic kidney disease (18.0%). Mean weekly Kt/V was 2.4±0.6, residual kidney function was 5.5±3.0mL/min/1.73m2, and two thirds of patients achieved SPPB scores ≥10, indicating preserved physical performance. Baseline demographic, clinical, biochemical, and body composition characteristics are summarized in Table 1.
Baseline characteristics of the population and their measures stratified by gender.
| Parameter | Total (59) | Women (23) | Men (36) | p-value |
|---|---|---|---|---|
| Age (years) | 64.2 (14.0) | 60.1 (14.7) | 66.9 (13.0) | 0.08 |
| APD (%) | 69.49 | 78.26 | 63.89 | 0.24 |
| RKF (mL/min/1.73m2) | 5.5 (3.0) | 5.9 (2.8) | 5.3 (3.1) | 0.455 |
| Kt/V | 2.4 (0.6) | 2.6 (0.6) | 2.3 (0.5) | 0.118 |
| nPCR (g/kg/day) | 0.97 (0.2) | 0.98 (0.2) | 0.96 (0.3) | 0.789 |
| Handgrip strength (kg) | 27.5 (8.4) | 22.9 (5.6) | 30.5 (8.5) | <0.001 |
| Dynapenia (%) | 22.0 | 8.7 | 30.6 | 0.05 |
| Moderate PEW (%) | 44.1 | 43.5 | 44.5 | 0.15 |
| Severe PEW (%) | 15.3 | 26.1 | 8.3 | 0.15 |
| SPPB score | 9.6 (3.2) | 9.8 (3.5) | 9.5 (3.0) | 0.68 |
| QRF Y-axis thickness (mm) | 11.1 (3.0) | 10.8 (2.7) | 11.3 (3.2) | 0.5 |
| Y-axis/height2 (mm/m2) | 4.0 (1.2) | 4.3 (1.2) | 3.8 (1.1) | 0.15 |
| Y-axis/BSA (mm/m2) | 6.4 (2.2) | 7.0 (2.8) | 6.1 (1.7) | 0.18 |
| QRF X-axis width (mm) | 36.1 (7.7) | 32.5 (8.1) | 38.3 (6.5) | 0.003 |
| QRF X-axis/height2 (mm/m2) | 12.8 (2.5) | 12.7 (3.1) | 12.9 (2.1) | 0.76 |
| QRF X-axis/BSA (mm/m2) | 20.5 (4.3) | 20.3 (5.2) | 20.6 (3.6) | 0.81 |
| QRF area (cm2) | 3.5 (1.4) | 3.0 (1.2) | 3.8 (1.3) | 0.014 |
| QRF area/height2 (cm2/m2) | 1.2 (0.5) | 1.2 (0.5) | 1.3 (0.4) | 0.31 |
| QRF area/BSA (cm2/m2) | 2.0 (0.7) | 1.9 (0.9) | 2.0 (0.7) | 0.370 |
| Thigh adipose tissue (mm) | 8.4 (4.2) | 11.8 (4.3) | 6.2 (2.2) | <0.001 |
| Total abdominal fat (mm) | 14.3 (6.8) | 18.1 (7.4) | 11.8 (5.2) | <0.001 |
| Superficial abdominal fat (mm) | 6.7 (3.6) | 8.1 (3.5) | 5.7 (3.4) | 0.012 |
| Deep abdominal fat (mm) | 7.6 (3.9) | 10.0 (4.7) | 6.1 (2.3) | <0.001 |
| Preperitoneal fat (mm) | 4.9 (3.4) | 5.1 (2.3) | 4.9 (3.9) | 0.81 |
| Overhydration (L) | 2.1 (1.8) | 1.1 (1.3) | 2.6 (1.8) | <0.001 |
| LTI (kg/m2) | 13.1 (2.9) | 12.0 (2.7) | 13.9 (2.8) | 0.01 |
| FTI (kg/m2) | 10.8 (5.1) | 12.5 (6.3) | 9.8 (3.9) | 0.07 |
| Phase angle (°) | 4.7 (1.09) | 4.7 (0.9) | 4.7 (1.0) | 0.89 |
| Albumin (g/dL) | 3.8 (0.4) | 3.8 (0.4) | 3.8 (0.4) | 0.997 |
| Prealbumin (mg/dL) | 31.1 (9.5) | 31.0 (8.6) | 31.2 (10.2) | 0.956 |
| Phosphorus (mg/dL) | 5.2 (1.19) | 5.0 (1.3) | 5.4 (1.0) | 0.215 |
| Total cholesterol (mg/dL) | 136.2 (30.2) | 148.2 (36.9) | 128.6 (22.5) | 0.03 |
| LDL-cholesterol (mg/dL) | 65.9 (24.8) | 73.0 (30.4) | 61.4 (19.6) | 0.111 |
Results are expressed as mean (SD) or percentage. APD: automated peritoneal dialysis; BSA: body surface area; RKF: residual kidney function; nPCR: normalized protein catabolic rate; PEW: protein-energy wasting; QRF: Quadriceps rectus femoris; SPPB: Short Physical Performance Battery; X-axis/Y-axis: rectus femoris diameters; LTI: lean tissue index; FTI: fat tissue index.
Mean QRF Y-axis thickness was 11.1±3.0mm, and mean cross-sectional area was 3.5±1.4cm2. Women exhibited significantly greater thigh and abdominal adipose tissue thickness than men, except for preperitoneal fat, whereas men showed higher QRF cross-sectional area and X-axis width.
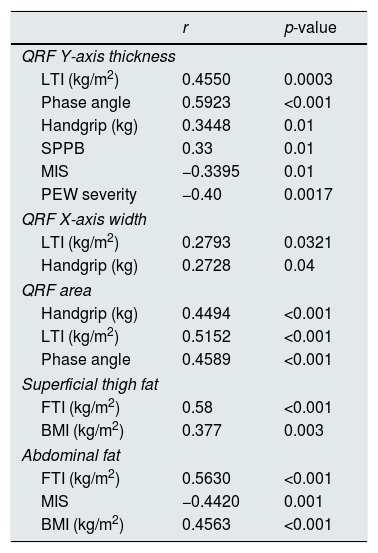
QRF Y-axis thickness showed moderate positive correlations with lean tissue index (LTI), phase angle, handgrip strength, and SPPB score, and inverse correlations with the Malnutrition–Inflammation Score (MIS) and PEW severity. QRF X-axis width and cross-sectional area were also positively associated with handgrip strength and LTI. In contrast, superficial thigh fat and abdominal fat compartments correlated positively with fat tissue index (FTI) and body mass index, while abdominal fat thickness showed an inverse association with MIS (Table 2). In exploratory adjusted analyses, QRF Y-axis thickness remained associated with LTI after adjustment for age, sex and BMI (β=0.38; 95% CI 0.14–0.62; p=0.002). Similarly, QRF Y-axis thickness remained associated with phase angle after adjustment for the same covariates (β=1.40; 95% CI 0.65–2.16; p<0.001).
Correlation among nutritional ultrasound, parameters with, body composition, dynapenia and PEW severity.
| r | p-value | |
|---|---|---|
| QRF Y-axis thickness | ||
| LTI (kg/m2) | 0.4550 | 0.0003 |
| Phase angle | 0.5923 | <0.001 |
| Handgrip (kg) | 0.3448 | 0.01 |
| SPPB | 0.33 | 0.01 |
| MIS | −0.3395 | 0.01 |
| PEW severity | −0.40 | 0.0017 |
| QRF X-axis width | ||
| LTI (kg/m2) | 0.2793 | 0.0321 |
| Handgrip (kg) | 0.2728 | 0.04 |
| QRF area | ||
| Handgrip (kg) | 0.4494 | <0.001 |
| LTI (kg/m2) | 0.5152 | <0.001 |
| Phase angle | 0.4589 | <0.001 |
| Superficial thigh fat | ||
| FTI (kg/m2) | 0.58 | <0.001 |
| BMI (kg/m2) | 0.377 | 0.003 |
| Abdominal fat | ||
| FTI (kg/m2) | 0.5630 | <0.001 |
| MIS | −0.4420 | 0.001 |
| BMI (kg/m2) | 0.4563 | <0.001 |
Data are presented as correlation coefficients (r) and corresponding p-values between nutritional ultrasound (NUS) parameters and body composition indices, bioimpedance-derived phase angle, functional measures, nutritional score, and PEW severity. Positive r values indicate a direct association and negative values an inverse association. NUS: nutritional ultrasound; QRF: quadriceps rectus femoris; LTI: lean tissue index; FTI: fat tissue index; BMI: body mass index; SPPB: Short Physical Performance Battery; MIS: Malnutrition–Inflammation Score; PEW: protein–energy wasting.
At baseline, 44.1% of patients met criteria for moderate PEW and 15.3% for severe PEW. Low handgrip strength (dynapenia) was present in 22.0% of the cohort and was more frequent among men.
Patients with severe PEW had lower muscle thickness (Y-axis: 7.93mm, SD 1.82) compared with those with moderate PEW (11.51mm, SD 3.30) and those without PEW (11.95mm, SD 2.31); after adjustment for age and sex using analysis of covariance (ANCOVA), significant differences in QRF Y-axis thickness across PEW categories remained significant (p=0.009).
They also showed a trend toward lower handgrip strength: severe PEW, 22 (SD 6.06) vs moderate PEW, 27.62 (SD 9.01) vs no PEW, 29.54 (SD 7.67), p=0.067. In addition, the severe PEW group had lower functional capacity as measured by the SPPB: severe PEW 7.1 (SD 5.0) moderate PEW 10.0 (SD 2.7) and no PEW 10.12 (SD 2.4) p=0.03 and a trend toward a lower phase angle: severe PEW, 3.96 (SD 0.8) vs moderate PEW, 4.72 (SD 0.9) vs no PEW, 4.87 (SD 1.0), p=0.05. However, we did not observe differences in LTI.
ROC analysis demonstrated that QRF Y-axis thickness discriminated PEW with an area under the curve (AUC) of 0.68 (95% CI 0.54–0.81; p=0.012). Reduced preperitoneal fat thickness also showed discriminatory capacity for PEW (AUC approximately 0.66, 95% CI 0.51–0.80; p=0.03). In addition, QRF Y-axis thickness identified dynapenia with an AUC of 0.72 (95%CI 0.58–0.86; p=0.002). More results in Supplementary Table 2.
Gender based analysisWomen were younger than men but did not differ significantly in comorbidity burden, PD prescription, dialysis adequacy, or residual kidney function. They exhibited a lower prevalence of dynapenia and a lower degree of overhydration.
Nutritional US showed that women had smaller QRF dimensions, particularly X-axis width and cross-sectional area, diminishing when normalized by height squared and BSA. In contrast, women demonstrated greater thigh supramuscular fat and increased abdominal adipose tissue across superficial and deep layers, except preperitoneal fat. These findings were consistent with bioimpedance results, where women showed higher fat tissue index (FTI) and lower lean tissue index (LTI) (Table 1).
Six-month follow-upOf the 59 patients enrolled at baseline, 45 completed the six-month follow-up. Attrition was mainly due to kidney transplantation (n=10), transfer to in-centre haemodialysis (n=3), or transition to home haemodialysis (n=1). Among the patients who did not complete follow-up compared with completers, non-completers had higher baseline QRF Y-axis thickness, LTI and phase angle (p<0.05), suggesting a better baseline morphofunctional profile. Baseline age, BMI, albumin, residual kidney function, diabetes, PEW category, PD vintage and PD modality were broadly similar between groups. Baseline characteristics according to completion of follow-up are shown in Supplementary Table 3.
Over six months, handgrip strength, SPPB score, MIS, LTI, and phase angle remained stable at the group level. No significant changes in overall PEW prevalence were observed.
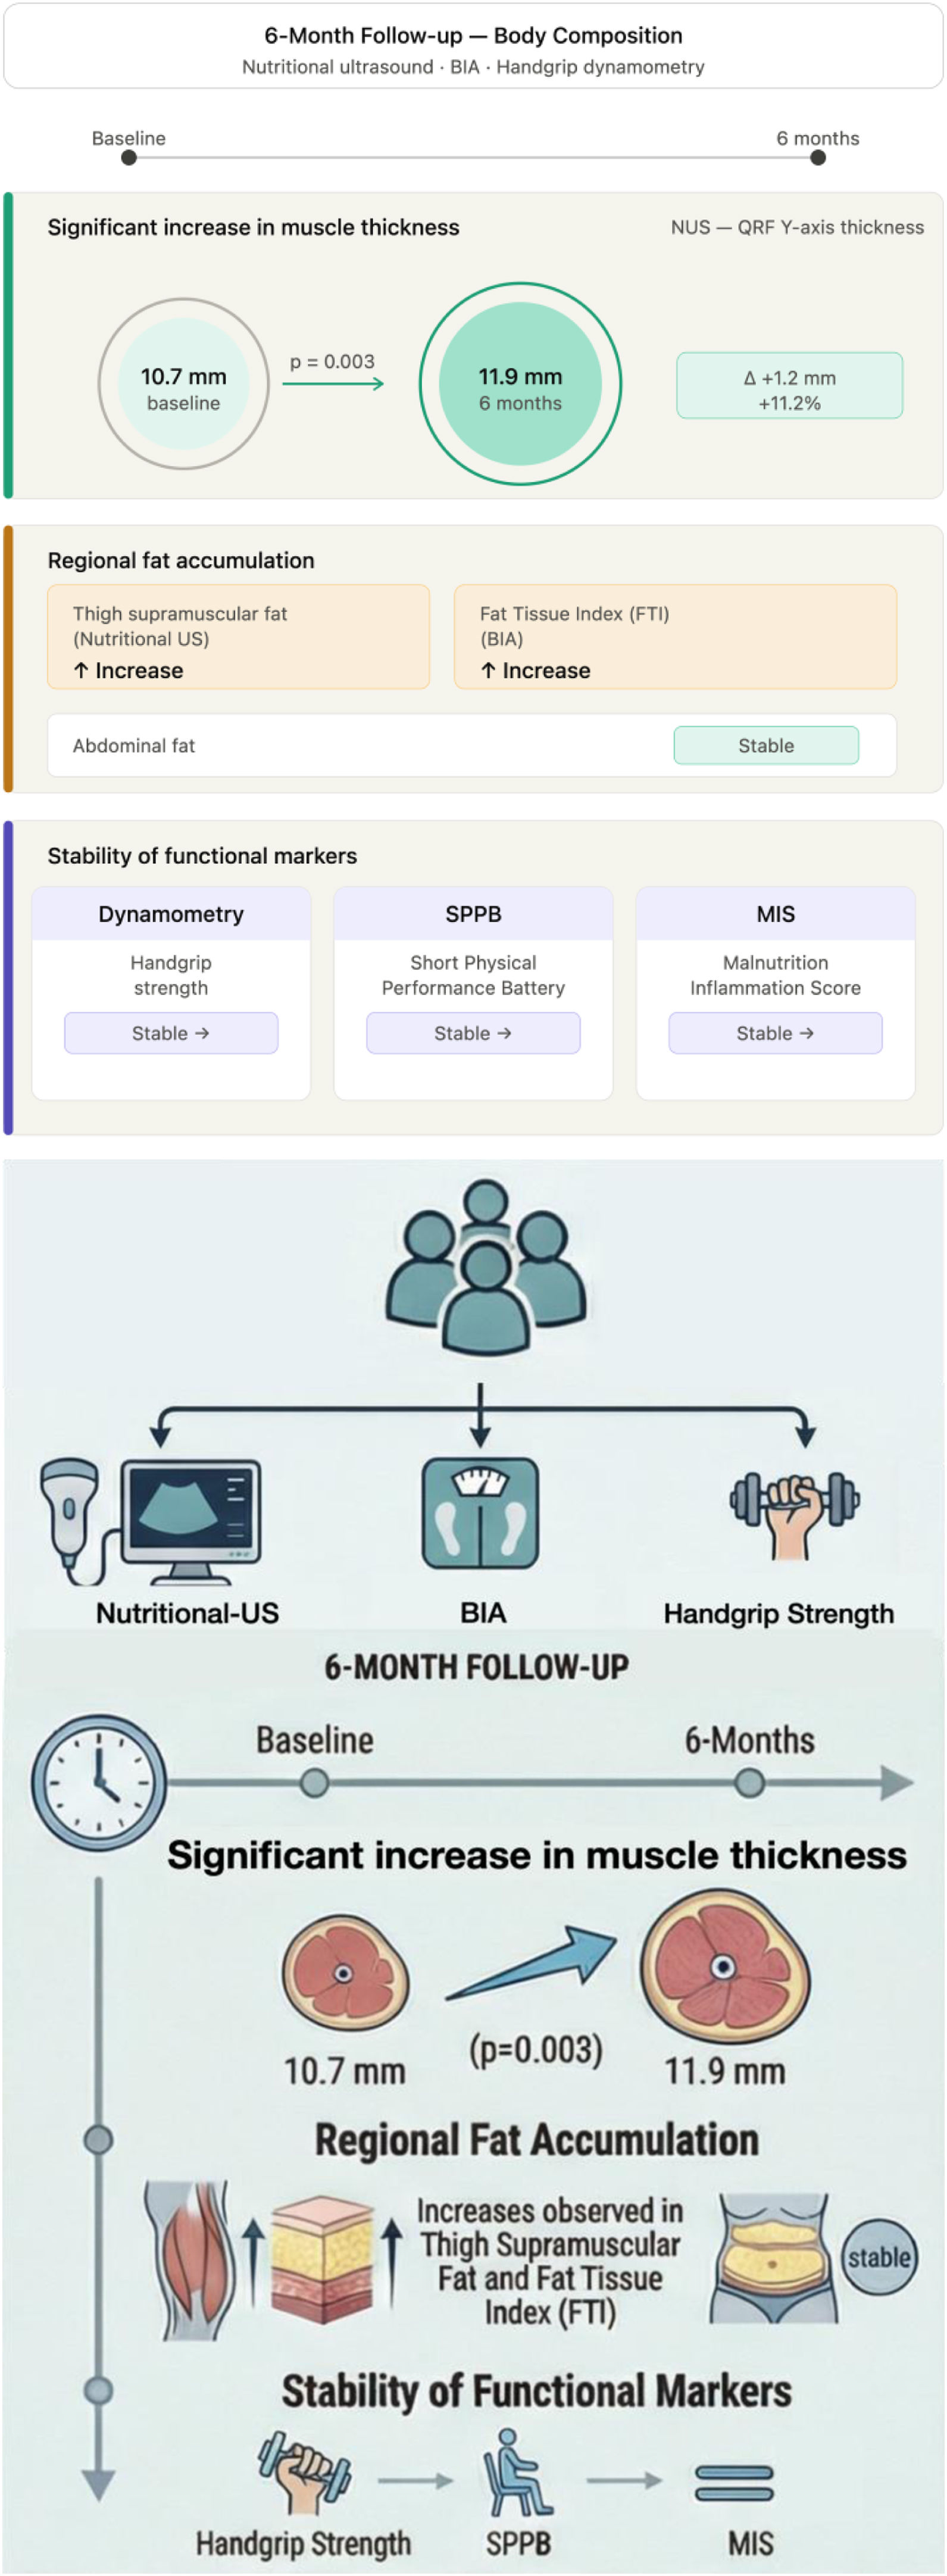
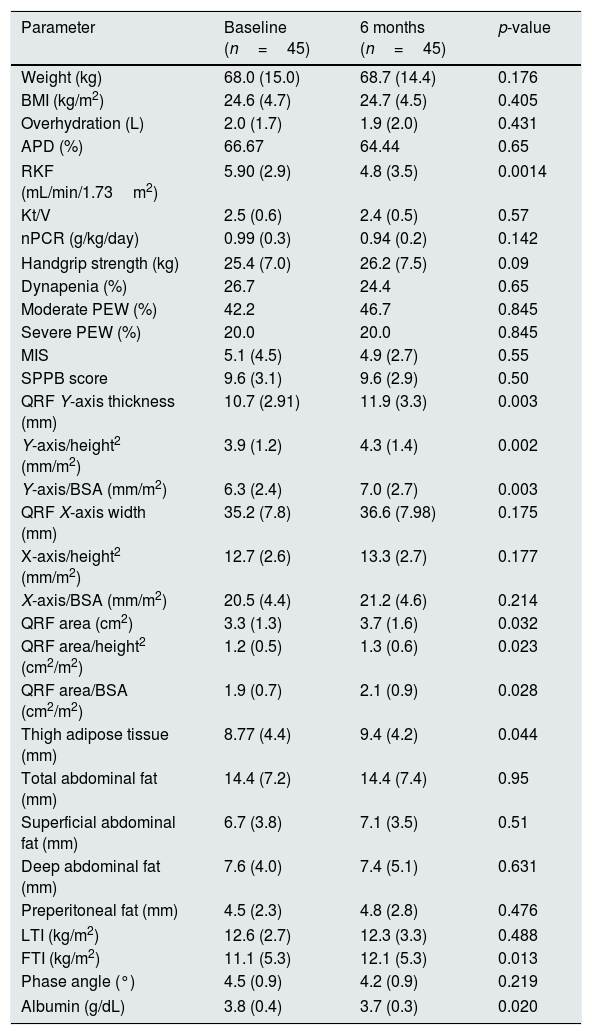
In contrast, nutritional US detected a significant increase in QRF Y-axis thickness (10.7±2.9mm to 11.9±3.3mm; p=0.003) (Fig. 2) and QRF cross-sectional area (p=0.032), even when adjusted by height squared or BSA, while X-axis width remained unchanged. The change in QRF Y-axis thickness and cross-sectional area did not differ between incident and prevalent PD patients. Incident patients showed a mean increase in QRF Y-axis thickness of 1.09mm, while prevalent patients showed a comparable change, with no significant between-group difference (Difference=−0.12mm; 95% CI −1.57 to 1.34; p=0.874). Despite adjusting for age, sex, and BMI, no significant differences were observed. FTI and thigh supramuscular fat thickness increased during follow-up, whereas abdominal fat compartments remained stable. The change in thigh supramuscular fat differed between incident and prevalent PD patients. Incident patients showed a greater increase in thigh supramuscular fat than prevalent patients (median change +1.28mm [IQR 0.25 to 2.00] vs −0.11mm [IQR −1.44 to 0.87], respectively; p=0.05). No significant differences were observed between incident and prevalent PD patients in the 6-month changes in total abdominal fat. Laboratory parameters showed no clinically relevant changes, except for a small decrease in serum albumin (Table 3).

Longitudinal changes over 6 months assessed by nutritional ultrasound, bioimpedance analysis, and functional markers. Nutritional ultrasound showed a significant increase in muscle thickness and greater fat accumulation, including thigh supramuscular fat, whereas abdominal fat remained unchanged. Functional markers remained stable. Abbreviations: NUS, nutritional ultrasound; QRF, quadriceps rectus femoris.
Analytical, functional, and ultrasound parameters of patients who completed both evaluations (baseline and 6 months).
| Parameter | Baseline (n=45) | 6 months (n=45) | p-value |
|---|---|---|---|
| Weight (kg) | 68.0 (15.0) | 68.7 (14.4) | 0.176 |
| BMI (kg/m2) | 24.6 (4.7) | 24.7 (4.5) | 0.405 |
| Overhydration (L) | 2.0 (1.7) | 1.9 (2.0) | 0.431 |
| APD (%) | 66.67 | 64.44 | 0.65 |
| RKF (mL/min/1.73m2) | 5.90 (2.9) | 4.8 (3.5) | 0.0014 |
| Kt/V | 2.5 (0.6) | 2.4 (0.5) | 0.57 |
| nPCR (g/kg/day) | 0.99 (0.3) | 0.94 (0.2) | 0.142 |
| Handgrip strength (kg) | 25.4 (7.0) | 26.2 (7.5) | 0.09 |
| Dynapenia (%) | 26.7 | 24.4 | 0.65 |
| Moderate PEW (%) | 42.2 | 46.7 | 0.845 |
| Severe PEW (%) | 20.0 | 20.0 | 0.845 |
| MIS | 5.1 (4.5) | 4.9 (2.7) | 0.55 |
| SPPB score | 9.6 (3.1) | 9.6 (2.9) | 0.50 |
| QRF Y-axis thickness (mm) | 10.7 (2.91) | 11.9 (3.3) | 0.003 |
| Y-axis/height2 (mm/m2) | 3.9 (1.2) | 4.3 (1.4) | 0.002 |
| Y-axis/BSA (mm/m2) | 6.3 (2.4) | 7.0 (2.7) | 0.003 |
| QRF X-axis width (mm) | 35.2 (7.8) | 36.6 (7.98) | 0.175 |
| X-axis/height2 (mm/m2) | 12.7 (2.6) | 13.3 (2.7) | 0.177 |
| X-axis/BSA (mm/m2) | 20.5 (4.4) | 21.2 (4.6) | 0.214 |
| QRF area (cm2) | 3.3 (1.3) | 3.7 (1.6) | 0.032 |
| QRF area/height2 (cm2/m2) | 1.2 (0.5) | 1.3 (0.6) | 0.023 |
| QRF area/BSA (cm2/m2) | 1.9 (0.7) | 2.1 (0.9) | 0.028 |
| Thigh adipose tissue (mm) | 8.77 (4.4) | 9.4 (4.2) | 0.044 |
| Total abdominal fat (mm) | 14.4 (7.2) | 14.4 (7.4) | 0.95 |
| Superficial abdominal fat (mm) | 6.7 (3.8) | 7.1 (3.5) | 0.51 |
| Deep abdominal fat (mm) | 7.6 (4.0) | 7.4 (5.1) | 0.631 |
| Preperitoneal fat (mm) | 4.5 (2.3) | 4.8 (2.8) | 0.476 |
| LTI (kg/m2) | 12.6 (2.7) | 12.3 (3.3) | 0.488 |
| FTI (kg/m2) | 11.1 (5.3) | 12.1 (5.3) | 0.013 |
| Phase angle (°) | 4.5 (0.9) | 4.2 (0.9) | 0.219 |
| Albumin (g/dL) | 3.8 (0.4) | 3.7 (0.3) | 0.020 |
Results are expressed as mean (SD) or percentage. BMI: body mass index; APD: automated peritoneal dialysis; BSA: body surface area; RKF: residual kidney function; nPCR: normalized protein catabolic rate; MIS: Malnutrition-Inflammation Score; PEW: protein-energy wasting; QRF: Quadriceps rectus femoris; SPPB: Short Physical Performance Battery; X-axis/Y-axis: rectus femoris diameters; LTI: lean tissue index; FTI: fat tissue index.
Sarcopenia and PEW are frequent and clinically relevant conditions in patients undergoing PD, with important implications for functional status, technique survival, and quality of life.1,2 In this prospective study, nutritional ultrasound emerged as a practical and complementary point-of-care tool for morphofunctional assessment in PD, showing robust associations with established nutritional, body composition, and functional markers, and demonstrating sensitivity to longitudinal changes over a six-month follow-up period.
At baseline, ultrasound-derived quadriceps measurements correlated consistently with bioimpedance-derived lean tissue index, phase angle, handgrip strength, and physical performance assessed by the SPPB. These findings support the construct validity of nutritional ultrasound as a marker of muscle quantity and functional capacity in PD, in line with previous studies in dialysis and non-dialysis CKD populations.17–21 Importantly, quadriceps thickness and area showed inverse associations with the MIS and PEW severity, reinforcing their potential role in identifying patients at nutritional risk beyond conventional biochemical markers.
The prevalence of PEW observed in our cohort was substantial, with moderate and severe PEW affecting more than half of the study population. This is consistent with prior reports describing a high burden of PEW across dialysis cohorts.22 Notably, patients with severe PEW exhibited significantly reduced quadriceps thickness, whereas lean tissue index did not differ across PEW categories. This discrepancy may reflect the limitations of whole-body estimates of lean mass derived from bioimpedance, particularly in PD patients with variable hydration status,8,23 and highlights the value of regional muscle assessment using ultrasound. The use of an nPCR threshold ≤0.8g/kg/day as a surrogate marker of low protein intake may have led to misclassification in PD patients. Although this cut-off is consistent with ISRNM-based PEW criteria for low spontaneous protein intake,16 it may underestimate nutritional risk in PD patients whose recommended protein requirements are generally higher due to peritoneal protein losses.
ROC analyses showed that quadriceps thickness and reduced preperitoneal fat demonstrated moderate discriminatory capacity for PEW and dynapenia. While these findings do not support the definition of diagnostic cut-offs, they suggest that nutritional ultrasound may contribute to early risk stratification when integrated with established nutritional and functional assessments. Ultrasound uniquely allows separate evaluation of superficial, deep, and preperitoneal abdominal fat compartments,9,10 providing additional insight into adipose tissue distribution that is not captured by bioimpedance or anthropometric measures. In this context, the association between reduced preperitoneal fat and greater PEW severity may reflect progressive depletion of energy reserves in more advanced nutritional impairment.10,21
Gender-based differences in body composition were evident in our cohort. Women exhibited lower muscle dimensions and greater adipose tissue thickness in most compartments despite similar dialysis adequacy and comorbidity burden. These findings were concordant across ultrasound and bioimpedance assessments and are consistent with prior observations in dialysis populations.24 Although sex-specific differences were not the primary focus of the study, these results highlight the potential need for sex-adjusted reference values when applying ultrasound-derived measurements in PD. Given the distinct metabolic profile and body composition changes observed in PD patients compared with in-centre haemodialysis populations,3,23 this issue warrants further investigation in larger multicentre studies.
Longitudinally, nutritional ultrasound detected a significant increase in quadriceps thickness and cross-sectional area over six months, whereas functional performance, lean tissue index, and nutritional scores remained stable at the population level. These findings should be interpreted cautiously. The observed increase in muscle thickness may reflect preservation or early changes in muscle tissue that are not yet translated into measurable functional improvement, rather than a true gain in muscle strength or performance. Muscle size and muscle strength are not linearly related, as strength also depends on muscle quality, neuromuscular activation, intramuscular fat infiltration, inflammation, comorbidity burden and physical activity.25,26 Importantly, fat accumulation during follow-up was confined to the supramuscular thigh compartment, while abdominal adipose layers remained unchanged. This pattern differs from previous reports of generalized fat gain in PD patients over longer observation periods,27–29 and underscores the value of regional assessment when monitoring body composition dynamics.
From a clinical perspective, these findings suggest that nutritional ultrasound may be a feasible bedside tool for monitoring muscle and adipose tissue changes in PD patients. Its advantages include absence of radiation, low cost, ease of repetition, and the ability to evaluate specific muscle and fat compartments that may be clinically informative. Rather than replacing established techniques such as bioimpedance or functional testing, nutritional ultrasound should be considered complementary, particularly for longitudinal follow-up and early detection of morphological changes that may precede overt functional decline.
Attrition during follow-up may have introduced selection bias. Most losses were due to kidney transplantation, which is a common reason for discontinuation of peritoneal dialysis follow-up and usually occurs in clinically fitter patients. Consistently, non-completers had higher baseline QRF Y-axis thickness, LTI and phase angle, suggesting a better baseline morphofunctional profile. Therefore, longitudinal findings should be interpreted cautiously, as patients completing follow-up may not fully represent the entire baseline cohort.
Several limitations should be acknowledged. The single-centre design and modest sample size limit generalizability, and the use of a single trained operator, although ensuring methodological consistency, precludes assessment of inter-observer variability. Intraclass correlation coefficients or coefficients of variation were not available. In addition, validated PD-specific reference ranges and prognostic thresholds for ultrasound-derived parameters are lacking. Abdominal ultrasound assessment was technically challenging in patients with marked anatomical distortion, such as those with polycystic kidney disease. Finally, the six-month follow-up period may be insufficient to capture longer-term changes in functional performance and clinical outcomes.
ConclusionsNutritional US is a practical and accessible tool for morphofunctional assessment in PD. In this prospective study, US-derived measurements of quadriceps muscle and regional adipose tissue showed consistent associations with established nutritional, body composition, and functional markers, supporting their potential clinical relevance in routine PD care.
Beyond cross-sectional evaluation, nutritional US detected six-month changes in muscle thickness and thigh adiposity that were not captured by bioimpedance or functional testing alone, highlighting its value for longitudinal monitoring. Sex-related differences in muscle and fat distribution were observed, suggesting the need for sex-specific reference values to enhance interpretability.
Overall, nutritional ultrasound complements existing assessment methods and may facilitate individualized nutritional follow-up in PD care. Larger multicentre studies with longer follow-up, including intra- and inter-observer reproducibility analyses, are required to define reference ranges and determine the prognostic implications of ultrasound-guided evaluation.
Authors’ contributionsConceptualization: E.G.M. and J.P.; methodology: P.L.S., J.P., E.G.M.; data collection: all authors; writing—original draft preparation: E.G.M. and J.P.; writing—review and editing: all authors; supervision: E.G.M. and J.P.; funding acquisition, J.P. and E.G.M. All authors have read and agreed to the published version of the manuscript.
FundingThis study was supported by the Instituto de Salud Carlos III (ISCIII) through public research grants PI25/01000 and by the RICORS programsRD24/0004 and RD21/0005, supported by Instituto de Salud Carlos III, Spanish Recovery, Transformation and Resilience Plan, funded by the European Union – NextGeneration EU. Additional support was provided through unrestricted grants from the Spanish Renal Foundation (formerly FRIAT) and SCL Vifor via the Fundación Madrileña de Nefrología.
Conflict of interestE.G.M, P.L.S. and J.P. received unrestricted grant for research support from SCL-Vifor and Nipro and travel grant from Palex.
Data availability statementData will be provided upon request to the corresponding author.
The authors gratefully acknowledge the support of the Madrid Nephrology Foundation and the FRAIL-DP and GCDP collaborative group in the preparation of this article. We thank patient P.A. for his collaboration in providing the photos for the article. This study was approved by the Ethics Committee of Hospital Universitario Puerta de Hierro Majadahonda (approval number PI 75/24). All procedures were conducted in accordance with the Declaration of Helsinki and Good Clinical Practice guidelines.
FRAIL-DP Group: J Fernandez Cusicanqui, MR Llopez Carratalá, Lucía Martin Testillano, MA Bajo, B Cancho, A Cirugeda, J Delgado Dominguez, L Espinel, M González de Rivera, J Mancha Ramos, M Ossorio, V Oviedo, G del Peso, K Rivero, M Rivera Gorrín, F Tornero, AM Tato Ribera, AL Valencia Peláez, A Vega, C Yuste.
The followings are the supplementary data to this article:


recomendados