Aim: To compare the dynamics in vivo and in vitro calcium-PTH release of uremic patients with secondary hyperparathyroidism and their hyperplasic parathyroid glands after parathyroidectomy. Materials and methods: Seven patients with secondary HPT and their 23 hyperplasic glands obtained after surgical parathyroidectomy were evaluated. In vivo studies of the PTH secretion curve were obtained by induction of hypocalcemia and hypercalcemia with a continuous endovenous infusion of sodium EDTA and Ca gluconate, respectively. For the in vitro studies, small parathyroid pieces of 1 mm were sequentially transferred to wells with varying Ca concentrations: 0.4, 0.6, 0.8, 1, 1.25 and 1.5 mM. iPTH concentrations were determined in the medium. Results: The in vivo set point did not correlate with the basal, maximal or minimal PTH concentrations, although it correlated significantly with the basal serum Ca concentration (r = 0.62, p <0.02). Both in vivo and in vitro PTH secretion curves were sigmoidal, although the in vivo set point was higher than the in vitro (1.57 ± 0.05 vs. 1.27 ± 0.07 mM, p <0.001). The degree of maximal PTH inhibition were similar in both circumstances (30.5 ± 8.1 vs. 33.6 ± 5.4 %; p = NS) with a significant direct correlation (r = 0.901; p <0.01). Conclusions: The in vivo set point of calcium is more closely related to serum calcium concentration than to basal iPTH concentration. Although there are differences between the in vivo and in vitro calcium set point the maximal degree of PTH inhibition was similar in both circumstances.
Objetivo: Comparar la dinámica de la secreción de calcio-PTH in vivo e in vitro de glándulas paratiroideas hiperplásicas. Materiales y métodos: Se estudiaron 7 pacientes con hiperparatiroidismo secundario y las 23 glándulas hiperplásicas obtenidas tras paratiroidectomía de estos mismos pacientes. Estudios in vivo de la curva de secreción de PTH se obtuvieron con inducción de hipocalcemia e hipercalcemia con infusiones intravenosas continuas de EDTA sódico y gluconato de calcio, respectivamente. Para los estudios in vitro se emplearon pequeñas piezas de paratiroides de 1 mm que se transfirieron secuencialmente a concentraciones de calcio variables: 0,4, 0,6, 0,8, 1, 1,25 y 1,50 mM, determinándose la concentración de PTHi en el medio. Resultados: Las curvas de secreción de PTH in vivo e in vitro fueron sigmoidales y similares, aunque el set point in vivo era más alto que el in vitro (1,57 ± 0,05 frente a 1,27 ± 0,07 mM; p <0,001). El grado de inhibición máxima de PTH fue similar en ambas circunstancias (30,5 ± 8,1 frente a 33,6 ± 5,4%; p = NS), con una correlación directa significativa (r = 0,901; p <0,01). El set point in vivo no se correlacionaba con las concentraciones de PTH basales, aunque se correlacionó significativamente con las concentraciones basales de calcio sérico (r = 0,62; p <0,02). Conclusiones: El set point in vivo del calcio está más relacionado con la concentración sérica de calcio que con la concentración basal de PTHi. Aunque hay diferencias entre el set point de calcio in vivo e in vitro, el grado máximo de inhibición de PTH y la curva sigmoidal fueron similares en las dos circunstancias.
INTRODUCTION
Parathyroid hormone (PTH) secretion is regulated, among others, by extracellular ionised calcium which interacts through the calcium-sensing receptor of the parathyroid cell.1,2 The dynamics of PTH secretion in response to changes in serum calcium concentrations is known to be abnormal in hyperplastic parathyroid glands3 and these show a reduction in the number of calcium receptors.4-7 Physiologically, the relation between PTH secretion and extracellular calcium concentration is defined by a sigmoid curve. Thus, the reduction in calcium concentration produces an increase in PTH secretion until it reaches a maximum; an increase in calcium concentration, in contrast, reduces PTH secretion to a minimum. The set point of PTH secretion is often defined as the concentration of extracellular calcium required to reduce maximum PTH secretion by 50%,3,8 although this has also been defined as the serum calcium concentration required to reduce PTH secretion to half the difference between the maximum and the minimum.9,10 Whatever the case, the set point of PTH secretion defines the sensitivity of the parathyroid glands to extracellular calcium concentration.11
There has been little evaluation of the comparison of in vivo against in vitro calcium-regulated PTH response in uraemic patients with secondary hyperthyroidism.
The aim of this study is to compare the dynamics of calcium-regulated PTH secretion in a group of uraemic patients with secondary hyperparathyroidism to their hyperplastic parathyroid glands after parathyroidectomy.
MATERIAL AND METHODS
7 uraemic patients with secondary hyperparathyroidism were included (5 men and 2 women) with a mean age of 45 ± 15 years. Mean baseline serum values were: iPTH 1,151 ± 375pg/ml, serum Ca 10.8 ± 0.7mg/dl, P 5.34 ± 1.38mg/dl. At the time of the study, no patient was receiving vitamin D or vitamin D analogues.
After parathyroidectomy, 23 hyperplastic parathyroid glands were obtained.
Immediately after resection, the parathyroid glands were separated into various aliquots and incubated at 4° C in RPMI with calcium concentrations of 1.5mM for16-18 hours until the in vitro study was performed. From the various aliquots incubated from each gland, one was used to evaluate PTH secretion in vitro.
Evaluation of calcium-regulated PTH secretion in vitro
Incubation medium
The aliquot of parathyroid tissue was cut into pieces of approximately 1mm3 which were separated into individual nylon microtubes, each one with an incubation medium of 2ml at 37° C (AOS-0, SBS Instruments S.A., Badalona, Spain). The incubation medium was a buffer solution (pH = 7.4) containing (in mM): NaCl 125, KCl 5.9, MgCl2 0.5, NaH2PO4 and Na2HPO4 (1:2) 1, Na-pyruvate 1, glutamine 4, glucose 12, Hepes 25 with rapid insulin 0.1U/ml, bovine serum albumin 0.1%, penicillin G 100U/ml, streptomycin 100Tg/ml and CaCl2 in ranges from 0.4 to 1.5.
Calcium-regulated PTH secretion
After 5 hours of incubation, the parathyroid tissue was sequentially transferred at 1 hour intervals to other wells containing solutions with variable concentrations of calcium: 0.4, 0.6, 0.8, 1.0, 1.25, and 1.35 or 1.5mM. The calcium concentration was confirmed in each experiment by measuring the ionised calcium using a selective electrode (model 634, Ciba Corning, Essex, United Kingdom). The ionised calcium was maintained constant in the medium during the hour of incubation. The iPTH concentration in the incubation medium was measured using the human iPTH IRMA kit (Nichols, Institute, San Juan Capistrano, CA, USA) with an intraassay or interassay variation coefficient of 4.3% and 4.7% respectively.
Evaluation of calcium-regulated PTH secretion in vivo
The calcium-regulated PTH secretion in vivo curve was obtained in 7 kidney patients with secondary hyperparathyroidism. To determine the maximum PTH secretion induced by hypocalcaemia, a continuous intravenous infusion was done of sodium EDTA diluted in 5% dextrose in distilled water at an initial rate of 20mg/kg/h with increases of 5mg/kg/h every 10 minutes for a period of 60 minutes. One week later, the minimum PTH secretion induced by hypercalcaemia was determined by intravenous infusion of calcium gluconate in 5% dextrose in distilled water at an initial rate of 6mg/kg/h with increases of 3mg/kg/h every 10 minutes for 60 minutes. During the experiments, blood samples were taken for ionised calcium concentrations and iPTH at 0, 5, 10, 15, 20, 25, 30, 40, 50 and 60 minutes. The individual values of iPTH and ionised calcium during the hypocalcaemia or hypercalcaemia were recorded, and the parathyroid secretion curve was performed.
Terminology
The following terms were used: 1) baseline PTH: the level of PTH before the induction of hypocalcaemia or hypercalcaemia; 2) maximal PTH: the highest PTH value observed in response to hypocalcaemia and that an additional reduction in the serum calcium concentration does not further increase the PTH value; 3) Minimal PTH: the lowest PTH value during suppression by hypercalcaemia and a further increase in serum calcium did not result in any additional increase in its value; 4) the set point of PTH secretion was calculated in two ways: one as the serum calcium concentration at which maximal PTH secretion is reduced by 50% and the other as the calcium concentration at which the difference between maximal and minimal PTH was reduced by half.3
The iPTH was determined using IRMA (Allegro, Nichols Institute, San Juan Capistrano, CA, USA). The serum ionised calcium was measured with a calcium-selective electrode (Ciba Corning c-634). The total serum calcium and phosphorous were measured with standard laboratory techniques.
Reagents
The RPMI was acquired at Biowhittaker, Vervier, Belgium, the PBS at Oxoid, Hampshire, United Kingdom and the remaining reagents from Sigma, St. Louis, MO, USA.
Statistical analysis
Values are expressed as mean ± SD. ANOVA and Duncan’s test were used to compare multiple averages. Non-paired t-test was used to evaluate the differences between group averages. The correlation between two variables was evaluated by linear regression analysis.
RESULTS
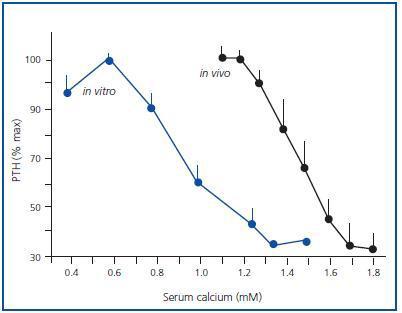
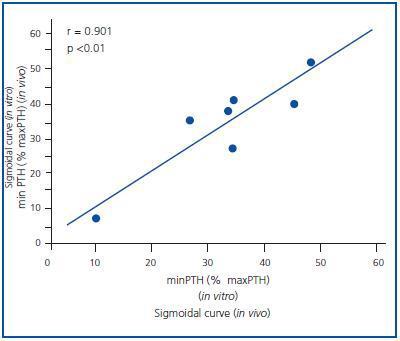
Figure 1 shows the mean of the curves of the dynamics of calcium-regulated PTH secretion in vivo of the 7 uraemic patients with secondary hyperparathyroidism and the mean of the curves in vitro of the obtained glands. To facilitate comparison between in vivo and in vitro assays, the PTH secretion is represented as a percentage of maximal stimulation. The in vivo and in vitro curves were sigmoidal and very similar. Furthermore, the maximal level of PTH inhibition (minimal PTH) was similar in both experiments, 30.5 ± 8.1 against 33.6 ± 5.4% in vivo and in vitro, respectively (p = NS), with a very significant direct correlation (r = 0.91; p < 0.01) (Figure 2).
In the parathyroid tissue of hyperplastic glands, the increase in extracellular calcium in vitro produces a reduction in PTH secretion that appears with calcium as low as 0.8mM and a maximal inhibition of PTH secretion levels with serum calcium of 1.25mM.
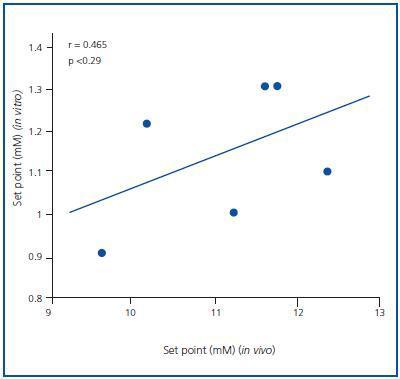
The PTH secretion set point was greater in the in vivo assay than in the in vitro assay. The average PTH secretion set point in vivo was 1.57 ± 0.05mM, higher than the in vitro value, which was 1.27 ± 0.07mM (p < 0.001), with no significant correlation (r = 0.465; p = NS) (Figure 3). Similar results were obtained when the set point was calculated as the calcium concentration that reduced PTH secretion to half of the maximal and minimal secretion (1.46 ± 0.05 in vivo against 0.92 ± 0.05mM in vitro; p < 0.001)
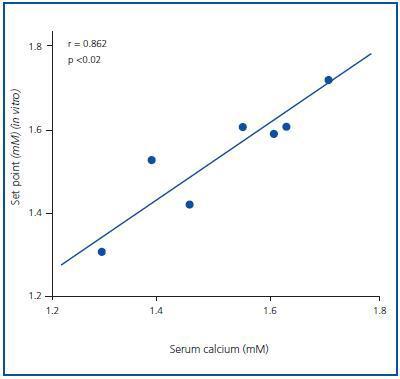
The set point in vivo did not correlate to the baseline, maximal or minimal PTH concentrations (the value of R was 0.403, 0.229 and 0.624, respectively), although it did correlate significantly to the baseline serum calcium concentration (r = 0.862; p <0.02) (Figure 4).
DISCUSSION
Parathyroid cells, in vivo and in vitro, respond to increasing concentrations of extracellular ionised calcium, with a rapid reduction of PTH secretion, and to decreasing concentrations of extracellular ionised calcium with a rapid increase in PTH secretion. This effect is mediated by a direct interaction of calcium ions with the calcium-sensitive receptor.
This relationship between PTH secretion and extracellular calcium concentration can be expressed with a sigmoid curve. Similarly, the sensitivity of the parathyroid gland to extracellular calcium concentration can be defined by the calcium set point that is often expressed as the calcium concentration required to reduce maximal PTH secretion by half,3,5 although it can also be expressed as the serum calcium concentration required to reduce PTH secretion by half of the difference between maximal and minimal values.6,7,11
Different studies show, both in vivo and in vitro, that the PTH response to calcium concentration is abnormal in primary hyperparathyroidism patients13,14 and in uraemic patients with secondary hyperparathyroidism.15-17
Our in vitro assay demonstrated a rapid down-regulation between the extracellular calcium-sensitive receptors and extracellular calcium concentration.18
In vitro assays using isolated parathyroid cells from adenomas of hyperplastic glands show that the PTH secretion set point was greater than in normal parathyroid tissue, suggesting an abnormal regulation of calcium-regulated PTH secretion.13-17 Nevertheless, an in vivo assay in which healthy volunteers were compared to patients affected by chronic kidney disease with secondary hyperparathyroidism found no differences in the calcium set point of both groups.19
Other recent studies have mentioned that calcimimetics, in studies with uraemic rats with parathyroid hyperplasia, are capable of increasing mRNA of the calcium-sensitive receptor.20 Similarly, another recent study reports that calcimimetics (Cinacalcet), in uraemic patients with secondary hyperparathyroidism, are capable of increasing the sensitivity of the gland to the inhibiting effect of the calcium, reducing the calcium set point.21
The great majority of studies that assess the sigmoidal curve of PTH secretion and the calcium set point have been done in vitro or in vivo, but there is little information that compares in vivo results with in vitro ones.
This study compares the dynamics of PTH secretion in vivo (PTH-calcium curve) of uraemic patients with secondary hyperparathyroidism to the dynamics obtained in vitro using the hyperplastic parathyroid glands of the same patients after surgical resection.
Although the shapes of the PTH-calcium sigmoidal curves were very similar, the set point in vivo and the complete curve shifted to the right compared to the curve obtained in vitro. However, there was a close relation in the study between maximal PTH inhibition obtained in vitro and in vivo.
It is accepted that maximal PTH values in vivo are a reflection of the mass of parathyroid gland;3 it must also be taken into account that the in vivo result probably shows a combined response from all the glands. In contrast, in vitro results only reflect the response of a specific gland, which would explain the fact that in our study we obtain similar curves in vivo and in vitro, but with a greater set point and the curve shifted more to the right in the in vivo assay.
Our study also shows that the calcium-regulated PTH secretion set point in patients with secondary hyperparathyroidism was significantly correlated to the baseline serum calcium, confirming previous observations in haemodialysis patients.22 These results suggest that the in vivo calcium-regulated PTH secretion is more closely related to the serum calcium concentration than to the severity of the secondary hyperparathyroidism evaluated by the blood PTH level. From there we can deduce that the hyperplastic parathyroid gland is probably capable of adapting to the serum calcium concentration, since the modification of serum calcium is associated with a parallel change in the PTH secretion set point.23 Thus, with our data and other published studies24 we might consider that the degree of hypercalcaemia and the increase in PTH secretion set point probably better reflect the severity of secondary hyperparathyroidism.
To conclude, the set point in vivo of calcium is more related to the serum calcium concentration than the baseline PTH concentration. Although there are differences between the calcium set point in vivo and in vitro, the maximal degree of PTH inhibition and the dynamics of calcium-regulated PTH secretion were similar in both circumstances.

Figure 1.

Figure 2.

Figure 3.

Figure 4.


