


Introducción: La hemodiafiltración (HDF) con altos volúmenes de reinfusión es la técnica más eficaz en la depuración de toxinas urémicas. Existen distintas modalidades dependiendo del lugar donde se administra el volumen de sustitución en el circuito extracorpóreo: predilucional, mixta o mid-dilucional y posdilucional, en las que la infusión se realiza pre, de forma simultánea pre y pos, y posdilucional, respectivamente. Objetivo: Comparar la depuración de moléculas pequeñas, medianas y unidas a proteínas y el volumen convectivo administrado en HDF en línea (HDF-OL) con infusión posdilucional y mixta (pre-posdilucional). Material y métodos: Estudio prospectivo, aleatorizado y cruzado, comparando HDF-OL posdilucional y mixta. Los pacientes (n = 8) fueron asignados aleatoriamente para recibir 6 sesiones en cada técnica. Se realizaron 89 sesiones, de las cuales 68 fueron a tiempo programado (TP) y 21 a tiempo efectivo (TE). Se determinaron los porcentajes de reducción (RR) de distintas sustancias y los volúmenes de infusión. El estudio de los RR se realizó con TE. Resultados: El KT obtenido fue mayor con HDF-OL posdilucional [68 (8,1) frente a 64,9 (8,8) litros] (p = 0,009) cuando los pacientes se dializaron a TP. Esta diferencia desaparecía cuando la diálisis se realizaba a TE. La diferencia entre el TP-TE fue mayor en la HDF mixta con respecto a la HDF posdilucional [10,3 (7,4) frente a 6,5 (3,1) minutos, p = 0,02]. No encontramos diferencias en los RR de las sustancias analizadas. Conclusión: La HDF-OL mixta no es inferior a la posdilucional ni en la depuración de moléculas pequeñas y medianas ni en las unidas a proteínas a igual TE.
Introduction: Haemodiafiltration (HDF) with high reinfusion volumes is the most effective technique for clearing uraemic toxins. There are various modalities depending on the location where the replacement volume is administered in the extracorporeal circuit: pre-dilution, mixed or mid-dilution and post-dilution, in which the infusion is carried out pre-dilution, pre- and post-dilution simultaneously and post-dilution, respectively. Objective: Compare the clearance of small, medium-sized and protein-bound molecules and the convective volume administered in online HDF (OL-HDF) in post-dilution and mixed (pre-post-dilution) infusion. Material and method: A prospective, randomised, crossover study comparing post-dilution and mixed OL-HDF. Patients (n=8) were randomly assigned to receive 6 sessions in each technique. We conducted 89 sessions, of which 68 were at a scheduled time (ST) and 21 at an effective time (ET). We determined the reduction rate (RR) percentages for various substances and the infusion volumes. The RR study was performed using ET. Results: The KT value obtained was greater with post-dilution OL-HDF [68 (8.1) compared to 64.9 (8.8) litres] (P=.009) when patients were dialysed at ST. This difference disappeared when dialysis was performed at ET. The difference between ST and ET was greater in mixed HDF than in post-dilution HDF [10.3 (7.4) compared to 6.5 (3.1) minutes, P=.02]. We found no differences in the RR of the substances analysed. Conclusion: Mixed OL-HDF is not inferior to post-dilution OL-HDF either in the clearance of small and medium-sized molecules or in the clearance of protein-bound molecules at the same ET.
INTRODUCTION
Haemodiafiltration (HDF) with high reinfusion volumes is the most effective uraemic toxin clearance technique, particularly for medium-sized molecules, whose removal is significantly higher with convective techniques. Several studies have shown that HDF improves some complications in haemodialysis (HD) patients, such as hyperphosphataemia,1 malnutrition,2 growth in children,3 the response to erythropoietin4 and to vitamin D5 and dialysis-associated amyloidosis, amongst others.6 There is currently evidence that shows a higher survival rate in patients who undergo dialysis with online HDF (OL-HDF) compared to those on HD,7-10 as we will discuss later. The good results obtained in these studies were determined by the convective transport volume achieved, which was generally more than 20-24l per session.
There are different OL-HDF modalities, depending on the location where the replacement volume is administered in the extracorporeal circuit. In pre-dilution HDF, the dialysate is infused before the entry of blood in the dialyser, which results in haemodilution and decreased diffusive transport. In post-dilution HDF, the dialysate is administered after the dialyser, such that it does not interfere in diffusive transport, but it creates a blood concentration in the dialyser that may increase pressure and cause coagulation problems. Post-dilution HDF is considered the most efficient form. In addition to these most common modalities, there are another two OL-HDL forms in which infusion is carried out simultaneously pre- and post-dilution: mixed OL-HDF and mid-dilution OL-HDF. In mixed OL-HDF, the replacement fluid is infused simultaneously pre- and post-dilution, with the pre- and post-dilution infusion percentage being regulated automatically via transmembrane pressure (TMP) and ultrafiltration (UF) feedback. Mid-dilution requires a special dialyser, in which blood enters through a central fibre bundle and returns in the opposite direction through peripheral fibres. The reinfusion liquid is incorporated between the two dialyser sections; as such, in the first section there is post-dilution HDF and in the second section there is pre-dilution HDF. These mixed OL-HDF forms are a good alternative, since they theoretically avoid the reported disadvantages of pre- and post-dilution OL-HDF. The choice between one modality and the other will depend on the haemorheological characteristics and the blood flow with which the patient is dialysed.
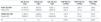
The reported benefits of HDF are based on post-dilution OL-HDF results. The convective volume quantity administered seems to be decisive in improving survival rates. This volume per session was 15l in the European Dialysis Outcomes and Practice Pattern Study (DOPPS),7 17.4l in the Turkish study,8 21.9l in the Convective Transport Study (CONTRAST)9 and 23.1l in the Online Haemodiafiltration Study (ESHOL)10 (Table 1). These studies highlight the need to achieve high convective volumes in order to reduce mortality.
In spite of the importance of the convective volume quantity shown in these studies, we do not know the infusion volume equivalence between the different OL-HDF modalities. Recently, the EUDIAL group11 advised the use of an OL-HDF dilution factor whenever the volume is fully or partially infused before the dialyser (pre-dilution, mid-dilution and mixed dilution modalities). It also insisted on the importance of measuring the effective convective volume adjusted to the body surface in order to quantify the effectiveness of OL-HDF.
The quantity of the convective volume administered has been directly related to the clearance of medium-sized molecules.12,13 Studies that have analysed effectiveness in the removal of solutes comparing convective techniques show that post-dilution infusion is the most effective form for clearing both small, medium-sized and large molecules.14-16 Only Pedrini17 has studied mixed pre-dilution infusion and found a higher reduction percentage in β2-microglobulin (β2m) with mixed HDF in comparison with pre-dilution infusion and similar results to post-dilution infusion (72.1% in mixed, 69.2% in pre-dilution and 74.7% in post-dilution HDF).
OBJECTIVE
To compare the clearance of small, medium-sized and protein-bound molecules and the convective volume of OL-HDF administered with post-dilution and mixed (pre- and post-dilution) infusion in patients on treatment with OL-HDF, in oder to determine the litres of convective volume required with both techniques to achieve equal clearance efficiency.
MATERIAL AND METHOD
Design
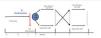
A prospective, randomised, crossover study comparing post-dilution and mixed OL-HDF (Figure 1). Patients were randomly assigned to receive 6 consecutive post-dilution OL-HDF sessions, followed or preceded by 6 mixed OL-HDF sessions
Each patient was a control of themselves and no changes were made to the dialysis regimen or the pharmacological treatment throughout the study.
Given that the modern dialysis monitors interrupt the procedures due to auto-checks that increase the safety, making the effective time (ET) or real time of treatment less than the scheduled time (ST) or the time prescribed by the doctor, these variables were taken into account. The regular regimen was followed, dialysing at ST in sessions 1, 3, 4 and 6, while in session 2 and 5, we dialysed at ET, extending it as needed to match the real time and the scheduled time.
To assess the effectiveness of the technique, we measured clearance of molecules by the reduction percentage of said substances and the convective volume quantity administered.
Patients and dialysis technique
The inclusion criteria were: patients older than 18 years of age on dialysis treatment three times a week and with a minimum of three months on OL-HDF treatment.
The exclusion criteria were: the presence of haemodynamic instability with frequent hypotension, patients contraindicated for heparin use, presence of residual renal function (RRF) defined as mean urea and creatinine clearance of more than 1ml/min or blood flow (Qs) less than 250ml/min.
All patients signed their informed consent at the time of inclusion.
All sessions were carried out with one dialysis monitor: ST5008 (Fresenius, FMC, Bad Homburg, Germany) and using the dialyser FXCorDiax1000 (Fresenius, FMC, Bad Homburg, Germany).
Characteristics of the dialyser: helixone membrane, area of 2.3m2 and UF ratio: 76ml/h/mmHg.
In the dialysis unit we used ultrapure dialysate18 defined by colony forming unit levels/ml less than 0.1 and endotoxins less than 0.03UE/ml.
The post-dilution infusion mode was controlled by the monitor, taking into account total protein values, haematocrit and the dialyser’s hydraulic permeability.
The mixed infusion mode was controlled by UF-TMP feedback. This feedback automatically adjusted the rate and location of infusion (pre-/post-dilution) to the maximum filtration fraction taking into account the flow conditions, internal pressure and hydraulic permeability of the dialyser and its interactions. The system regulated the degree of pre-/post-infusion by two independent infusion pumps whose infusion speed was modulated by internal software depending on the value of TMP, with the aim of maintaining the TMP between 250 and 300mmHG.19,20 TMP was instantly calculated according to the pressure in the four points through the formula:
TMPm = 0.5 x [(P blood dialyser entry + P blood dialyser exit) - (P dialysate entry + P dialysate exit)]
Laboratory tests
Seventy-two hours before the start of the study (last session before start of study) we measured haematocrit and total protein (values introduced in the monitor in post-dilution OL-HDF).
On the middle day of the week (sessions 2 and 5) the patients were dialysed at ET and we obtained pre-dialysis blood samples taken from the arterial line immediately before beginning the technique and post-dialysis blood samples from the arterial line after decreasing the Qs to 50ml/min for 60 seconds.
We measured the different uraemic toxins in blood which, in accordance with the classification,21 were defined as small molecules (molecular weight [MW] less than 500Da): urea (60Da), phosphorus (95Da), creatinine (113Da) and uric acid (168Da); we defined the following as medium-sized molecules (MW greater than 500Da): β2m (11,818Da), myoglobin (17,200Da), and protein-bound molecules: retinol transport protein (RTP) (21,200Da).
In the dialysate, we measured albumin concentration, collecting samples 30, 60 and 120 minutes after starting the OL-HDF session through a device placed in the drainage tube.
We measured β2m by immunoturbidimetry using the immunoassay Immulite® 2000 (Siemens) and RTP was measured by immunonephelometry, using the BN ProSpec® System (Siemens) method. Haematocrit was measured by the autoanalyser ADVIA 2120/2120 and the rest of the biochemical measurements, including albumin in the dialysate, were measured with an autoanalyser (ADVIA® 2400 Chemistry System, Bayer).
Demographic and dialysis parameters
A series of demographic parameters were collected: age, underlying disease, time on HD and OL-HDF, type of vascular access: fistula and catheter.
Dialysis parameters: Qs, dialysate flow, times: ST and ET, conductivity of sodium and bicarbonate, dialysate temperature, heparin type and dose, infusion volumes (total, pre- and post-dilution), mean TMP, the KT measured automatically by the OCM biosensor, UF by session and pre- and post-HDF blood pressure (BP).
Calculations
The reduction (RR) percentages were calculated with the formula: RR (%) = [(Cpre – Cpos)/Cpre] x 100.
Where Cpre and Cpos were the concentrations of the substances analysed pre- and post-dialysis.
For protein-bound substances and β2m, the concentrations at the end of the session were corrected for blood concentration by one correction factor (CF) based on the plasma protein (PT) concentration:
CF= PTpre/PTpos22
Where PTpre and PTpos were the total pre-dialysis and post-dialysis protein concentrations.
Statistical analysis
The statistical analysis was carried out with the SPSS 15.0 software (SPSS INC., Chicago, IL, USA). The descriptive data were presented as the mean and standard deviation (SD).
For the comparison of two independent continuous variables we used the Student’s t-test for paired samples. To compare more than two quantitative variables, we used ANOVA. A P value of <.05 was considered to be statistically significant.
RESULTS
We included 8 patients in the study, 5 males and 3 females; mean age 66 (14) [39-83] years; with a mean time on renal replacement therapy of 14.5 (10) [3-28] years; mean time on OL-HDF of 30.8 (30.9) [4-99] months. The aetiology of chronic kidney disease was glomerulonephritis (3 patients), polycystic kidney disease (2 patients), interstitial nephritis (1 patient) and unknown (2 patients). One patient did not finish the study, completing only the first 6 sessions. We included the data of a total of 89 HDF sessions.
Table 2 displays the characteristics of the dialysis parameters. The anticoagulation dose did not change throughout the study. We used enoxaparin in 2 patients (mean dose per session: 60 [28.2] mg) and 1% sodium heparin in 6 patients (mean dose per session: 53.7 [25.6] mg).
Table 3 displays the pre-dialysis and post-dialysis values for the different molecules analysed, but no significant differences were found.
Figure 2 represents the RR of the substances analysed, with no significant differences having been found in the molecules analysed between post-dilution OL-HDF and mixed OL-HDF.
Table 4 displays the infusion volumes obtained using both techniques, with, as expected, there being a significant difference between them for all volumes, except for the UF volume.
Table 5 displays the results of the KT obtained in ST and ET in accordance with the technique. As can be observed, we found a statistically significant difference in the KT obtained in both techniques (P=.009) when the patients were dialysed at ST. However, this difference disappeared when dialysis was performed at ET.
The difference between ST and ET was greater in mixed HDF than in post-dilution HDF 10.3 [7.4] compared with 6.5 [3.1] minutes), achieving statistical significance (p=.02).
We did not find differences in systolic or diastolic BP before or after we carried out both techniques (pre-dialysis systolic BP: 139.7 [14.4] compared with 140.7 [20.4] mmHg, pre-dialysis diastolic BP: 66.5 [11.5] compared with 63.8 [14.7] mmHg, post-dialysis systolic BP: 128 [15] compared with 132.1 [17.1] mmHg and post-dialysis diastolic BP: 64.7 [11.8] compared with 62.9 [1.9] mmHg for post-dilution and mixed OL-HDF, respectively).
The mean TMP in both techniques was different: 188.3 (37.3) compared with 229.6 (26.7) mmHg in post-dilution and mixed OL-HDF, respectively (P=.002) (the TMP measurement was carried out differently). We did not find differences in albumin concentration in the dialysate at the times analysed (30, 60 and 120 minutes) (Table 6).
DISCUSSION
This study compared the effectiveness of uraemic toxin clearance of two OL-HDF modalities, post-dilution and mixed (pre- and post-dilution) and we found that there were no significant differences in the RR of any of the molecules analysed. Most studies have compared the effectiveness of post-dilution HDF with pre-dilution HDF and have shown that post-dilution OL-HDF is more effective in the clearance of both small and medium-sized molecules.14,23 This is attributed to the fact that in pre-dilution HDF, diffusive transport decreases. As such, post-dilution HDF is considered the most efficient convective treatment and our study shows, for the first time, by measuring the removal of multiple molecules, the non-inferiority of mixed OL-HDF compared with the latter, when the ET was identical for both techniques.
Pedrini et al.17 compared the effectiveness of mixed HDF with other forms of HDF, observing a greater solute clearance with this modality than with pre-dilution infusion and, as with our study, they did not find differences with post-dilution infusion, although their study only displayed results for β2m. The RR of β2m were less that those obtained in our study, 85.3% and 85.4% in post-dilution and mixed dilution HDF, respectively, which was possibly due to the different characteristics of the dialysers and flows used.
Studies that compared the effectiveness of post-dilution OL-HDF with another form of pre-post dilution infusion, mid-dilution,24,25 although carried out with different membranes and surfaces, have found that the reduction percentages of small molecules such as urea and creatinine are slightly higher in post-dilution OL-HDF, while molecules of a larger size, such as β2m, myoglobin, prolactin and RTP presented a higher reduction percentage with mid-dilution. We wish to highlight that the RR of RTP that we obtained (39% and 43.2% in post-dilution and mixed OL-HDL, respectively) were much higher than those of other studies (less than 31%). This is a very interesting finding, since RTP is a protein-bound molecule26 and these molecules have been identified as one of the uraemic toxins responsible for chronic complications in CKD patients, and are characterised as being difficult to remove with HDF, since only their free fraction is removed.27 The good results obtained in our study may be explained by the characteristics of the membrane used that obtains high clearances, thanks to its greater surface area (2.3m2) and the high Qs used. In clinical practice, to measure the effectiveness of OL-HDF, β2m is analysed, which is considered representative of the mean molecules and is related to some of the complications, such as dialysis-related amyloidosis. The convective transport volume has been related to the β2m reduction rate,28 since its clearance is significantly higher in techniques with high convective transport, such as OL-HDF.29
Recently, Sakurai30 suggested the suitability of using a biomarker or substance of a higher MW than β2m to evaluate the efficiency of HDF. He based his recommendation on the fact that this molecule may be cleared effectively by diffusion if high-flow dialysers are used, and as such, he proposed the α1 microglobulin (α1-MG), which has a MW of 33,000Da and is removed by convection, as more representative of HDF. Unfortunately, we did not analyse α1-MG, but we did analyse RTP, which also has a high MW (21,200Da), obtaining high RR.
In relation to the results obtained with the infusion volumes, in our study we achieved high infusion volumes with both techniques, a quantity that was much higher than that in the different studies mentioned, which decreases mortality. The mean infusion volume achieved was 28.3 and 44.4 litres in post-dilution and mixed OL-HDF, respectively. In mixed OL-HDF, we obtained 24.2 litres in post-dilution (4 litres less than with post-dilution OL-HDF) and 20.2 litres in pre-dilution. Although the litres in post-dilution were not equivalent in both techniques, having obtained similar RR we could infer from our study that around 5 litres of pre-dilution infusion volume are required for each litre less of post-dilution infusion that is achieved with mixed OL-HDF with respect to post-dilution OL-HDF, or at least that the post-dilution volume of mixed OL-HDF is 54% of the total volume achieved.
Qs, haematocrit and protein concentration are important determinants of the infusion volume quantity in post-dilution HDF. In the post-dilution HDF, we recommend that the infusion rate in relation to real Qs is not greater than 25-30%, since higher proportions may lead to a high blood concentration, which causes complications. In patients with limited Qs, as in the case of catheter carriers, this maximum rate may compromise the achievement of high infusion volumes in a limited time. Mixed OL-HDF is a more versatile technique that may be used in patients in whom post-dilution OL-HDF does not achieve adequate infusion volumes, either due to high haematocrit or protein or a vascular access that does not allow an appropriate Qs. This is particularly relevant at the present time due to the progressive increase in the proportion of patients who are carriers of permanent catheters.31
The third result to underscore in our study is the importance of taking into account the ET or real time of dialysis. Dialysis time is a key parameter that determines not only suitability, but also other aspects such as phosphorus control, blood pressure and more important still, mortality.32-34 In the previous study carried out over 2162 dialysis sessions that included both HD and OL-HDF, we found a statistically significant difference between ST and ET (p<.001). This difference was proportional to ST; specifically, for the 240 minute sessions, it was 9.7 (12.7) minutes.35 As such, in the study design we considered it was necessary to dialyse at ET for a more thorough comparison of both OL-HDF modalities. In fact, the KT at ST was higher in post-dilution OL-HDF, a result that was not maintained on dialysing at ET. This is explained by the difference found between ST and ET in both techniques, since in mixed OL-HDF when the patient is dialysed at ST, the ET was lower, losing 10.3 (7.4) compared with 6.5 (3.1) in mixed and post-dilution, respectively. This is due to the higher number of interruptions in the process due to autochecks and controls carried out by the dialysis monitor. To our knowledge, this is the first study that has compared the effectiveness of OL-HDF taking into account dialysis ET. If this had not been the case, our conclusion would have been that post-dilution OL-HDF achieves higher KT, which was indeed the case when we dialysed at ST. We cannot say that the reduction percentage in the substances analysed also would have been higher, since it was only measured in the four sessions carried out in the mid-week day (sessions 2 and 5 of both post-dilution and mixed modalities), and in the latter, the patients were dialysed at ET. Instead, we can conclude that it is important to individualise the dialysis time not only for the body area, the existence of RRF, BP, etc., but also for the type of technique. Furthermore, in daily clinical practice we should know the real time in which are patients are dialysed and adjust the prescription accordingly.
Lastly, it is important to stress that the best clearance of large molecules should not be to the detriment of the excessive loss of useful substances such as albumin. In our study, we did not find differences in albumin concentrations in the ultrafiltrate samples analysed between the two techniques. Although the dialyser screening ratio used did not allow a large passage of albumin to the ultrafiltrate and therefore we could confirm that there are no differences between both techniques, we should have measured the total ultrafiltrate volume. This is a limitation of our study.
The main limitation of our study was the small number of patients included, but the fact that the study had a crossover design confirmed the results.
In conclusion, mixed OL-HDF at the same ET is not inferior to post-dilution OL-HDF either in the clearance of small or medium-sized molecules or protein-bound molecules. This OL-HDF modality, on administering pre- and post-dilution dialysate simultaneously, avoids some disadvantages present in other forms of OL-HDF and can be used in patients with flow and/or blood concentration problems.
Acknowledgements
To the nursing staff at the Dialysis Unit of the Hospital Universitario Infanta Leonor for their collaboration in this study.
Conflicts of interest
The authors declare potential conflicts of interest.
Lecture fees: Dr. P. de Sequera, Dr. M. Albalate and Dr. R. Pérez García have participated as speakers in meetings organised by Gambro® and Fresenius®.

Table 1. Main studies that analyse the effect of online haemodiafiltration on mortality in dialysis patients

Table 2. Haemodialysis characteristics

Table 3. Pre-dialysis and post-dialysis values of the substances analysed in both techniques

Table 4. Volumes in both techniques

Table 5. KT at scheduled time and effective time in accordance with the technique

Table 6. Differences in accordance with the technique

Figure 1. Study design.

Figure 2. Reduction percentages of the substances analysed in post-dilution and mixed online haemodiafiltration.