


Both dietary restriction of sodium chloride (NaCl) and treatment with thiazides have been used in hypercalciuric patients.
ObjectivesTo calculate regular salt intake and investigate the correlation between natriuresis and urinary calcium with usual diet (B) and after changing the amount of NaCl intake and administration of thiazides.
Material and methodsNineteen healthy young individuals had their diet replaced by 2l of Nutrison® Low Sodium (500mg sodium/day) daily for two days. Then, 5g of NaCl were added every two days (“5”, “10” and “15”), administering 50mg (H50) and 100mg (H100) of Higroton® on the last two days. Blood sodium, plasma renin activity (PRA) and aldosterone were determined in venous blood samples, as were urinary sodium and calcium. Statistical analysis: Wilcoxon t-test and the Pearson linear correlation were calculated.
ResultsUrinary Na (mEq/24h): 210.3±87.6 (“B”); 42.7±20.4 (“5”); 135.5±50.6 (“10”); 225.5±56.7 (“15”). Urinary calcium (mg/24h): 207.8±93.6 (“B”); 172.8±63.1 (“5”); 206.2±87.7 (“10”); 227.4±84.1 (“15”). A positive correlation was observed between natriuresis and urinary calcium in “10” (r=0.47) and “15” (r=0.67). After Higroton®, natriuresis: 232.3±50.7; 377±4 (H50); 341.1±68.4 (H100); Ca in urine: 209.8±57.4; 213.2±67.6 (H50); 159.1±52.2 (H100).
ConclusionsSalt intake in the population studied was estimated to be 14.9±4.9g/day with a positive correlation found between sodium and calcium urine output with daily intakes of 11.25 and 16.25g of salt. With the usual intake, for each gram of salt, urinary calcium increased by 5.46mg/24h and with 100mg of Higroton® it decreased by 50.7mg/24h. These data could be useful for the management of patients with excretory hypercalciuria or hypoparathyroidism.
La restricción de ClNa en la dieta y el tratamiento con tiazidas han sido utilizados en pacientes hipercalciúricos.
ObjetivosConocer la ingesta habitual de sal y la correlación entre natriuria y calciuria con la dieta habitual (B) y tras la modificación de la cantidad de ClNa y la administración de tiazidas.
Material y métodosDiecinueve jóvenes sanos, a los que se les sustituyó su dieta por 2l diarios de Nutrison® Low Sodium (500mg de Na) durante 2 días. Posteriormente se añadieron cada 2 días 5g de ClNa («5», «10» y «15») y durante los 2 últimos días 50 y 100mg de Higrotona® (H50) y (H100). Se determinaron iones, ARP y aldosterona en sangre venosa, así como la natriuria y calciuria. Valoración estadística: se calcula la t de Wilcoxon y la correlación lineal de Pearson.
ResultadosNatriuria (mEq/24h): 210,3±87,6 («B»); 42,7±20,4 («5»); 135,5±50,6 («10»); 225,5±56,7 («15»). Calciuria (mg/24h): 207,8±93,6 («B»); 172,8±63,1 («5»); 206,2±87,7 («10»); 227,4±84,1 («15»). Correlación positiva entre natriuria y calciuria en «10» (r=0,47) y en «15» (r=0,67). Tras Higrotona®, natriuria: 232,3±50,7; 377±4 (H50); 341,1±68,4 (H100); Ca en orina: 209,8±57,4; 213,2±67,6 (H50); 159,1±52,2 (H100).
ConclusionesLa ingesta de sal en la población estudiada es de 14,9±4,9g/día. Encontramos correlación entre natriuria y calciuria con ingestas de 11,25 y 16,25g de sal. Con la ingesta habitual, por cada gramo de sal aumenta la calciuria 5,46mg y con 100mg de Higrotona®, la calciuria disminuye 50,7mg/24h. Los datos podrían ser de utilidad para el manejo de pacientes con hipercalciuria excretora o hipoparatiroidismo.
Hypercalciuria (HC), whether of resorptive, absorptive or excretory origin, constitutes a risk for nephrolithiasis, nephrocalcinosis and even osteoporosis.1–5 In excretory HC, treatment with thiazides decreases urinary calcium elimination by increasing resorption in the proximal tubule.6 A similar situation of HC occurs frequently in the treatment of hypoparathyroidism, with the exogenous contribution of vitamin D and calcium; calcium is excreted freely by the kidney, since in the absence of parathormone (PTH) there is a reduction in the tubular reabsorption of Ca.
In addition, the excretion of urinary calcium is modulated by multiple nutritional factors such as high intake of animal proteins and salt, calcemia and magnesemia, and acid-base balance.4,5,7–12 Therefore, in addition to thiazide therapy, the treatment of HC should include nutritional modifications.11,12 The restriction of salt in the diet is essential in these processes. We want to quantify the correlation between natriuresis and calciuria, using an artificial diet (Nutrison® Low Sodium) and staggered increases of oral NaCl and the added treatment of thiazides with the maximum dose of ClNa. In addition, we will assess the acute response of plasma renin activity (ARP) and aldosterone levels. Thus, we intend to know the relationship between salt intake with the urinary excretion of Na and Ca and, the modifications that may occur with thiazide treatment. This information will indicate if in the treatment of HC with Thiazides it is essential to reduce salt intake and to what extent; or, whether the limitation of salt intake it is not important if patients are on thiazides.
ObjectiveOur objective is to assess the normal salt intake in a young, healthy, male population, and study the correlation between urine Na and Ca with on the regular diet and after modification of salt intake while on thiazides.
Material and methods- (A)
Subjects: Nineteen healthy males, 18–30 years old, height 178.47±5.75cm; weight 81.4±8.8kg and body mass index 25.56±3.0kg/m2. Patients signed the informed consent. They did not have high blood pressure, nephrolithiasis, renal failure, dyslipidemia or obesity.
- (B)
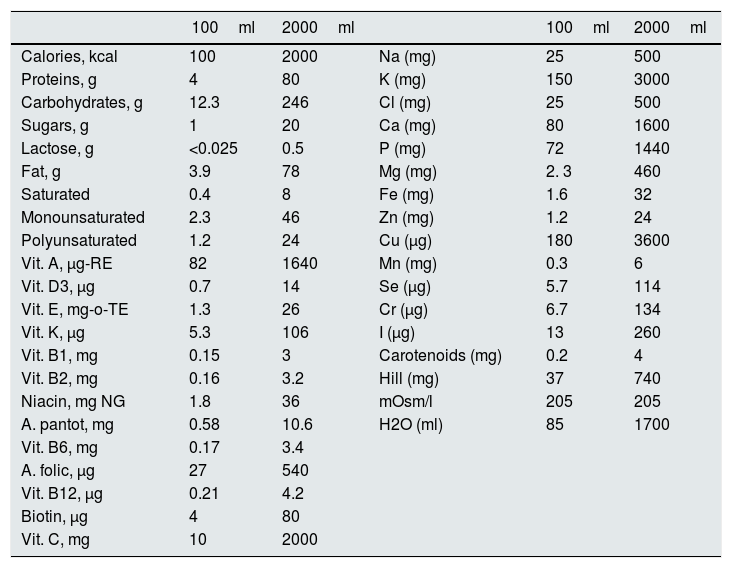
Protocol: The study was conducted for 8 days and, in 12 of them, it was extended up to 10 days. His usual diet was replaced by 2½l of Nutrison® Low Sodium, which provides 2000kcal; Calcium: 1600mg, Sodium: 500mg (equivalent to 1.250g of sodium chloride) and known amounts of macro and micronutrients shown in Table 1. In addition, a daily intake of 1.5–2.0L of water was recommended.
Table 1.Composition of Nutrison® low in sodium.
100ml 2000ml 100ml 2000ml Calories, kcal 100 2000 Na (mg) 25 500 Proteins, g 4 80 K (mg) 150 3000 Carbohydrates, g 12.3 246 Cl (mg) 25 500 Sugars, g 1 20 Ca (mg) 80 1600 Lactose, g <0.025 0.5 P (mg) 72 1440 Fat, g 3.9 78 Mg (mg) 2. 3 460 Saturated 0.4 8 Fe (mg) 1.6 32 Monounsaturated 2.3 46 Zn (mg) 1.2 24 Polyunsaturated 1.2 24 Cu (μg) 180 3600 Vit. A, μg-RE 82 1640 Mn (mg) 0.3 6 Vit. D3, μg 0.7 14 Se (μg) 5.7 114 Vit. E, mg-o-TE 1.3 26 Cr (μg) 6.7 134 Vit. K, μg 5.3 106 I (μg) 13 260 Vit. B1, mg 0.15 3 Carotenoids (mg) 0.2 4 Vit. B2, mg 0.16 3.2 Hill (mg) 37 740 Niacin, mg NG 1.8 36 mOsm/l 205 205 A. pantot, mg 0.58 10.6 H2O (ml) 85 1700 Vit. B6, mg 0.17 3.4 A. folic, μg 27 540 Vit. B12, μg 0.21 4.2 Biotin, μg 4 80 Vit. C, mg 10 2000
During 1st and 2nd days, patients took only Nutrison®. During the 3rd and 4th days, 5g of salt per day were added in capsules divided into 3 doses, the dose of salt was increased to 10g during days 5 and 6 and it was further increased to 15g per day during days 7 and 8. In 12 patients the study was continued on days 9 and 10, with 2L of Nutrison®, 15g of salt and a thiazide (Higrotona®), 50mg on day 9 and 100 ng on day 10 (2 pills of 50mg).
Twenty four hours Urine collection was obtained on days – 1, 2, 4, 6, 8, 9 and 10, for determination of Na, ionic Ca, Cl, K and Mg.
Venous blood was taken on an empty stomach on days 1, 3, 5, 7, 9 and 11, for determination of Na, Ca++, Cl, P, Mg, K, Cr, PRA and aldosterone.
- (C)
Statistics: results are expressed as mean and standard deviation. Wilcoxon test was used to compare different means, and Pearson's linear correlation was used to study the association between pairs of variables. A 95% was established as statistical significance.
- (a)
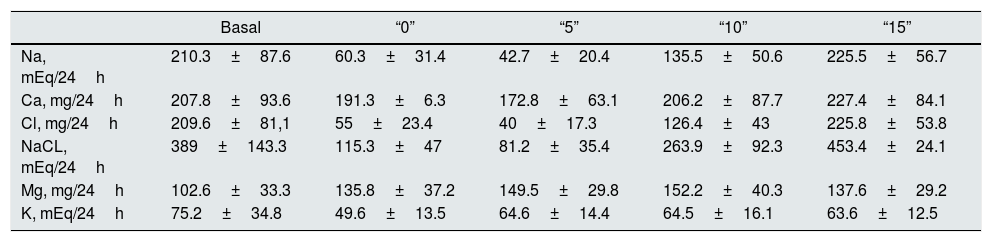
Urinary excretion on days – 1st (“B”: free diet, prior to the study); 2nd (1.25g of NaCl, “0”), 4th (6.25g of NaCl, “5”), 6th (11.25g NaCl, “10”) and 8° (1625g of ClNa, “15”), n=19.
Urinary Na (mEq/24h). Relative to the baseline, natriuresis decreases to lowest levels in “0” and “5”. The increase in salt intake increases natriuresis and the difference is significant (p<0.006) between all the values, except between the baseline and “15” (Table 2). Taking into account that Nutrison® contains 500ng of Na, equivalent to 1.25ng of NaCl, we assume that the ingestion with Nutrison® is 1.25ng of NaCl. Therefore the amount of salt ingested (calculation with respect to sodium ingested) is: unknown (“B”); 1.25g (“0”); 6.25g (“5”); 11.25g (“10”); 16.25g (“15”). The urinary excretion of Na relative to the to the salt intake was: unknown (“B”); 276±144% (“0”); 39.2±18.7% (“5”); 69.2±25.7% (“10”); 79.4±20% (“15”). From these data, it can be concluded that the salt intake with the basal diet is of the order of 15.2±6.33g.
Table 2.Urinary excretion of electrolytes with different salt intake.
Basal “0” “5” “10” “15” Na, mEq/24h 210.3±87.6 60.3±31.4 42.7±20.4 135.5±50.6 225.5±56.7 Ca, mg/24h 207.8±93.6 191.3±6.3 172.8±63.1 206.2±87.7 227.4±84.1 Cl, mg/24h 209.6±81,1 55±23.4 40±17.3 126.4±43 225.8±53.8 NaCL, mEq/24h 389±143.3 115.3±47 81.2±35.4 263.9±92.3 453.4±24.1 Mg, mg/24h 102.6±33.3 135.8±37.2 149.5±29.8 152.2±40.3 137.6±29.2 K, mEq/24h 75.2±34.8 49.6±13.5 64.6±14.4 64.5±16.1 63.6±12.5 Basal: free diet, prior to the study; “0”: 1.25g of NaCl; “5”: 6.25g of NaCl; “10”: 11.25g of NaCl; “15”: 16.25g of NaCl.
Urine Ca (mg/24h). There is a statistically significant increase in Urine Ca between “0” and “15”, “5” and “10”, “5” and “15”, and “10” and “15” (all with p<0.03) (Table 2).
Correlation between Ca and Na in 24h urine. There is no correlation of these 2 parameters with the free diet “B” neither in “0” nor in “5”. However there is a correlation in “10” (r=0.47, p<0.03) and in “15” (r=0.67, p<0.001) (Fig. 1). An increase in NaCl in the diet of 10g, from 6.25g to 16.25g, produces an increase in natriuresis 182.8±66.4mEq/24h and calciuria 54.6±39.4mg/24h. Thus, 1g of ClNa increases calciuria by 5.46mg (Table 2).
Urine Cl (mEq/24h). With the increase of salt intake, the excretion of Cl increases. The difference is significant between all the values, except between the basal and 16.25g of salt.
The modifications in the excretion of ClNa, Mg and K are shown in Table 2.
- (b)
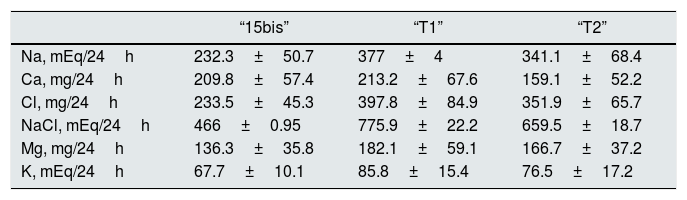
Urinary excretion at day 9, with a 16.25g of salt intake (“15bis”) and 50mg/day of Higrotona® (“T1”) and at day 10 day, with 16.25g de salt and 50mg de Higrotona®/12h (“T2”), n=12.
Treatment with diuretic produce an increase in the urinary excretion of Na, Cl, ClNa and Mg and no differences were observed with the two doses of diuretics. Calciuria was not different, with 50mg of thiazide “T1” and “15bis” and with 100mg there is a significant decrease, from both “15bis” (p<0.03) and “T1” (p<0.03). The redction of calciuria after 100mg of thiazide is 50.7mg/24h (Table 3).
Table 3.Urinary excretion of electrolytes with 16.25 salt intake (“15 bis”) and after adding 50 (“T1”) and 100mg (“T2”) of Higrotona®.
“15bis” “T1” “T2” Na, mEq/24h 232.3±50.7 377±4 341.1±68.4 Ca, mg/24h 209.8±57.4 213.2±67.6 159.1±52.2 Cl, mg/24h 233.5±45.3 397.8±84.9 351.9±65.7 NaCl, mEq/24h 466±0.95 775.9±22.2 659.5±18.7 Mg, mg/24h 136.3±35.8 182.1±59.1 166.7±37.2 K, mEq/24h 67.7±10.1 85.8±15.4 76.5±17.2 Fig. 1 shows that the restriction of dietary salt decreases natriuresis and calciuria, as observed in the lower and left area of the graph. After the addition of thiazide there is a decrease in calciuria and an increase in urinary sodium.
- (c)
Modification of plasma electrolytes levels with salt intake and treatment with thiazides are shown in Table 4.
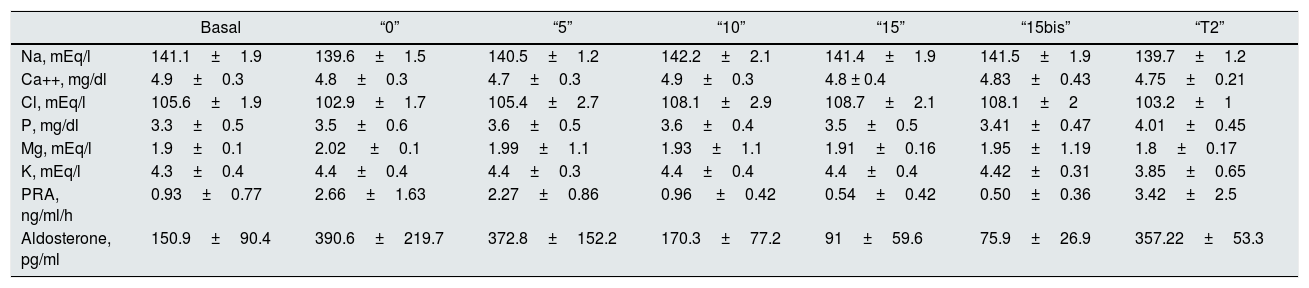
Table 4.Plasma levels of ions, PRA and aldosterone with different salt intake and the treatment with thiazides.
Basal “0” “5” “10” “15” “15bis” “T2” Na, mEq/l 141.1±1.9 139.6±1.5 140.5±1.2 142.2±2.1 141.4±1.9 141.5±1.9 139.7±1.2 Ca++, mg/dl 4.9±0.3 4.8±0.3 4.7±0.3 4.9±0.3 4.8 ± 0.4 4.83±0.43 4.75±0.21 Cl, mEq/l 105.6±1.9 102.9±1.7 105.4±2.7 108.1±2.9 108.7±2.1 108.1±2 103.2±1 P, mg/dl 3.3±0.5 3.5±0.6 3.6±0.5 3.6±0.4 3.5±0.5 3.41±0.47 4.01±0.45 Mg, mEq/l 1.9±0.1 2.02 ±0.1 1.99±1.1 1.93±1.1 1.91±0.16 1.95±1.19 1.8±0.17 K, mEq/l 4.3±0.4 4.4±0.4 4.4±0.3 4.4±0.4 4.4±0.4 4.42±0.31 3.85±0.65 PRA, ng/ml/h 0.93±0.77 2.66±1.63 2.27±0.86 0.96 ±0.42 0.54±0.42 0.50±0.36 3.42±2.5 Aldosterone, pg/ml 150.9±90.4 390.6±219.7 372.8±152.2 170.3±77.2 91±59.6 75.9±26.9 357.22±53.3 Basal: free diet, prior to the study; “0”: 1.25g of NaCl; “5”: 6.25g of NaCl; “10”: 11.25g of NaCl; “15”: 16.25g of NaCl; “15bis”: 16.25g of NaCl; “T2”: 16.25g of ClNa and 100mg of thiazide (Higrotona®). PRA: plasma renin activity
Plasma sodium is normal in all determinations. The lowest value of ionic calcium is obtained in “5”, which statistically significant different as compared with basal (p<0.008) and “10” (p<0.03). No significant differences were observed between the rest of values.
After the administration of 100mg of Higrotona®, there was a decrease in Na (p<0.001), Cl (p<0.00001) and K (p<0.01) and an increase in P (p<0.004), without differences in the levels of ionic Ca and Mg.
- (d)
Plasma levels of ARP and aldosterone.

Values of PRA (ng/ml/h). From “B” to “5” there is a considerable increase in PRA, which is attenuated with increasing doses of NaCl. The addition of 100mg of Higrotona® to 16.25g of salt produced a marked increase in PRA (p<0.0006) (Table 4).
Values of Aldosterone (pg/ml). With 10g values are similar to baseline and with15g of salt intake the values were reduced. After thiazide administration there was a remarkable increase in Aldosterone (p<0.0007).
Fig. 2 shows the evolution of natriuresis and serum aldosterone concentration depicting a impeccable mirror image; a reduction of natriuresis due to low intake of Na is accompanied by an increases in aldosterone level and with a high salt intake, natriuresis increases and aldosterone production is blocked.
Discussion. Lower curve: Na in urine, mEq/24h.")
Regulation of calciuria is dependent on natriuresis which, in turn, depends closely on the salt intake.2,5 Na and Ca are reabsorbed together in the proximal nephron, in the ascending portion of the loop of Henle and in the distal tubule; therefore if natriuresis increases there is also an increase in calciuria.13
Some studies have analyzed the correlation between urinary excretion of Na and Ca, in individuals on a regular diet,14,15 or with modification of salt intake,13,16 however these studies have tested very low vs very high salt intake. Our study is the first using a dose of 1.25g of salt intake and evaluating calciuria with gradual increase in salt intake and with the introduction of thiazide. Other studies have evaluated the effect of different Calcium intake. Low calcium intake increases PTH, which can decrease bone mass and maintain or increase calciuria,11 thus in these type of studies may not be appropriate to use a calcium deficient diet. In our opinion, previous studies have some limitations; first, in studies with the usual diet, there is a great heterogeneity in the nutritional habits among the subjects. Even when an elaborated diet has been administered in terms of calories and known amount of macro and micronutrients,17,18 there is important variability of the foods according to their origin, handling, elaboration... Our method of supplying a liquid artificial is the method to assure that Ingested quantities are known and always the same.
In the majority of cross-sectional studies there is a correlation between natriuresis and calciuria,2,10,19 however others do not find this correlation in hyper- or normocalciuric patients1 or if calcium intake is high.2 Probably the lack of correlation is not only due to differences in salt intake, but to the complexity of inter-relationships with dietary calcium and with the intake of proteins of animal origin.
In our study, natriuresis decreased from the free diet to the first phase with Nutrison®, without addition of NaCl. In a study in Spain,20 with a diet of less than 2.5g of salt the natriuresis was 25.3±4.04mEq/24h and with a 17.5g of salt intake the natriuresis rises to 340.3±156mEq/24h. In our subjects taking 6.25g, the natriuresis continues to decrease as compared with “0” with a 1.25g of salt intake because there is a marked increase in PRA and aldosterone due to the low salt intake. In “5” the levels of these hormones remain high, so the excretion of Na is reduced (Fig. 2). These data provides information on normal salt intake that is much higher than 6.25mg/day. With 11.25 and 16.25g of salt Natriuresis increases. As compared with the free diet, the natriuresis is lower in “10” and similar in “15”. Our results regarding the amount of Na excreted in grams have allowed us to calculate in what amount of NaCl these values are contained. We have been able to verify that the urinary excretion of Na is reduced with low or normal salt intakes and increases with the amount of salt ingested. Thus, with a total intake of 16.25g of NaCl, 79.4% is excreted, and with 6.25g of NaCl intake the excretion is 39.2%. So, since the results of natriuresis with the basal diet are similar to “15”, assuming that in “B” 79.4% have been excreted, the salt intake with the free diet should be 15.2±6.33g of ClNa/day.
The calciuria reproduces the dynamics of natriuresis; decreasing the excretion of Na between “0” and “5”, calciuria does not increase, despite the higher intake of NaCl. Between “5” and “15”, that is, a net increase of 10g of NaCl intake (from 6.25 to 16.25g), calciuria increases to 54.6mg/24h, so that 1g of salt in the diet increases calciuria by 5.46mg (Fig. 1). The increased natriuresis inhibits the calcium reabsorption in the proximal tubule.1 Another possible mechanism to explain the increase in calciuria could be the increase in extracellular volume due to the increase in salt intake.3 Our results are similar to those published in most of the dynamic studies with modification of the salt intake (1g of ClNa added to the diet increases the calciuria 4.19mg/24h).9
Thiazides produce a decrease in calciuria by acting in the distal tubule independent of natriuresis. Twelve of the subjects continued the study adding 50mg of Higrotona® on the 9th day and 100mg on the 10th day. We have not seen this protocol done in any previous study. After Higrotona®, natriuria increases, with no differences between the 2 doses and there is a decrease in calciuria of 50.7mg/24h with 100mg, and not observed with the dose of 50mg (Fig. 1). With a salt intake between 11.25 and 16.25g/day (assuming that this is the usual amount of NaCl in the free diet) it can be quantified the decrease in calciuria obtained by adding the effect of Higrotona® to the of the salt restriction (difference between “15” and “5”). With a salt intake of 6.25g (compared to 16.25g) and Higrotona® 100mg, the decrease in calciuria is 105.3mg/24h (54.6mg due to the decrease in NaCl and 50.7mg due to Higrotona®). This is an important reduction of calciuria with expected clinical impact on the risk of nephrolithiasis or nephrocalcinosis. Although we have used thiazide with a dose of 16.25g of salt, we believe that its effect is maintained, with lower salt intake, as the mechanism of action is independent of natriuresis. The increase in natriuresis due to thiazides is accompanied by a decrease in serum Na concentration, with no change in calcemia. Also serum potassium decreases due to the loss of potassium in the urine.
The renin-angiotensin-aldosterone system is stimulated in a situation of low salt intake and it is inhibited by high salt diet.20–23 Salt restriction produces an increase in PRA and serum aldosterone concentration; the highest levels are observed in “0” and “5”, with a subsequent progressive decrease with the increase in salt intake. In “5”, despite ingesting 6.25g of salt, the levels of PRA and aldosterone are higher than basal, which explains why natriuresis was not increased yet. The level of aldosterone in “15” is lower than “B”, which confirms that the basal intake of salt is less than 16.25μg NaCl. After treatment with Higrotona® there is a significant increase in PRA and aldosterone.
According to our study, the salt intake in the studied population is higher than that recommended by the WHO and it can be estimated at 14.9±44.9g/day. With an increase in intake of 6.25 to 16.25g of salt, calciuria increases by 54.6mg/24h and after thiazide there is a decrease of 50.7mg/24h.
The data obtained could be useful for dietary and therapeutic management of patients with excretory hypercalciuria or hypoparathyroidism. The choice of salt restriction in the diet or use of thiazides will be conditioned by factors such as the severity of hypercalciuria, the degree of adherence to dietary and pharmacological treatment, economic availability, the presence of side effects such as hypotension or hypokalemia and the choice of the patient.
It would probably be recommendable to start with reduction of salt intake in all hypercalciuric patients and, given its different mechanism of action, in case of not achieving therapeutic objectives, will be recommended to associate an effective dose of thiazide.
Conflict of interestThe authors declare that they have no conflicts of interest
We want to thank Dr. Ramón Albero and Dr. Julio Lázaro for their participation in this work.
Please cite this article as: Martínez García M, Trincado Aznar P, Pérez Fernández L, Azcona Monreal I, López Alaminos ME, Acha Pérez J, et al. Comparación de los efectos inducidos sobre la calciuria por tiazidas y diferentes dosis de sal en la dieta: implicaciones en la práctica clínica. Nefrologia. 2019;39:73–79.


