


When estimating the glomerular filtration rate (GFR) in kidney transplant patients, significant differences have been found between MDRD and the 2009 CKD-EPI equations, and reference techniques.
ObjectiveTo analyse and compare the performance of MDRD and the 2009 and 2012 CKD-EPI equations against 51Cr-EDTA plasma clearance in measuring GFR in 270 kidney transplant patients after one year.
ResultsThe mean measured GFR was 43.0 ± 11.4 (18.2–79.4) ml/min/1.73 m2, with creatine levels of 1.42 ± 0.46 (0.60–4.33) mg/dl and cystatin C levels of 1.45 ± 0.53 (0.42–3.48) mg/l. This correlated moderately with creatinine (r=–0.61, p < 0.001) and cystatin C (r=–0.52, p < 0.001). Using linear regression techniques, it was found that creatinine, cystatin C, gender and age only explained 52% of GFR total variance. All equations overestimated GFR, with a mean bias of +11.1 ml/min/1.73 m2 for MDRD, +16.4 ml/min/1.73 m2 for 2009-CKD-EPI, +15 ml/min/1.73 m2 for CKD-EPI with cystatin C and +14.1 ml/min/1.73 m2 for 2012-CKD-EPI with creatinine and cystatin C. eGFR by MDRD and the 2009 CKD-EPI equation correlated better with 51Cr-EDTA than CKD-EPI with creatinine and/or cystatin C. The overestimations were negatively correlated with creatinine and cystatin C levels, most significantly for CKD-EPI with creatinine and/or cystatin C when GFR was greater than 60 ml/min/1.73 m2.
ConclusionsThe 2012 CKD-EPI equations with creatinine and/or cystatin C significantly overestimate GFR in stage 1 and 2 chronic kidney disease. The MDRD equation is therefore recommended in these cases. The reference method used to measure GFR seems to heavily influence the bias of the equations.
Para la estimación del filtrado glomerular renal (FG) en trasplantados renales se emplean las ecuaciones MDRD y CKD-EPI de 2009 que han mostrado diferencias importantes cuando se comparan con el FG medido con técnicas de referencia.
ObjetivoAnalizar el rendimiento de las ecuaciones MDRD, CKD-EPI de 2009 y de 2012 en 270 pacientes trasplantados renales de 1 año de evolución, comparando con el FG medido con aclaramiento plasmático de 51Cr-EDTA.
ResultadosEl FG medido fue 43,0 ± 11,4 (18,2-79,4) mL/min/1,73 m2, con niveles de creatinina de 1,42 ± 0,46 (0,60-4,33) mg/dL y de cistatina C de 1,45 ± 0,53 (0,42-3,48) mg/L. El FG medido se correlacionó moderadamente con creatinina (r= -0,61, p < 0,001) y cistatina C (r= -0,52, p < 0,001). Empleando técnicas de regresión lineal observamos que creatinina, cistatina C, sexo y edad sólo explicaban el 52% de la varianza total del FG. Todas las ecuaciones sobrestimaron el FG, con sesgo medio de +11,1 mL/min/1,73 m2 para MDRD, +16,4 mL/min/1,73 m2 para CKD-EPI de 2009, +15 mL/min/1,73 m2 para CKD-EPI con cistatina C and +14,1 mL/min/1,73 m2 para CKD-EPI con creatinina y cistatina C de 2012. Las estimaciones con MDRD y CKD-EPI de 2009 se correlacionaron mejor con 51Cr-EDTA que CKD-EPI con creatinina y/o cistatina C. Las sobrestimaciones se correlacionaron negativamente con los niveles de creatinina y cistatina C, siendo más importantes para CKD-EPI con creatinina y/o cistatina C cuando el FG fue mayor de 60 mL/min/1,73 m2.
ConclusionesLas ecuaciones CKD-EPI de 2012 con creatinina y/o cistatina C sobrestiman el FG de forma muy marcada en estadios 1 y 2 de la enfermedad renal crónica, por lo que en ellos sería recomendable emplear la ecuación MDRD. La técnica de referencia empleada para medir el FG parece tener una influencia muy importante en el sesgo de las ecuaciones.
The estimation of glomerular filtration rate (GFR) is essential to evaluate kidney function in patients with kidney transplant. The use of exogenous markers as inulin, iothalamate, 99mTc-DTPA or 51Cr-EDTA to directly measure GFR in kidney transplant show that about 40-72% have a GFR < 60 mL/min/1.73 m2.1–3 These techniques are expensive and not always available for monitorization of kidney function. This is the reason why different formulas have been developed to estimate with sufficient precision the kidney function in patients with chronic kidney disease (CKD) and in kidney transplant patient. The markers chosen to develop these equations have been serum creatinine and cystatin C ; the serum concentration of these substances may be modified by factors other than GFR in kidney transplant patients.4,5
The CKD-EPI equations using creatinine values were developed to reduce the systematic underestimation that occurred in the GFR with the MDRD study equation when applied to younger population, female sex and lower serum creatinine levels.6,7 In the development of the CKD-EPI equation in 2009, patients with higher GFR values were included, which allowed improving the estimates with respect to the MDRD equation.6,8 This improvement is mainly due to the categorization of the population into 4 different groups, which are represented by 4 equations that use the same variables, but with different exponents for a given serum value of creatinine depending on whether they are greater or lower than 0.7 mg/dL in women and 0.9 mg/dL in men. In 2012, the same group of researchers tried to improve the predictions of the equations by incorporating cystatin C as a second marker of the GFR, observing a slight improvement in its predictive capacity).9 However, the authors themselves concluded that the equations with cystatin C and creatinine should not be used routinely but rather to confirm the existence of kidney failure.
The studies that have analyzed the validity of the MDRD and CKD-EPI equations of 2009 in kidney transplant patients have obtained not uniform results, some found a lower bias using CKD-EPI with respect to direct GFR measurement, while others continue to observe a greater overestimation of the GFR with this CKD-EPI equation,1–3,10,11 and less biases with the use of MDRD formula.1 It has been observed that the CKD-EPI equation from 2012, has less bias that the MDRD.12–14 In addition it was demonstrated that this estimation of GFR in transplanted patients correlated with different risk factors.15
The objective of the present study is to analyze the degree of agreement between the estimated GFR using the MDRD, CKD-EPI equations 2009 and the new equations CKD-EPI 2012 and the GFR measured by the plasma clearance of 51Cr-EDTA in kidney transplant patients in a stable clinical condition.
Material and methodsThis is a retrospective study that included kidney transplant patients from the Kidney Transplant Unit of the Regional University Hospital "Virgen de las Nieves" in Granada. Patients were over 18 years of age, with stable kidney function and had a measurement of the GFR one year after transplantation. Of the 556 available measurements, those who had simultaneous determinations of serum creatinine and cystatin C were selected; only one determination per patient was included in the study. Therefore, for the analysis we finally have 270 GFR measurements with 51Cr-EDTA.
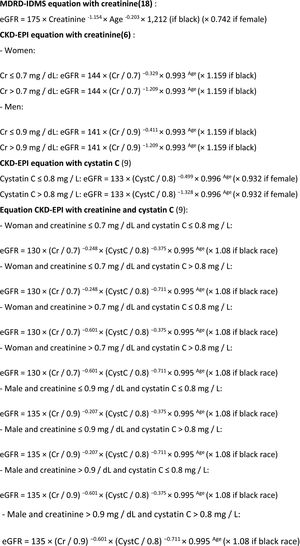
The measurement of GFR using the plasma clearance of 51Cr-EDTA (mGFR) was performed by the Nuclear Medicine Service. After a single injection of a standardized dose of the tracer, blood was drawn at 120 and 240 min, and the GFR was calculated according to the technique used by Bröchner-Mortensen.16 The values obtained were corrected for the body surface using the DuBois and DuBois formula.17 The supplementary information (appendix 1) shows the equations used to calculate the GFR (eGFR) : MDRD4 2006 traceable to IDMS (eGFR MDRD-IDMS),18 CKD-EPI of creatinine 2009 (eGFR CKD-EPI-Cr)6 and CKD-EPI with creatinine and cystatin C from 2012 (eGFR CKD-EPI-CystC and CKD-EPI-Cr + CystC).9
The values of serum creatinine and cystatin C obtained on a date coinciding with the measurement of GFR 51Cr-EDTA were recorded. Serum Creatinine was measured using the Jaffé technique compensated with traceability to IDMS (Beckman Coulter AU5832 autoanalyzer). For a concentration of 0.78 mg/dL the coefficient of variation was 3.1%, for 1.84 mg/dL of 2.2% and for 6.6 mg/dL it was 2.3%. cystatin C was measured by nephelometry (Immage 800 by Beckman Coulter) with coefficient of variation intraassay < 1.2% and interassay < 3.25%. This autoanalyzer uses Trimero Diagnostic reagent with traceability to the certified European material ERM-DA471/IFCC (Institute for Reference Materials and Measurements, IRMM).
In relation to the statistical analysis; first, it was analyzed, whether there was a normal distributions of the values using the Kolmogorov-Smirnov test for the mGFR variables and the different eGFRs. The mGFR and eGFR-MDRD-IDMS values followed a normal distribution while the eGFR values with all the CKD-EPI equations did not. Therefore, Wilcoxon Test was used to compare of means of paired samples and the Spearman correlation analysis for the degree of relationship between 2 quantitative variables. An analysis using multiple linear regression analysis was conducted where the mGFR was the dependent variable and the independent variables were: sex, age, serum creatinine and cystatin C values to explain the degree of the variance of mGFR with the variables introduced. The values were analyzed with or without logarithmic transformation as was done in the design of the original equations of MDRD and CKD-EPI. A p < 0.05 was considered statistically significant. Statistical analysis was performed using SPSS version 22 program.
The accuracy of the estimates was expressed by absolute bias, mean square error (root mean square error, RMSE) and with the values P30 and P10. The absolute bias was calculated as the arithmetic mean of the differences between eGFR and mGFR. Since the differences may result to be positive or negative, the deviation between the two measures may not properly reflect the bias, thus we also calculated the RMSE done as follows: first the differences between eGFR and mGFR were calculated, then the resulting value was squared transformed, the values were added, the arithmetic mean was obtained and finally its square root is calculated. The standard deviation of these squared differences were also calculated. The P30 and P10 values were calculated as the percentage of patients whose eGFR value was included in the 30% or 10% above or below the mGFR reference value. The precision was estimated by the standard deviation of the absolute bias, with the square root of the mean square deviation and with the interquartile range of the bias. The interquartile range was obtained by subtracting third quartile and first quartile of the absolute bias values. Finally, we calculated the values of sensitivity, specificity, negative predictive value, positive predictive value and degree of concordance (kappa) for detection of a GFR < 60 mL/min/1.73 m2 with eGFR equations.
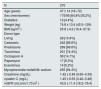
ResultsThere were 270 patients included in the study and each patient had the measurement GFR using 51Cr-EDTA. Table 1 shows the epidemiological data, the serum creatinine and cystatin C values and the mGFR of the study population. A 99.6% of patients were on prednisone (3.5−5 mg/day in 95% of the cases) when the GFR was measured. Most patients had received cadaveric graft (89.6%).
Characteristics of the population studied.
| N | 270 |
|---|---|
| Age (years) | 47 ± 14 (18–72) |
| Sex (men/women) | 175/95 [64.8%/35.2%] |
| Diabetics | 12 [4.4%] |
| Weight (kg) | 74.8 ± 13.4 (42.5–129) |
| BMI (kg/m2 ) | 25.6 ± 4.2 (16.4–37.9) |
| Donor type | |
| Living | 28 [10.4%] |
| Cadaveric | 242 [89.6%] |
| Prednisone | 269 [99.6%] |
| Tacrolimus | 201 [74.4%] |
| Ciclosporin A | 38 [14.1%] |
| Rapamycin | 17 [6.3%] |
| Everolimus | 14 [5.2%] |
| Mycophenolate mofetil/M. sodium | 255 [94.4%] |
| Creatinine (mg/dL) | 1.42 ± 0.46 (0.60–4.33) |
| cystatin C (mg/L) | 1.45 ± 0.53 (0.42–3.48) |
| mGFR (mL/min/1.73 m2 ) | 43.0 ± 11.4 (18.2–79.4) |
BMI: body mass index.
Continuous numerical variables are presented as mean ± standard deviation and the ranges are shown within parentheses. Qualitative variables are presented in absolute count and in brackets the relative frequencies.
The mGFR (log) correlated significantly with the serum creatinine values (r = -0.64, p < 0.001), Fig. 1-A. It is observed that the values of mGFR were higher in men, and degree of correlation was also greater in male than females (males r = -0.75, p < 0.001; women r = 0.58, p < 0.001). The mGFR (log) also correlated with cystatin C levels although the r value lower than with Creatinine (r = −0.52, p < 0.001), and it there was not a difference between males and females (Fig. 1- B).
 (plasma clearance of 51Cr-EDTA), with values of creatinine (A) and cystatin C (B). Both sexes are shown separately. mGFR is expressed as logarithm.")
Generation of linear regression models for mGFR as dependent variable using as predictive variables: sex, age, creatinine and cystatin C as in the formulas published for CKD-EPI of 2009 and 2012 show multiple correlation coefficients about 0.73 (p < 0.001) with adjusted R2 values of 0.52. Therefore, in our kidney transplanted population, only half of the GFR variability measured with the plasma clearance of 51Cr-EDTA is explained by regression models that use these variables.
Comparison of mGFR with eGFR MDRD-IDMS and CKD-EPI-CrThe estimated eGFR using the MDRD-IDMS and CKD-EPI-Cr equations was significantly higher (p < 0.001) than the mGFR (Table 2). The degree of correlation of eGFR obtained by the two methods and mGFR was similar, and the dispersion of values appear to be very similar (Fig. 2 A,B).
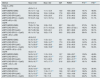
Performance of the equations for estimation of glomerular filtration rate in kidney transplants patients. Comparison with the measured GFR using the plasma clearance of 51Cr-EDTA.
| Method | Mean ± SD | Bias ± SD | IQR | RMSE | P10(d) | P30(d) |
|---|---|---|---|---|---|---|
| Total (n = 270) : | ||||||
| mGFR | 43.0 ± 11.4 | |||||
| eGFR (MDRD-IDMS) | 54.1 ± 17.1 (a) | 11.1 ± 12.4 | 13.6 | 16.6 ± 28.8 | 16.7% | 48.5% |
| eGFR (CKD-EPI-Cr) | 59.3 ± 20.0 (a) | 16.4 ± 14.8 (a) | 17.8 | 22.0 ± 28.8 | 14,8% | 43.3% |
| eGFR (CKD-EPI-CystC) | 58.0 ± 26.9 (a) | 15.0 ± 23.5 | 27.6 | 27.9 ± 40.2 | 23,0% | 51.9% |
| eGFR (CKD-EPI-Cr + CystC) | 57.2 ± 21.4 (a) | 14.1 ± 16.7 (c | 21.4 | 21.9 ± 29.2 | 20.4% | 51.1% |
| mGFR ≥ 60 (n = 22) | ||||||
| mGFR | 67.0 ± 5.1 | |||||
| eGFR (MDRD-IDMS) | 79.8 ± 15.7 (b) | 12.8 ± 15.0 | 22.7 | 19.4 ± 23.1 | 27,3% | 59.1% |
| eGFR (CKD-EPI-Cr) | 88.7 ± 16.2 (a) | 21.7 ± 15.2 (a) | 23.4 | 26.3 ± 27.2(c ) | 18.2% | 45,5% |
| eGFR (CKD-EPI-CystC) | 83.7 ± 26.0 (b) | 16.5 ± 24.1 | 41.5 | 28.7 ± 36.8 | 40.9% | 59.1% |
| eGFR (CKD-EPI-Cr + CystC) | 85.1 ± 19.7 (a) | 18.2 ± 17.8 | 30.5 | 25.2 ± 29.6 | 36.4% | 59.1% |
| mGFR < 60 (n = 248) | ||||||
| mGFR | 40.9 ± 9.2 | |||||
| eGFR (MDRD-IDMS) | 51.9 ± 15.4(a) | 11.0 ± 12.1 | 13.1 | 16.4 ± 23.1 | 15.7% | 47.6% |
| eGFR (CKD-EPI-Cr) | 56.7 ± 18.2(a) | 15.9 ± 14.7(a) | 17.3 | 21.6 ± 28.9 | 14.5% | 43.1% |
| eGFR (CKD-EPI-CystC) | 55.7 ± 25.8(a) | 14.8 ± 23.5 | 26.4 | 27.8 ± 40.5 | 21.4% | 51.2% |
| eGFR (CKD-EPI-Cr + CystC) | 54.7 ± 19.8(a) | 13.8 ± 16.6(c) | 20.9 | 21.6 ± 29.2 | 19% | 50.4% |
| 30 ≤ mGFR < 60 (n = 215) | ||||||
| mGFR | 43.2 ± 7.3 | |||||
| eGFR (MDRD-IDMS) | 54.5 ± 14.3(a) | 11.3 ± 12.4 | 13.7 | 16.8 ± 23.7 | 15.8% | 48.8% |
| eGFR (CKD-EPI-Cr) | 59.8 ± 17.0(a) | 16.6 ± 15.1(a) | 17.3 | 22.4 ± 29.6(c) | 14% | 42.8% |
| eGFR (CKD-EPI-CystC) | 59.5 ± 25.5(a) | 16.1 ± 24.5 | 27.7 | 29.3 ± 41.7(c) | 21,9% | 50.2% |
| eGFR (CKD-EPI-Cr + CystC) | 58.0 ± 18.7(a) | 14.7 ± 17.1(b) | 21.6 | 22.5 ± 30.0(c) | 18.1% | 49.8% |
| mGFR < 30 (n = 33) | ||||||
| mGFR | 25.7 ± 3.6 | |||||
| eGFR (MDRD-IDMS) | 34.9 ± 10.6(a) | 9.2 ± 9.6 | 11.6 | 13.2 ± 17.1 | 15.2% | 39.4% |
| eGFR (CKD-EPI-Cr) | 36.9 ± 12.1(a) | 11.2 ± 11.1(a) | 12.6 | 15.7 ± 20.2(c) | 18.2% | 45,5% |
| eGFR (CKD-EPI-CystC) | 32.7 ± 13.2(b) | 7.0 ± 13.5 | 18.7 | 15.0 ± 19.8 | 18.2% | 57.6% |
| eGFR (CKD-EPI-Cr + CystC) | 33.3 ± 11.5(b) | 7.6 ± 11.3 | 13.5 | 13.4 ± 13.4 | 24.2% | 54.5% |
mGFR: GFR measured with 51Cr-EDTA; Bias: eGFR – mGFR. ; eGFR: GFR estimated with equation; Values are expressed in mL/min/1.73 m2, SD: Standard Deviation; IQR: interquartile range, RMSE: root mean square error or mean square error. P10 or P30: percentage of patients included in a range of 10% or 30% of the value of measured mGFR.
 The relationship between the estimated glomerular filtration rate (eGFR) with the MDRD-IDMS and the measured glomerular filtration rate (mGFR) using plasma clearance of 51Cr-EDTA. (B ) The relationship between the estimated glomerular filtration rate (eGFR) with the CKD-EPI-Cr and the measured glomerular filtration rate (mGFR) using plasma clearance of 51Cr-EDTA.")
(A) The relationship between the estimated glomerular filtration rate (eGFR) with the MDRD-IDMS and the measured glomerular filtration rate (mGFR) using plasma clearance of 51Cr-EDTA. (B ) The relationship between the estimated glomerular filtration rate (eGFR) with the CKD-EPI-Cr and the measured glomerular filtration rate (mGFR) using plasma clearance of 51Cr-EDTA.
The absolute bias of eGFR CKD-EPI-Cr was higher than the bias obtained with MDRD-IDMS in the entire group and in each of the subgroups considering the stages of CKD. Bias of eGFR CKD-EPI-Cr was considerable in the group with mGFR ≥60 mL/min/1.73 m2 which became almost 9 mL/min/1.73 m2 higher than the MDRD-IDMS. Considering RMSE, note that with MDRD-IDMS the values obtained were the lowest for all CKD stages.
The degree of overestimation of the GFR obtained with the equation eGFR MDRD-IDMS and CKD-EPI-Cr was not related to the mGFR value of (Fig. 3 A and Fig. 4 A). However, the overestimation was significantly correlated with the estimated value of eGFR MDRD-IDMS and CKD-EPI-Cr (r = 0.75 and r = 0.83 respectively (Fig. 3B and Fig. 4B)
 The relationship between the bias of estimated glomerular filtration rate (eGFR) with the MDRD-IDMS equation (eGFRMDRD-IDMS minus mGFR 51Cr-EDTA) and the mGFR using plasma clearance of 51Cr-EDTA. (B) The relationship between the bias of estimated glomerular filtration rate (eGFR) with the MDRD-IDMS (eGFRMDRD-IDMS minus mGFR 51Cr-EDTA) and the estimated values of eGFR MDRD-IDMS.")
(A) The relationship between the bias of estimated glomerular filtration rate (eGFR) with the MDRD-IDMS equation (eGFRMDRD-IDMS minus mGFR 51Cr-EDTA) and the mGFR using plasma clearance of 51Cr-EDTA. (B) The relationship between the bias of estimated glomerular filtration rate (eGFR) with the MDRD-IDMS (eGFRMDRD-IDMS minus mGFR 51Cr-EDTA) and the estimated values of eGFR MDRD-IDMS.
 The relationship between the bias of estimated glomerular filtration rate (eGFR)with the CKD-EPI-Cr equation (eGFR CKD-EPI-Cr minus mGFR 51Cr-EDTA) and the measured glomerular filtration rate mGFR by 51Cr-EDTA. (B) The relationship between the bias of estimated glomerular filtration rate (eGFR)with the CKD-EPI-Cr equation (eGFR CKD-EPI-Cr minus mGFR 51Cr-EDTA) and the estimated values eGFR CKD-EPI-Cr.")
(A) The relationship between the bias of estimated glomerular filtration rate (eGFR)with the CKD-EPI-Cr equation (eGFR CKD-EPI-Cr minus mGFR 51Cr-EDTA) and the measured glomerular filtration rate mGFR by 51Cr-EDTA. (B) The relationship between the bias of estimated glomerular filtration rate (eGFR)with the CKD-EPI-Cr equation (eGFR CKD-EPI-Cr minus mGFR 51Cr-EDTA) and the estimated values eGFR CKD-EPI-Cr.
The values of eGFR with CKD-EPI-CystC and CKD-EPI-Cr + CystC were greater (p < 0.001) than the mGFR (Table 2), being also greater than eGFR MDRD-IDMS globally. In CKD stage 4 the bias was inferior than that of MDRD-IDMS and higher in the other stages.
The bias of eGFR CKD-EPI-CystC and CKD-EPI-Cr + CystC was lower than CKD-EPI-Cr for all stages of CKD. The bias of eGFR CKD-EPI-CystC had a greater dispersion of values as compared with CKD-EPI-Cr + CystC and with the rest of the eGFR equations. Fig. 5 shows the relationship between eGFR CKD-EPI-CystC and mGFR (A) and CKD-EPI-CystC shown CystC + Cr and mGFR (B) with correlation coefficients of 0.49 and 0.64, respectively. Some values of eGFR predicted with the CKD-EPI-CystC equation were excessively high with respect to mGFR.
 Relationship between the estimated glomerular filtration rate (eGFR) with the CKD-EPI-CystC equation and the measured glomerular filtration rate (mGFR) using the plasma clearance of 51Cr-EDTA. (B) Relationship between the estimated glomerular filtration rate (eGFR) with the the CKD-EPI-Cr + CystC equation and the measured glomerular filtration rate (mGFR) using the plasma clearance of 51Cr-EDTA.")
(A) Relationship between the estimated glomerular filtration rate (eGFR) with the CKD-EPI-CystC equation and the measured glomerular filtration rate (mGFR) using the plasma clearance of 51Cr-EDTA. (B) Relationship between the estimated glomerular filtration rate (eGFR) with the the CKD-EPI-Cr + CystC equation and the measured glomerular filtration rate (mGFR) using the plasma clearance of 51Cr-EDTA.
The RMSE values were higher with CKD-EPI-CystC than those obtained with the other 3 equations globally, except in CKD stage 4 that was similar to eGFR CKD-EPI-Cr. The RMSE value CKD-EPI-CystC + Cr was higher than MDRD-IDMS in all CKD stages except 4. Interquartile range of eGFR MDRD-IDMS bias was the smallest in all stages of CKD.
The bias of eGFR CKD-EPI-CystC did not correlate with the mGFR value ( Fig. 6A) but did show a strong correlation (r = 0.91) with the eGFR CKD-EPI-CystC (Fig. 6B). The bias of the eGFR CKD-EPI-Cr + CystC did not correlate with mGFR (Fig. 7A) but it highly correlated with eGFR CKD-EPI-Cr + CystC (r = 0.85) (Fig. 7B). With both equations there were important overestimations as compared with mGFR that became even more than 80 mL/min/1.73 m2 with CKD-EPI-CystC and above 70 mL/min/1.73 m2 with CKD- EPI-Cr + CystC).
 with the CKD-EPI-CystC equation (eGFR KD-EPI-CystC minus the mGFR using the plasma clearance of 51Cr-EDTA), (A) versus the mGFR by 51Cr-EDTA clearance and B) versus the estimated eGFR CKD-EPI-CystC values.")
 with the CKD-EPI-CR + CystC equation (eGFR KD-EPI-CR + CystC minus the mGFR using the plasma clearance of 51Cr-EDTA), (A) versus the mGFR by 51Cr-EDTA clearance and B) versus the estimated eGFR CKD-EPI- Cr + CystC values.")
The relationship between bias of estimated glomerular filtration rate (eGFR) with the CKD-EPI-CR + CystC equation (eGFR KD-EPI-CR + CystC minus the mGFR using the plasma clearance of 51Cr-EDTA), (A) versus the mGFR by 51Cr-EDTA clearance and B) versus the estimated eGFR CKD-EPI- Cr + CystC values.
A mGFR < 60 mL/min/1.73 m2 was observed in 91.9% of the transplanted patients, while with MDRD-IDMS and CKD-EPI-Cr it was found in 67% and 56.3% respectively and with CKD-EPI-CystC and CKD-EPI-CystC + Cr in in 61.1% and 57.8% respectively. Table 2 show the precision values of P10 and P30 for the four equations of eGFR. The P30 values were similar for MDRD-IDMS, CKD-EPI-CystC and CKD-EPI-Cr + CystC and were greater than CKD-EPI-Cr in stages 1 + 2 and stage 3, while in stage 4 the P30 values were higher for CKD-EPI-CystC and CKD-EPI-Cr + CystC. The P10 values were higher with CKD-EPI-CystC and CKD-EPI-Cr + CystC in virtually all stages as compared with MDRD-IDMS and CKD-EPI-Cr.
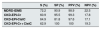
As far as ability to detect an GFR < 60 mL/min/1.73 m2 it was noted that MDRD-IDMS shows most sensitivity (Table 3) with a specificity somewhat lower than CKD-EPI-Cr + CystC. The positive predictive value was similar in all equations, while the negative predictive value was slightly higher with MDRD-IDMS.
Sensitivity (S), specificity (SP), positive predictive value (PPV) and negative predictive value (NPV) of the different eGFR estimation equations to detect GFR < 60 mL/min/1, 73 m2 measured with the plasma clearance of 51Cr-EDTA.
| S (%) | SP (%) | PPV (%) | NPV (%) | |
|---|---|---|---|---|
| MDRD-IDMS | 72.2 | 90.9 | 98.9 | 22.5 |
| CKD-EPI-Cr | 60.9 | 95.5 | 99.3 | 17.8 |
| CKD-EPI-CistC | 64.9 | 81.8 | 97.6 | 17.1 |
| CKD-EPI-Cr + CistC | 62.9 | 100 | 100 | 19.3 |
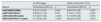
Table 4 shows the degree of concordance of the equations of eGFR in the classification of all stages of CKD and in assessment of GFR < 60 mL/min/1.73 m2. The coefficients kappa were low for all equations, the highest coefficient corresponded to the MDRD-IDMS equation followed by CKD-EPI-Cr + CystC. The coefficients were somewhat higher in the assessment of patients with mGFR < 60 mL/min/1.73 m2.
Coefficients kappa of concordance in the staging of chronic kidney disease (CKD) using different eGFR equations: MDRD-IDMS, CKD-EPI-Cr, CKD-EPI-CistC and CKD-EPI-Cr + CystC in relation to the glomerular filtration measured with the plasma clearance of 51Cr-EDTA.
| All CKD stages | mGFR < 60 mL/min/1.73 m2 | |||
|---|---|---|---|---|
| Method | Concordance (95% CI) | p | Concordance (95% CI) | p |
| eGFR (MDRD-IDMS) | 0.23 (0.13; 0.33) | 0.002 | 0.26 (0.16; 0.36) | < 0.001 |
| eGFR (CKD-EPI-Cr) | 0.08 (0.01; 0.16) | 0,012 | 0.19 (0.11; 0.27) | < 0.001 |
| eGFR (CKD-EPI-CystC) | 0.15 (0.07; 0.23) | < 0.001 | 0.17 (0.08; 0.26) | < 0.001 |
| eGFR (CKD-EPI-Cr + CystC) | 0.17 (0.09; 0.25) | < 0.001 | 0.22 (0.14; 0.30) | < 0.001 |
The low concordance was mainly due to a change in classification of patients from stages 2, 3 and 4 with mGFR to stages 1, 2 and 3 with the eGFR equations (Fig. 8). The percent of patients misclassified were low for MDRD-IDMS in stages 2 and 3 and higher in stage 4; misclassification was lower for the stage 4 with CKD-EPI-Cr + CystC and CKD-EPI-CystC. Fig. 9 shows the percentage of correct classification of CKD stages 2, 3 and 4 using the four eGFR equations; MDRD-IDMS classified more patients correctly in stages 2 and 3 and that CKD-EPI-Cr + CistC or CKD-EPI-CistC were more efficient for the classification of patients in stage 4.


Serum creatinine (Cr) is the main marker of kidney function (GFR) being used in daily clinical practice. But, the relationship between serum Cr and GFR is not as close as one would expect, especially in kidney transplants. In our kidney transplant patients after one year of follow up, only about 50% of the change in mGFR could be predicted by serum creatinine, cystatin C, sex and age, indicating that there are other very influential beyond our control variables. The same problem arises with the different equations to estimate GFR published in the literature. One point has to be taken into consideration, in kidney transplants the serum creatinine levels have a different relationship with GFR than in non-transplanted patients, which causes a overestimation of the actual kidney function calculated with these equations.8,10
Steroids modify the serum creatinine/muscle mass ratio and may cause a discrepancy between serum Cr levels and kidney function, however other factors may be involved. Some studies indicate that in patients not taking steroids there is less overestimation of GFR however this effect is not that evident with time after transplantation.4 Other authors have failed to show an effect of steroids1,14 and some authors consider that the low dose of steroids used in long-term patients should not have an effect on serum creatinine/muscle mass ratio.2 In our study, most patients were on a very low doses of prednisone, so we could not analyze a discrepancy between serum creatinine values and the GFR.
cystatin C is potentially a better marker than creatinine for assessment of GFR because it is less influenced by age, gender, race, body weight or muscle mass. In our case, the correlation of mGFR with cystatin C was lower than with creatinine, but it was observed that with cystatin C the differences related to sex were corrected (Fig. 1B). Also it has been reported that cystatin C levels can be discretely raised by high doses o of steroids, without a true change in GFR.4,14 The use of trimetroprim may affect the calculation of GFR although it would have less impact on long-term stable transplantation.3 Thyroid hormones may decrease serum creatinine levels and raise cystatin C levels; most transplant patients should not have thyroid pathology, so the overall impact must be low.5
Since the arrival of the MDRD-IDMS equation, several equations have been published by the CKD-EPI group to trying to improve the estimation of the GFR. Publications on the performance of these equation show nonuniform results.. Stevens et al.19 evaluated in kidney transplants of the CKD-EPI equation of 2009, observing that the overall bias was lower with CKD-EPI than with MDRD-IDMS formulas, with small differences between transplanted and non-transplanted, which was considered of low impact. However, the graphics revealed that at for a GFR ≥ 60 mL/min/1.73 m2, the overestimation with CKD-EPI is greater than 10 mL/min/1.73 m2, which is more bias than with MDRD-IDMS equation. For GFR < 60 mL/min/1.73 m2, the bias is marginal and similar for both equations. In patients with a body mass index lower than 20 kg/m2, all the equations performed poorly, so it was suggested using body weight to improve predictions.8 Therefore, in this study there were doubts about whether it was convenient the application of the CKD-EPI-Cr equation in kidney transplant patients with high GFR. Subsequent comparative studies in kidney transplant recipients also found greater precision and less bias with CKD-EPI-Cr than with MDRD-IDMS20–23 with a few studies supporting it.11 In 2012 Inker et al.9 published the new CKD-EPI equations that included creatinine and cystatin C; the kidney transplanted population was not included because they had many other not well defined factors that may affect the results.
Our study observed a significant overestimation of GFR in kidney transplants patients using the MDRD-IDMS and the CKD-EPI equations of 2009 and 2012 as compared with the GFR measured as the plasma clearance with 51Cr-EDTA. The average bias for MDRD-IDMS was 11.1 mL/min/1.73 m2 followed by 14.1 mL/min/1.73 m2 for CKD- EPI-Cr + CystC, and it was greater for the other equations. The bias obtained in our study is greater than the observed in previous studies in kidney transplant patients which varied for CKD-EPI-Cr from −4.5–8.1 mL/min/1.73 m210,11,20 although others reached values similar to ours. With the new 2012 CKD-EPI equations, Masson et al.12 found in kidney transplants a bias of −0.54 mL/min/1.73 m2 for CKD-EPI-Cr + CystC and −2.82 mL/min/1.73 m2 for CKD-EPI-CystC, which is less bias than MDRD-IDMS and CKD-EPI-Cr. However, Keddis et al.15 observed a bias of −5 mL/min/1.73 m2 and −8.7 mL/min/1.73 m2, for CKD-EPI-Cr + CystC and CKD-EPI-CystC respectively and −1.9 for MDRD-IDMS. Kukla et al.14 found a bias of +9 mL/min/1.73 m2 for CKD-EPI-Cr + CystC, +8.6 mL/min/1.73 m2 for CKD-EPI-CystC and 6.4 mL/min/1.73 m2 for MDRD-IDMS. This result of a lower bias for MDRD-IDMS is similar to the results reported in the present article.
In the present article, the bias observed correlated with the estimated value obtained with all the equations as shown in Figs. 3,4,6 and 7, being particularly striking with the equations CKD-EPI-CystC and CKD-EPI -Cr + CystC. The bias observed did not correlate with the mGFR obtained with plasma clearance of 51Cr-EDTA. The use of the cystatin C equations in our study overestimated kidney function in patients with higher GFR, so reducing the percentage of patients correctly classified as seen in g¡fgures 8 and 9. In these patients the use of the MDRD-IDMS equation could be more reliable since it is more conservative.1,22,24
The differences observed in the biases between different series are usually attributed to the demographic variable itself and to possible differences in the techniques of measurement of creatinine and cystatin C if they are not standardized, putting little emphasis on the method used to measure the GFR or the fact that they are kidney transplanted patients.3 In a study that compared the bias in a healthy population (kidney donors) with a population of transplanted patients with renal insufficiency, it was observed that age greatly influenced the degree of bias, with kidney transplants always less than healthy individuals.21
Published studies on kidney transplants have used different techniques for measuring GFR: plasma clearance of inulin, iohexol, iothalamate, or plasma clearance of 51Cr-EDTA or 99mTc-DTPA that although they exhibit a correlation coefficients exceeding 0.9 with respect to the renal clearance of inulin as standard, each technique has its own bias. Thus, it is somewhat difficult to compare results from different studies with different methodologies and conclusions are not easy to obtain.3 For example, GFR values obtained with the renal clearance of inulin are low. Plasma clearance of 99mTc-DTPA or 51Cr-EDTA provides higher values of GFR than the inulin renal clearance.25 In the work of Inker et al.9 the equations were developed using urinary or plasma clearance of iothalamate and for validation it was used a population in which a wide variety of methods were used to measure GFR, so the biases found are an average of what one would expect when comparing populations with different techniques. To validate the equation CKD-EPI-Cr + CystC, Masson et al.12 used urinary clearance of inulin while Keddis et al.15 and Meeusen et al.13 used iothalamate clearance. The population of Keddis and Meeusen had a similar average GFR, with similar sex ratio and average age (they come in part from the same data source, Mayo Clinic Foundation). The population of Masson et al.12 had were relatively young with a higher proportion of men and patients with < 15 mL/min/1.73 m2 were excluded; and despite of this in their series the average GFR was 5 mL/min/1.73 m2 lower for similar values of creatinine and cystatin C. Our population was younger, proportion of men was similar, somewhat lower serum levels of creatinine and cystatin C despite of which we obtained a GFR 7-12 mL/min/1.73 m 2 lower than the other series, using the plasma clearance of 51Cr-EDTA to measure GFR. This could explain that our biases were greater than in these mentioned series and that were similar to those observed in other studies.19,26
The bias as an adjustment parameter of 2 techniques just calculates the differences between the 2 measurements, and arithmetic mean was then calculated. Linear regression generates an equation seeking to minimize residuals. Large positive differences will be canceled by large negative differences, with the appearance that both techniques fit very well if the bias obtained is close to zero. However, considering the standard deviation or the interquartile range of bias, the impact of these large differences on the overall adjustment are better described: the greater the bias deviation, the greater the mistake made in many individuals. The standard deviation of the bias obtained by the different studies ranges fom 10–20 mL/min/1.73 m2, similar to the data obtained in our study and the analysis of the Bland-Altman graphs of the different studies reveals that there is a large dispersion in the differences of the individual data. Figs. 3,4,6,7 shows that for a specific eGFR value from each equation the error made grows significantly in patients with GFR > 60 mL/min/1.73 m2, reaching differences of more than 80–100 mL/min/1.73 m2 for equations using cystatin C. The study by Inker et al.9 also mentioned that the equation that only includes cystatin C provides worse results than if used with creatinine.
Some authors prefer to use of the values of mean square deviation or RMSE to compare different equations, because they better reflect individual differences by computing all differences as positive and averaging them. In our study, with MDRD-IDMS there were obtained lower RMSE values that were similar to the other equations in patients with stage 4 CKD.
The accuracy values P30 and P10 observed in our population were much lower for all the equations than those observed in other series, being less than 40.9% and 59.1% respectively. In other series, values of 77–84 % are found when moving from MDRD-IDMS to CKD-EPI1,11 and they increase from 80.4%–86.5% when moving from MDRD-IDMS to CKD-EPI-Cr + CystC.15 Inker et al.9 found P30 values that improved discreetly from 87.2% with CKD-EPI-Cr to 91.5% with CKD-EPI-Cr + CystC when GFR < 60 mL/min/1.73 m2 and rose from 92.2 % at 97.7% when GFR > 60 mL/min/1.73 m2. This apparent lack of performance in our population could be explained if we assume that the GFR with 51Cr-EDTA yields measurements between 5 and 10 mL/min lower than other GFR measurement techniques. In any case, in our data it seems that the degree of improvement achieved in P30 with CKD-EPI-Cr + CistC is not quantitatively important with respect to the other equations that use only creatinine.
Our study analyzed the performance of the different equations to detect a GFR < 60 mL/min/1.73 m2. It was observed that the MDRD-IDMS equation showed the highest sensitivity, while the highest specificity was obtained with the CKD-EPI-Cr + CystC equation, which is expected since the latter results in estimates greater than MDRD-IDMS and when creatinine and cystatin C levels are sufficiently elevated, the estimate for GFR are clearly below 60 mL/min/1.73 m2. Positive predictive values are similar for all equations while negative predictive values are slightly better for CKD-EPI equations.
A strong positive aspect of the present study is the measurements of GFR in all patients one year after receiving the graft, which adds homogeneity to the study population. In most series, the measurements of GFR were obtained at different times during the follow up after the kidney transplant, the relationship between muscle mass, nutritional status and steroid dose may change with time, therefore relationship between serum creatinine and the degree of function may not be the same throughout the time after the transplant. A limitation of our study is not being able to analyze the influence of the steroid dose, because the most patients were on prednisone at low doses as the maintenance treatment, although this also brings homogeneity to the population analyzed. It would be of interest to compare in patients with the same period after transplant, 2 different measurement of GFR using different techniques and evaluate the differences in the bias between the equations CKD-EPI and MDRD-IDMS and the mGFR measured by different techniques.
In summary, in the kidney transplant population the GFR estimated by the CKD-EPI equations that use serum creatinine and cystatin C as markers of kidney function, show a greater bias than the MDRD-IDMS equation and the GFR is measure by plasma clearance of 51Cr-EDTA. These equations produce a significant overestimation of the GFR if the eGFR is greater than 60 mL/min/1.73 m2, however the the error obtained is reduced below the observed with the MDRD-IDMS equation if the GFR is less than 30 mL/min/1.73 m2. The degree of precision with all the equations was low in all stages of the CKD. It is important to take into consideration the reference technique used to measure GFR in kidney transplants when analyzing the performance of the different MDRD-IDMS or CKD-EPI equations.
The technique to measure GFR may explain the discrepancies between different reports in the literature comparing the degree of precision of the different equations.
Conflict of interestsThe authors declare no conflict of interest in relation with the contents of this article.
Please cite this article as: Borrego Utiel FJ et al. Comparación de las ecuaciones MDRD y de las antiguas ecuaciones CKD-EPI frente a las nuevas ecuaciones CKD-EPI en pacientes con trasplante renal cuando se emplea 51Cr-EDTA para medir el filtrado glomerular. Nefrologia. 2020;40:53–65.


