
Background: There are gaps in the knowledge of factors which influence peritoneal potassium transport in peritoneal dialysis (PD). The aims of this study were to compare peritoneal potassium transport in PD patients undergoing 2.27% and 3.86% peritoneal equilibration tests (PET), and to disclose clinical correlates of this phenomenon. Method: Ninety PD patients underwent 2.27% and 3.86% PET, in a random order. We compared peritoneal potassium transport in both tests, and searched for correlations between D/P potassium at 240 minutes (main study variable) and PET-derived markers of peritoneal function and selected demographic, clinical and biochemical variables, using a multivariate approach. Main results: D/P potassium showed a good agreement between both PET, and presented a univariate association with creatinine transport, but not with plasma potassium, ultrafiltration or sodium dip. Age, PD modality, peritoneal glucose load, icodextrin, ACEI-ARA and calcium antagonist therapy, urinary potassium and glomerular filtration rate were other univariate correlates of potassium transport. Multivariate analysis confirmed D/P creatinine at 240 minutes (B = 0.40 [95% CI 0.26-0.53] 2.27%, B = 0.36 [0.21-0.51] 3.86%,p <0.0005) as the main predictor of D/P potassium at 240’. Urinary potassium, rather than glomerular filtration rate, sustained also an inverse correlation with the dependent variable. Treatment with ACEI-ARA was consistently associated with peritoneal potassium transport (3.86% PET) (B = 0,08 [0.04-0.12], p <0.0005). Conclusions: The 2.27% and the 3.86% PET show a good agreement at the time of estimating peritoneal potassium transport. Urinary potassium excretion and treatment with ACEI-ARA (3.86% test) show an independent association with peritoneal potassium transport rates.
Introducción: El conocimiento de los factores que determinan el transporte peritoneal de potasio en diálisis peritoneal (DP) es incompleto. Los objetivos de este estudio fueron comparar el transporte peritoneal de potasio en pruebas de equilibrio peritoneal (PEP) con soluciones de glucosa al 2,27 y al 3,86%, y desvelar factores con influencia en este fenómeno. Método: Noventa pacientes en DP fueron sometidos a PEP al 2,27 y al 3,86%, en orden aleatorio. Comparamos el transporte de potasio en ambas pruebas, buscando correlaciones del cociente D/P de potasio a 240 minutos (variable principal) con marcadores de función peritoneal durante PEP, y con diferentes variables demográficas, clínicas y bioquímicas, usando una estrategia multivariante. Resultados: El D/P de potasio presentó buena concordancia en ambas PEP, mostrando asociación univariante con el D/P de creatinina, pero no con potasio plasmático, ultrafiltración o descenso de sodio. La edad, tipo de DP, carga peritoneal de glucosa, icodextrina, tratamiento con IECA-ARA o calcioantagonistas, potasio urinario y filtrado glomerular tuvieron una correlación univariante con el transporte de potasio. En el análisis multivariante, el D/P de creatinina a 240 minutos (B = 0,40 [IC 95%: 0,26-0,53] 2,27%; B = 0,36 [0,21-0,51] 3,86%; p <0,0005) fue el predictor esencial del D/P de potasio a 240’. La excreción urinaria de potasio también tuvo una correlación inversa con la variable principal. Asimismo, el tratamiento con IECA-ARA se asoció de forma consistente con el transporte peritoneal de potasio, pero sólo en la PEP al 3,86% (B = 0,08 [0,04-0,12]; p <0,0005). Conclusiones: Las PEP al 2,27 y al 3,86% estiman de manera concordante el transporte peritoneal de potasio. Aunque el transporte de creatinina es el predictor principal del de potasio, la excreción urinaria de potasio y el tratamiento con IECA-ARA se asocian de manera independiente con el fenómeno citado.
INTRODUCTION
In clinical practice, the peritoneal equilibration test (PET) is the reference procedure for categorising peritoneal transport characteristics in patients undergoing peritoneal dialysis (PD). As such, it focuses on creatinine and glucose, but has also been modified to analyze the transport characteristics of other solutes.1 The standard PET is performed with 2.27% glucose-based dialysate, but there is increasing support for the use of the 3.86% solution, which is said to permit a more accurate assessment of the ultrafiltration (UF) and free water transport capacities.1-3 PET sessions based on either 1.36%, 2.27% or 3.86% glucose-based dialysate appear to yield similar results for creatinine, with some expected differences for other small solutes, including glucose and sodium.4,5 On the other hand, there are some gaps in our knowledge of the factors which may influence the peritoneal transport of potassium during PD. Importantly, a significant fraction of the potassium recovered from spent dialysate during a PD exchange may have a cellular origin, aside from the classic diffusive and convective pathways from the circulation.6,7 The mechanisms for cellular efflux of potassium are not clear, but local cell apoptosis, low fluid pH and cell dehydration in the presence of hypertonic dialysate may both contribute to the phenomenon.8 This situation raises the possibility that the composition of dialysate and other clinical or biochemical factors may specifically influence the peritoneal transport of potassium. The PET may represent a useful tool for approaching these questions.
We performed a study in the clinical setting to compare the potassium transport profiles in ninety PD patients who underwent PET using 2.27% and 3.86% glucose-based, lactate-buffered dialysate, as well as to disclose demographic, clinical and biochemical factors which could influence the results of potassium transport analysis in both tests.
POPULATION AND METHOD
General design
Following a prospective design, ninety PD patients underwent two PET sessions using 2.27% and 3.86% glucose-based solutions in random order. The mean delay between both tests was four months (range 0-6). We compared the saturation profiles for different low molecular weight solutes during both tests, paying particular attention to the behaviour of dialysate potassium concentration. We analysed the correlation between the observed potassium saturation profiles and selected demographic variables (age, gender, time on dialysis, PD modality, diabetes, previous peritonitis, ongoing drug therapies), and laboratory variables (diuresis, glomerular filtration rate [GFR], urinary potassium excretion, haemoglobin, plasma albumin, C-reactive protein [CRP]), PD prescription (peritoneal glucose load, use of icodextrin) and peritoneal function variables (creatinine and glucose transport rates, UF, sodium sieving).
Population
All patients from our PD Unit were eligible for the study provided they met two conditions, which were being in stable clinical condition without having experienced peritonitis or any significant events in the previous two months, and giving informed consent for participation. On the other hand, patients suffering peritonitis, haemoperitoneum or peritoneal catheter malfunction, undergoing catheter removal or who presented any significant clinical event in general during the study period were excluded from analysis.
Study protocol
PD adequacy and residual renal function were estimated for all patients during the month preceding each PET. All the PET studies followed the general protocol for these tests, with small modifications. In summary, after an overnight dwell with 2.27% dialysate, two litres of 2.27% or 3.86% dialysate were infused into the peritoneal cavity. Dialysate samples were collected according to standardised procedures at 0, 60, 90, 120 and 240 minutes. At the end of the four-hour dwell, the peritoneal cavity was drained completely. We retrieved blood samples for analysis 120 minutes after each test. All patients used conventional lactate-based dialysate made by Baxter (Deerfield, Illinois) (n = 81) or Fresenius (Heidelberg, Germany) (n = 9) laboratories.
Sample processing and secondary calculations
Sodium and potassium concentrations in plasma, dialysate and urine were estimated using an indirect ion-selective electrode method. Plasma and dialysate levels of glucose, creatinine (corrected for glucose) and albumin were determined with a standard autoanalyser. Plasma CRP was estimated by immunoturbidimetry (Roche Diag., Mannheim, Germany).
GFR was computed as the mean of renal urea and creatinine clearances. Peritoneal transport (D/P creatinine at 240 min, D/PCr-240’ ) was categorised according to the results of the 2.27% PET. D/P potassium and D/P creatinine were calculated as the ratio between dialysate potassium or creatinine concentration at any point and plasma potassium or creatinine concentration at the midpoint of the test. Sodium dip was computed as DNa-60’ – DNa-0’ glucose was calculated as the ratio of dialysate glucose concentrations at different sampling points versus baseline. UF during the test was estimated as the difference between the weights of the dialysate bag before infusion and after final drainage; UF failure was defined by an UF < 400mL during the 3.86% PET.
The main dependent variable of the study was D/P of potassium at 240 minutes (D/PK-240’). We compared the performance of this variable in the PET with 2.27% and 3.86% solution. We also searched for correlations between the main variable on the one hand and the demographic, clinical and biochemical variables examined on the other; these included the solute transport characteristics (D/PCr-240’), sodium dip and UF during the corresponding PET.
Statistical analysis
Numerical variables are presented as mean or median values (range), as appropriate. Direct comparisons between variables were made using Student’s-t tests, ANOVA (numerical variables) and chi-square distribution (categorical variables). The correlation between numerical variables was calculated according to the Spearman correlation coefficient. Agreement between numerical estimations was evaluated using Bland-Altman plots, using the paired Student’s t- test to analyse for systematic biases. Forward and stepwise multiple regression strategies were applied for multivariate analysis. We used SPSS version 16.0 for data processing.
RESULTS
Overview
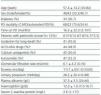
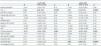
The main characteristics of the study population are presented in Table 1. Total infused dialysate volume was 6.8 ± 2.2L/day (3.5-14.5) at the time of the 2.27% solution PET and 7.0 ± 2.4L/day (3.5-15.5) at the time of the 3.86% solution PET (p=0.51). The daily peritoneal glucose loads were 87.2 ± 47.0g (27.2-233.7) and 90.4 ± 45.9g (21.2-236.0) respectively (p=0.46). With regard to the PET-related values, the observed D/PCr profiles were very similar in the 2.27% and 3.86% solution tests (not represented). The study population included 17 slow (18.9%), 63 average (70.0%) and 10 fast transporters (11.1%). Mean UF values were 131.4 ± 256.7mL (-480-600) during the 2.27% solution PET and 542.0 ± 344.5mL (-150-1300) during the 3.86% solution PET. Twenty-six patients (28.9%) met the diagnostic criteria for UF failure. Mean plasma potassium levels were 4.74 ± 0.72mM/L (2.8-6.1) during the 2.27% PET and 4.73 ± 0.62mM/L (3.5-6.1) during the 3.86% PET (p=0.70). Mean plasma glucose levels were 111.7 ± 48.6mg/dL (52-269) and 112.5 ± 48.5mg/dL (66-318) respectively (p=0.85).
Comparison of potassium transport profiles in bothPET sessions
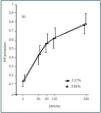
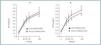
The dialysate potassium saturation profiles were very similar in the 2.27% and the 3.86% solution PET sessions (Figure 1). There was good agreement between both tests, without systematic biases, at 60 (p = 0.09), 90 (p = 0.71), 120 (p = 0.17) and 240 minutes (Figure 2).
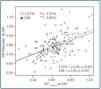
There was a marked correlation between potassium and creatinine transport in both PET sessions (Figure 3). The observed correlation between D/PK-240’ and D/D0 glucose at 240 minutes was closer during the 2.27% test (r = -0.49, p < 0.0005) than during the 3.86% test (r = -0.29, p = 0.006). At the same time, no apparent univariate correlation was observed between plasma potassium (r = -0.01, p = 0.96 2.27%, r = -0.05, p = 0.64 3.86%), UF (r = 0.13, p = 0.22 2.27%; r = 0.03, p = 0.75 3.86%) or dialysate sodium dip at 60 minutes (r = 0.02, p = 0.88 2.27%, r = 0.10, p = 0.34 3.86%) on the one hand and D/PK-240’, on the other.
Demographic, clinical and biochemical correlates of peritoneal potassium transport
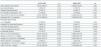
Table 2 shows the univariate correlations between D/PK-240’ as well as the different demographic, clinical and biochemical variables that were examined. There was a clear trend toward higher D/P potassium levels in patients treated with ACEI-ARA drugs (Figure 4), particularly during the 3.86% PET (Figure 4b). Mean plasma potassium levels were 4.84 ± 0.69mM/L (2.8-5.8) (ACEI-ARA) vs. 4.64 ± 0.64mM/L (3.1-6.1) (no ACEI-ARA) during the 2.27% PET (p = 0.18), and 4.89 ± 0.68 (3.5-6.1) and 4.61 ± 0.65mM/L (3.6-5.8), respectively, during the 3.86% PET (p = 0.06).
Multivariate analysis
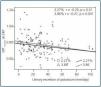
Multiple regression analysis (Table 3) identified the overall peritoneal transport category (as estimated from D/PCr-240’) as the most consistent correlate of D/PK-240’. Treatment with ACEI/ARA drugs was also a strong predictor of D/PK-240’, but only in the 3.86% PET, while a similar but non-significant trend was observed in the 2.27% PET. On the other hand, both GFR (Table 2) and urinary potassium excretion (Figure 5) showed an inverse univariate association with the main study variable. GFR remained an independent correlate of the dependent variable [B = -0.005 (95% CI -0.009, 0.000), p = 0,036 2.27% test; B = -0.005 (-0.010, 0.000), p=0,038 3.86% test] only if urinary potassium was not included in the regression model, but that variable proved to be a far more stable predictor of D/PK-240’ (Table 3).
DISCUSSION
Our results are consistent with earlier reports7,9 in that they showed overall agreement between the way the 2.27% and the 3.86% glucose-based PET estimated peritoneal potassium transport. This equivalence may be the result of the interaction of several opposing forces. Free water transport is expected to produce a slower saturation of potassium in the 3.86% test than in the 2.27% test, particularly during the first two hours of the test, but both diffusion and convection of potassium through small pores act to compensate for this effect. Moreover, other mechanisms may potentially influence potassium transport, depending on the concentration of glucose in dialysate. First, the hypertonicity and low pH of glucose-based, lactate-buffered dialysate causes peritoneal vasodilation, thus increasing solute (including potassium) transport. However, this effect appears to be non-linear, meaning that 3.86% glucose solution may not be more vasodilatory than 2.27% glucose solution.10 In fact, PET sessions for the peritoneal transport of creatinine are consistent when different glucose concentrations are used.3-5
On the other hand, cellular efflux of potassium may contribute significantly to peritoneal transport of this cation during a PD exchange.6,7 The reasons for this phenomenon are not totally clear. Local cell breakdown with release of potassium into the peritoneal cavity is a possible explanation, but recent studies8 suggest that potassium efflux from viable cells may be a more important mechanism. First, low dialysate pH could favour a proton-potassium transcellular exchange7 although this effect may be self-limited, because pH equilibrates rapidly during a PD dwell. Moreover, hypertonic glucose-based dialysate generates a high local osmolarity, which may induce peritoneal cell dehydration and secondary potassium efflux.11 If the latter were true, 3.86% dialysate would be expected to produce higher rates of potassium transport than 1.36% or 2.27% dialysate, thus counterbalancing the above-mentioned, putative opposite effect of free water transport. The reported direct correlation between the latter and potassium release from cells11 lends some support to this hypothesis. Nevertheless, this proposed mechanism deserves further clarification. For instance, hypertonic glucose-based dialysate drives insulin secretion12 which in turn could favour systemic (and peritoneal) cellular uptake of potassium, with a yet undefined impact on peritoneal potassium transport.13
A remarkable finding in our study was the observation of higher potassium transport rates in patients treated with ACEI-ARA, an effect which was particularly evident during the 3.86% solution PET (Figure 4). The effect of this family of drugs on peritoneal function and structure is still a matter of controversy. First, patients treated with ACEI-ARA may have specific comorbidity profiles, and present intrinsically higher solute transport rates since beginning PD.14 On the other hand, short-term administration of ACEI-ARA to PD patients may induce vasodilation of peritoneal vessels,15 but this effect does not appear to significantly modify peritoneal solute transport characteristics.16-18 Long-term therapy with ACEI-ARA may prevent PD-induced changes in the peritoneal membrane,19,20 resulting at least partially from these drugs’ ability to prevent fibrosis and stabilize the peritoneal vascular surface20-22. The specific effect of ACEI-ARA on potassium transport has been a subject of limited attention. A study by Rojas-Campos et al18 could not find that losartan had a significant impact on potassium transport. However, the study was a short-term one, and 2.5% glucose dialysate was used for solute transport analysis. Moreover, a non-significant trend toward a D/P potassium increase could be observed after losartan, but not after prazosin or verapamil therapy.18 In our study, the impact of ACEI-ARA therapy on potassium transport was more evident during the 3.86% (Figure 4b) than during the 2.27% PET (Figure 4a) (Table 3). Again, the explanation for this finding is not totally clear. ACEI-ARA drugs could increase potassium release by inducing apoptosis of peritoneal cells, in a similar way to what happens in other tissues,23,24 but this hypothesis is rather speculative. ACEI-ARA could also hamper general compensatory mechanisms oriented toward attenuating potassium efflux from cells, and this effect should be more evident at the peritoneal level in the presence of a stronger drive for potassium efflux (as in a 3.86% PET). Hyperkalaemia is a well-known consequence of ACEI-ARA therapy.25,26 Inhibition of renal potassium excretion is the main mechanism underlying this effect; however, in patients on dialysis with a low or absent residual renal function, antagonizing the renin-angiotensin-aldosterone axis may block compensatory mechanisms oriented toward facilitating faecal excretion and cellular uptake of potassium.27-29
GFR and urinary potassium excretion were both inverse correlates of peritoneal potassium transport, but urinary potassium showed a far more consistent association with the study variable. This latter correlation could be adequately explored because only seven patients (7.8%) were anuric at the start of our study. An inverse association between residual renal function and peritoneal potassium transport may at first seem paradoxical because decaying GFR should activate mechanisms of potassium adaptation, favouring cell uptake and consequently decreasing transcellular peritoneal transport. On the contrary, it is tempting to speculate that urinary potassium excretion may be an indirect marker of aldosterone activity, although plasma levels of this hormone were not estimated. As previously hypothesised, high aldosterone levels could favour cell potassium uptake,28 thus opposing efflux from peritoneal cells in response to dialysate acidity and hypertonicity.
Treatment with calcium antagonists showed a degree of direct association with potassium transport in the univariate analysis, but the relationship did not persist after verifying for other variables. These drugs were examined due to their ability to block calcium-dependent potassium efflux from endothelial cells.30 This type of channel has also been identified in the peritoneal mesothelium.31 In PD patients, short-term treatment with verapamil does not appear to modify peritoneal solute transport characteristics although, for unclear reasons, it can increase UF.18
In conclusion, the classic 2.27% and the modified 3.86% solution PET show good agreement for estimating D/P of potassium. Urinary potassium excretion and ongoing treatment with ACEI-ARA (3.86% PET) are independent correlates of peritoneal potassium transport rates. Further studies will be necessary to clarify the interactions between systemic mechanisms of adaptation to renal failure and the physiopathology of the peritoneal membrane during PD.

Table 1. Study population

Figure 1.

Figure 2.

Figure 3.

Table 2. Clinical correlates of potassium transport during PET. Univariate.

Table 3. Clinical correlates of potassium transport. Multivariate

Figure 4.

Figure 5.