
Objetivos: Los pacientes con insuficiencia renal presentan una prevalencia elevada de dosis inapropiadas y de concentraciones elevadas de digoxina, y se ha recomendado el ajuste de la dosificación en función de la tasa de filtración glomerular (TFG). El objetivo de nuestro estudio fue evaluar el grado de dependencia con respecto a la TFG del aclaramiento total (CL) de digoxina, y la eficiencia diagnóstica de un modelo predictivo para la concentración sérica de digoxina en el estado de equilibrio (Css) en función de la TFG estimada por la ecuación de Cockcroft-Gault. Métodos: En 400 pacientes ambulatorios tratados por vía oral con digoxina se determinaron las Css séricas (inmunoanálisis de polarización de fluorescencia, Abbott Laboratories), calculandose el CL total. La predicción de Css se hizo mediante un modelo hiperbólico desarrollado por Konishi, et al. (J Clin Pharm Ther 2002;27:257), y las constantes de la ecuación fueron modificadas para la población caucasiana. Resultados: Sólo el 26% de la variabilidad interindividual del CL de digoxina puede ser explicado por diferencias de la TFG, y este hecho constituye una seria limitación para los modelos predictivos derivados. Se obtuvo una eficiencia diagnóstica del 65% para los modelos predictivos original y modificado en la clasificación correcta de las Css predichas como subterapéuticas, terapéuticas o supraterapéuticas con respecto a las Css obtenidas. Conclusiones: La eficiencia diagnóstica obtenida en la predicción de las concentraciones séricas de digoxina en función de los valores estimados de TFG es inaceptable para el ajuste de la dosificación del fármaco en la práctica clínica.
Background: Inappropriate doses and high serum concentrations of digoxin are highly prevalent in patients with renal impairment, and the drug dosage adjustment according to the glomerular filtration rate (GFR) is recommended. The aim of our study was to evaluate the dependence degree of digoxin total clearance (CL) on GFR, and the diagnostic efficiency of a predictive model for serum digoxin steady-state concentrations (Css) from estimated GFR by Cockcroft-Gault formula. Methods: In 400 outpatients treated orally with digoxin, serum Css were determined (fluorescence polarization immunoassay from Abbott Laboratories), and total CL was calculated. The prediction of Css was carried out using a hyperbolic model developed by Konishi et al in Japan (J Clin Pharm Ther 2002;27:257), and the constants of the equation were modified for a Caucasian population. Results: Only 26% of the digoxin CL interindividual variability may be explained by differences in GFR, and this fact is a serious limitation for the derived predictive models. A 65% diagnostic efficiency was obtained for original and modified hyperbolic models in the correct classification of predicted Css as subtherapeutic, therapeutic or supratherapeutic with respect to obtained Css concentrations. Conclusions: The diagnostic efficiency obtained in the prediction of serum digoxin concentrations from estimated GFR values is unacceptable for the drug dosage adjustment in clinical practice.
INTRODUCTION
Digoxin has been used for over two centuries, and concern over its toxicity can be traced back to its introduction into therapy. However, considering its beneficial effect in reducing mortality and hospitalisation of patients with progressive heart failure, its cost-effectiveness and easy availability worldwide, digoxin should not be considered a drug of the past but rather a drug of the present and even one of the future.1
Digoxin is usually administered orally, reaching maximum serum concentrations two to three hours after administration. However, trough concentration (immediately before the next dose) is used for therapeutic monitoring, or at least once the distribution phase is complete.2 The determination of serum digoxin concentration is essential for safe and proper use of the drug, which has a narrow therapeutic index, and this is the primary cause of morbidity and mortality associated with its use. It is currently recommended that doses be set to reach serum concentrations between 0.5ng/ml and 1.1ng/ml.1,3-5 A significant fraction of the absorbed dose of digoxin is eliminated by the kidneys, with its systemic clearance being an important determinant of the maintenance dose.1,6 Renal function impairment therefore frequently causes the onset of toxic effects.1
Glomerular filtration rate (GFR) is widely accepted as an appropriate measure of renal function, and adjusting the dosage of digoxin based on GFR is widely recommended in the literature.6-11 However, recent studies suggest that inappropriate dosing of digoxin is common in patients with various degrees of renal failure.7,12 Comparative studies have been performed using conventional pharmacokinetic procedures for calculating clearance (CL) and the prediction of digoxin concentrations, estimating GFR based on cystatin C13 and creatinine using Cockcroft-Gault and MDRD (modification of diet in renal disease) formulas.13,14 This article, which employs data from 400 adult patients, indicates the Diagnostic efficiencyof a hyperbolic model for calculating digoxin concentration based on GFR.15
PATIENTS AND METHOD
We studied a group of 400 patients of both sexes (158 males and 242 females) with heart failure, with a mean age (± standard deviation of the mean [SDM]) of 78.6±0.64 years (range, 24-97 years), who were treated as outpatients in our hospital’s emergency, cardiology and internal medicine departments. All patients received digoxin orally in the form of tablets, with a dosage of 0.125mg to 0.25mg every 24 to 48 hours, which was not changed for at least 20 days before taking blood samples. The samples were taken after the distribution phase was complete, 24 to 48 hours after the last doses, which meant that digoxin levels corresponded to the steady-state minimum concentration (Css). The study was performed according to the good practice standards for human research of the Health Department of the Government of Galicia, and was approved by the Clinical Research Ethics Committee of the University Hospital Complex of Santiago de Compostela.
Serum digoxin concentration was determined by fluorescence polarisation immunoassay, using reagents from Abbott Laboratories (Abbott Park, IL, USA). Determination of serum creatinine was performed using an Advia 2400 Chemistry System (Siemens Healthcare Diagnostics Inc., Newark, NJ, USA). Cystatin C was determined by PENIA (particle enhanced nephelometric immunoassay) in a BN ProSpec nephelometer (Siemens Healthcare Diagnostics, Inc.). GFR was calculated from the serum concentrations of creatinine and cystatin C using the Cockcroft-Gault16 and de Hoeck et al17 formulas, respectively. The apparent clearance of digoxin was calculated using a conventional pharmacokinetic procedure18: CL=(dose/dosage interval)/Css, with the results expressed in ml/min. The prediction of digoxin concentration was made according to the Konishi et al hyperbolic model15: Css/D=1/(2.22CGGFR+25.7), where Css= level of digoxin (ng/ml), D= dose (µg/day) and CGGFR=GFR calculated using the Cockcroft-Gault formula (ml/min).
Statistical analysis was performed using the StatGraphics Plus (v5.0) program, using the Shapiro-Wilks test for data distribution assessment. We used the Pearson’s correlation coefficient for Gaussian distributions, and the Spearman correlation for all other distributions. Regression analysis was performed using the non-parametric Passing-Bablock method. The hyperbolic fit of the relationship between the ratio Css/dose and CGGFR was performed using the Microcalc Origin® (v8.0) program.
RESULTS
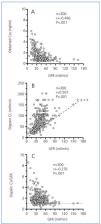
In a group of 300 study patients (120 males and 180 females) with a mean age of 79.2±0.5 years (range, 24-97 years), there were significant correlations between digoxin Css, digoxin CL, and the ratio (digoxin CL)/(GFR), with GFR as indicated in Figure 1. According to earlier studies,9,11,12 digoxin Css was inversely correlated to GFR (Figure 1A). However, although digoxin CL is significantly dependent on GFR (Figure 1B), the modest coefficient of determination (r2=0.257) between both variables indicated that only 26% of the interindividual variability of digoxin CL may be explained by changes in GFR.19 This determination coefficient was not significantly improved by a dichotomy of the data by gender, the normalisation of digoxin CL by kg of weight (ml/min/kg) or the use of MDRD equations with four or six variables for calculating GFR. Values of GFR under 70ml/min would produce an exponential increase in the relative proportion of non-renal CL, compared to the total digoxin CL (Figure 1C).
Serum concentrations of cystatin C were measured in 60 of these patients. The correlations obtained between digoxin CL and GFR calculated from creatinine (r=0.403; P<.005) and cystatin C (r=0.500; P<.005) suggest a modest improvement of the coefficient of determination between digoxin CL and GFR calculated by cystatin C.
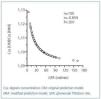
Just as Konishi et al15 developed their predictive model on a group of Japanese people, we calculated the constants for the hyperbolic equation for our group of 300 patients with an eye towards optimisation, obtaining the following expression: Css/D=1/(2.42±0.18CGGFR+29.44±4.06). Figure 2 shows the results for the group of 100 remaining patients (38 males and 62 females) with a mean age of 77.2±1.0 years (range, 24 to 92 years) for the relationship between digoxin concentrations obtained experimentally and the predicted values using the original Konishi et al model15 and the model modified for our population group of 300 patients. Digoxin concentrations predicted by the original model were on average 10% higher than those provided by the model modified for our population group (Figure 2A). The proportional difference between the concentrations predicted by each model (expressed as a ratio) showed a highly significant negative correlation with GFR (Figure 3).
We obtained modest correlation coefficients and wide dispersion between obtained digoxin concentrations and those predicted by the original (Figure 2B) and modified (Figure 2C) estimation models. The obtained concentrations and those predicted by both models showed 65% concordance in their classification as subtherapeutic, therapeutic and supratherapeutic.
DISCUSSION
Currently, the US Food and Drug Administration, the National Kidney Foundation22 and various authors20-24 recommend the use of the Cockcroft-Gault formula for calculating GFR in pharmacokinetic studies and for dosage adjustments.
Consequently, in this study, GFR calculation was performed using the Cockcroft-Gault formula,16 which is also the method used by Konishi et al15 in the development of their predictive model.
Recent studies have demonstrated that patients with varying degrees of renal failure often receive inappropriate doses of digoxin.7,12 The GFR calculation would provide better dosage adjustment for these cases.6-11 As with earlier studies,9,11,12 our patients had an inverse correlation between digoxin concentration and GFR (Figure 1A). There was a 54% prevalence of cases with improper dosages of digoxin (of which 94% had GFR<60ml/min) and with serum concentrations higher than 1.1ng/ml, which is considered the safety limit in chronic treatment.1,3-5 For this reason, it should be noted that elderly patients with renal dysfunction are particularly susceptible to high concentrations of digoxin, with increased susceptibility to cardiac toxicity, which consequently increases mortality risk.25
However, the results shown in Figure 1B indicate the poor coefficient of determination (r2=0.257) between digoxin CL and GFR, which suggests that differences in this variable would only explain 26% of the interindividual variability of digoxin CL. Although the serum concentration of cystatin C has been reported as having certain advantages over that of creatinine in calculating GFR for predicting digoxin levels,10,13 the use of cystatin C in calculating GFR did not improve in a practical way the coefficient of determination between this variable and digoxin CL. Moreover, the results shown in Figure 1C show that, for a GFR<60-70ml/min, the interindividual variability of the ratio (digoxin CL)/GFR increased significantly, with a significant increase in the relative proportion of non-renal CL compared to the total CL of the drug. These results would indicate a priori that patients with GFR<60-70ml/min have clearly limiting factors for correctly predicting digoxin concentrations (or doses) based on GFR.
Digoxin concentrations predicted by the original Konishi et al model15 were, on average, 10% higher than those predicted by the model modified for our population group (Figure 2A). However, none of the cases reached a difference of 15%, which is the accepted limit of deviation according to the standards of validation of methods for the determination of drugs and their metabolites in biological media.26 Consideration should be given to the possibility of greater bioavailability of the tablets administered to the Japanese patients, as well as our different analytical methodology in determining digoxin. However, since the proportional difference between concentrations predicted by both models increases as GRF decreases (Figure 3), as does the relative proportion of non-renal CL compared to total digoxin CL (Figure 1C), the highest concentrations predicted by the original model may be due to a lower non-renal digoxin CL in the Japanese population.
The Diagnostic efficiencyof a laboratory test is the percentage of total results that are true (excluding false positives and false negatives), and it is accepted as a general rule that a test is not clinically valid if its Diagnostic efficiencyis below 80%.27 The agreement in the classification as subtherapeutic, therapeutic and supratherapeutic between the obtained and predicted digoxin concentrations was only 65%, which indicates that both the original predictive model and the model modified for our population have an unacceptable diagnostic accuracy.
In conclusion, although the importance of adjusting dosage based on GFR in order to avoid digoxin intoxication has been noted,7-9 this variable would only explain 25% of the interindividual variability of digoxin CL. Moreover, in cases with GFR<60-70ml/min, the non-renal CL significance increases very variably for digoxin elimination, as it depends on several factors28-30 that are difficult to account for in the predictive models. These facts lead to the conclusion that the Diagnostic efficiencyof predictive models for digoxin levels (or dosage) based on GFR are clinically unacceptable. According to Schentang et al,31 it seems more practical to assume that digoxin bioavailability and CL (if there are no significant changes in GFR or concomitant medication with possible pharmacokinetic interaction) remain stable for the same patient in the medium term, and in a steady-state there is a linear relationship between dosage and Css. We could therefore, based on the Css obtained experimentally for a dose D that must be adjusted, make a prediction of the Css* for a new dose D* using the expression: Css*/D*=Css/D.

Figure 1. Correlation between glomerular filtration rate and obtained digoxin concentration (A), digoxin clearance (B) and the ratio (digoxin clearance) / (glomerular filtration rate).

Figure 2. Correlation and regression between predicted Css [OM] and predicted Css [MM] (A), predicted Css [OM] and obtained Css (B), and predicted Css [MM] and obtained Css (C).

Figure 3. Correlation of the ratio (predicted Css [OM])/(predicted Css[MM]) with GFR