

The peritoneal membrane (PM) is used routinely, safely and effectively as a dialysis membrane in patients with stage 5 chronic kidney disease (CKD). However, over time and with exposure to certain substances, epithelial-mesenchymal transition (EMT) of the tissues occurs which, in the long term in the most dramatic cases can trigger the condition of encapsulating peritoneal sclerosis (EPS).1,2
We present the case of a 34-year-old woman with focal segmental glomerulonephritis diagnosed in 1991 at the age of eight who was started on haemodialysis in 1992. She was transplanted twice, but after losing the second graft in 2000, returned to haemodialysis.
In August 2001, she had a Tenckhoff II peritoneal catheter implanted and was started on renal replacement therapy using automated peritoneal dialysis (APD) with the conventional dialysis solutions available at that time (Dianeal®). From 2005, the dialysis regimen was modified according to the PEN scheme (Physioneal®-Extraneal®-Nutrineal®) to provide her with biocompatible solutions. While on APD, our patient had two fundamental infection complications: peritonitis due to Haemophilus influenzae in 2006 that led to admission; and an infection of the orifice in 2009 due to Mycobacterium abscessus that led to the catheter being removed and temporary transfer to haemodialysis from May to September 2009.
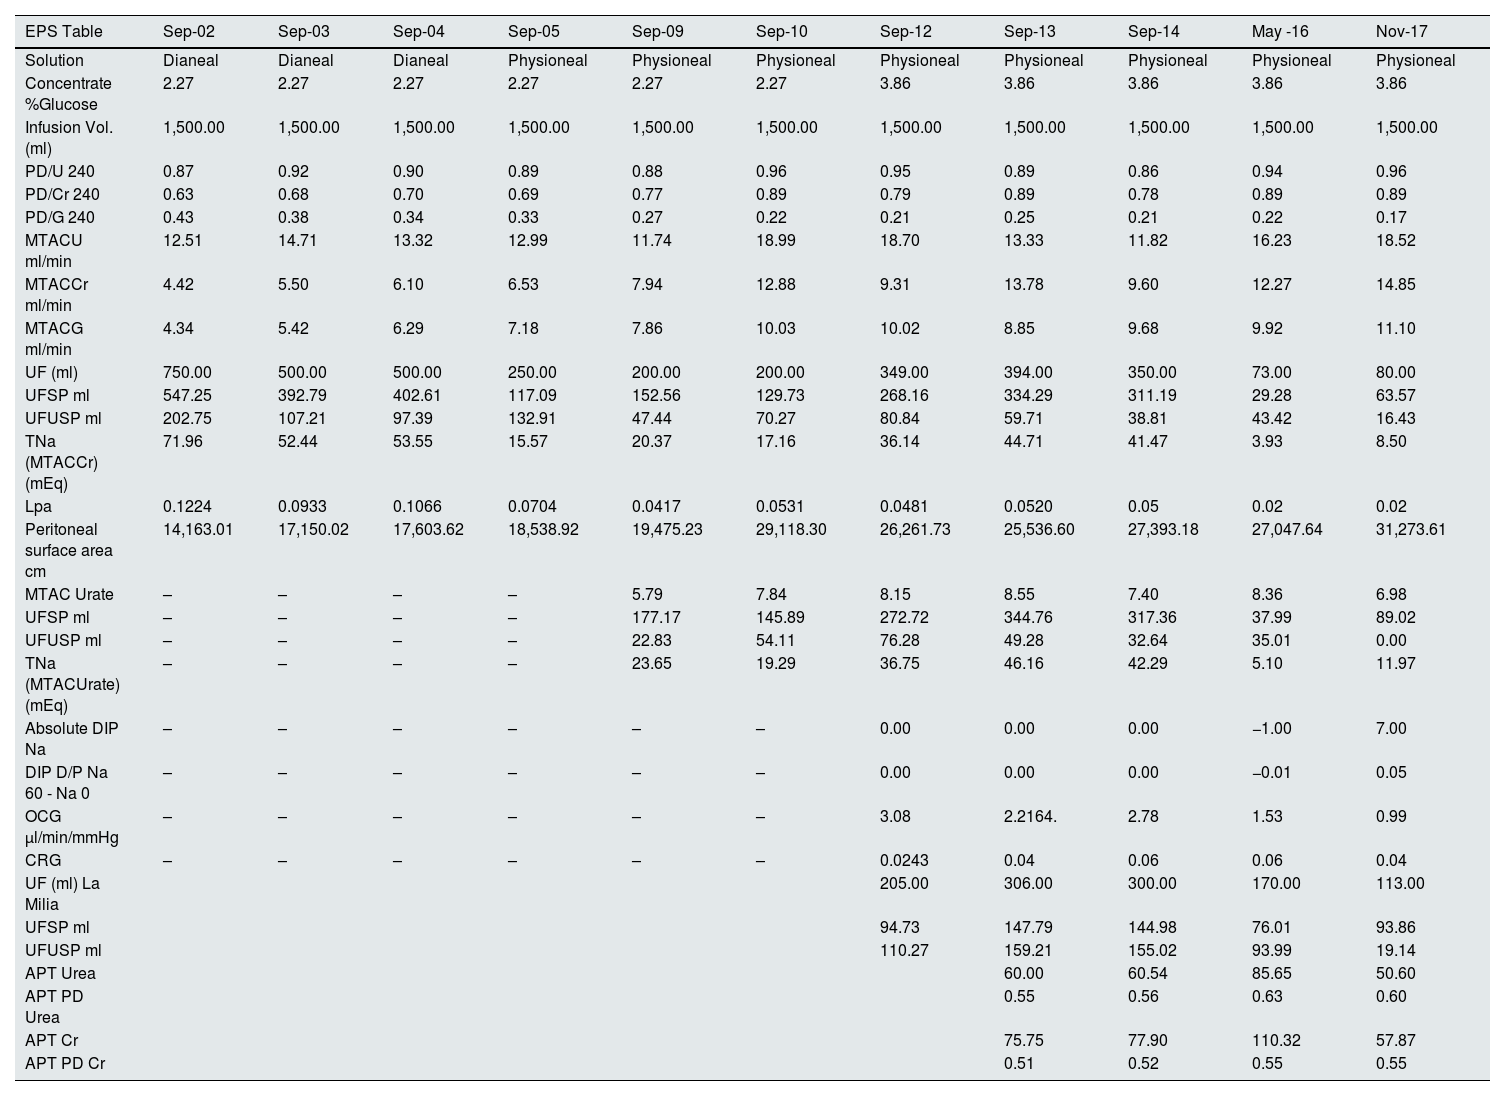
In 2017, the patient began to have episodes of abdominal pain consistent with subocclusive symptoms and progressive deterioration of peritoneal function, leading to ultrafiltration failure (Table 1). Computerised axial tomography (CAT) showed peritoneal calcifications, with the subsequent diagnosis of EPS (Fig. 1).
This table shows the studies of peritoneal membrane function over four years. Note that, over the years, the peritoneal membrane exchange surface area increases and the mass transfer area coefficient (MTAC) therefore also increases. Interestingly, as osmotic conductance to glucose decreases, ultrafiltration through small pores and aquaporins also decreases.
| EPS Table | Sep-02 | Sep-03 | Sep-04 | Sep-05 | Sep-09 | Sep-10 | Sep-12 | Sep-13 | Sep-14 | May -16 | Nov-17 |
|---|---|---|---|---|---|---|---|---|---|---|---|
| Solution | Dianeal | Dianeal | Dianeal | Physioneal | Physioneal | Physioneal | Physioneal | Physioneal | Physioneal | Physioneal | Physioneal |
| Concentrate %Glucose | 2.27 | 2.27 | 2.27 | 2.27 | 2.27 | 2.27 | 3.86 | 3.86 | 3.86 | 3.86 | 3.86 |
| Infusion Vol. (ml) | 1,500.00 | 1,500.00 | 1,500.00 | 1,500.00 | 1,500.00 | 1,500.00 | 1,500.00 | 1,500.00 | 1,500.00 | 1,500.00 | 1,500.00 |
| PD/U 240 | 0.87 | 0.92 | 0.90 | 0.89 | 0.88 | 0.96 | 0.95 | 0.89 | 0.86 | 0.94 | 0.96 |
| PD/Cr 240 | 0.63 | 0.68 | 0.70 | 0.69 | 0.77 | 0.89 | 0.79 | 0.89 | 0.78 | 0.89 | 0.89 |
| PD/G 240 | 0.43 | 0.38 | 0.34 | 0.33 | 0.27 | 0.22 | 0.21 | 0.25 | 0.21 | 0.22 | 0.17 |
| MTACU ml/min | 12.51 | 14.71 | 13.32 | 12.99 | 11.74 | 18.99 | 18.70 | 13.33 | 11.82 | 16.23 | 18.52 |
| MTACCr ml/min | 4.42 | 5.50 | 6.10 | 6.53 | 7.94 | 12.88 | 9.31 | 13.78 | 9.60 | 12.27 | 14.85 |
| MTACG ml/min | 4.34 | 5.42 | 6.29 | 7.18 | 7.86 | 10.03 | 10.02 | 8.85 | 9.68 | 9.92 | 11.10 |
| UF (ml) | 750.00 | 500.00 | 500.00 | 250.00 | 200.00 | 200.00 | 349.00 | 394.00 | 350.00 | 73.00 | 80.00 |
| UFSP ml | 547.25 | 392.79 | 402.61 | 117.09 | 152.56 | 129.73 | 268.16 | 334.29 | 311.19 | 29.28 | 63.57 |
| UFUSP ml | 202.75 | 107.21 | 97.39 | 132.91 | 47.44 | 70.27 | 80.84 | 59.71 | 38.81 | 43.42 | 16.43 |
| TNa (MTACCr) (mEq) | 71.96 | 52.44 | 53.55 | 15.57 | 20.37 | 17.16 | 36.14 | 44.71 | 41.47 | 3.93 | 8.50 |
| Lpa | 0.1224 | 0.0933 | 0.1066 | 0.0704 | 0.0417 | 0.0531 | 0.0481 | 0.0520 | 0.05 | 0.02 | 0.02 |
| Peritoneal surface area cm | 14,163.01 | 17,150.02 | 17,603.62 | 18,538.92 | 19,475.23 | 29,118.30 | 26,261.73 | 25,536.60 | 27,393.18 | 27,047.64 | 31,273.61 |
| MTAC Urate | – | – | – | – | 5.79 | 7.84 | 8.15 | 8.55 | 7.40 | 8.36 | 6.98 |
| UFSP ml | – | – | – | – | 177.17 | 145.89 | 272.72 | 344.76 | 317.36 | 37.99 | 89.02 |
| UFUSP ml | – | – | – | – | 22.83 | 54.11 | 76.28 | 49.28 | 32.64 | 35.01 | 0.00 |
| TNa (MTACUrate) (mEq) | – | – | – | – | 23.65 | 19.29 | 36.75 | 46.16 | 42.29 | 5.10 | 11.97 |
| Absolute DIP Na | – | – | – | – | – | – | 0.00 | 0.00 | 0.00 | −1.00 | 7.00 |
| DIP D/P Na 60 - Na 0 | – | – | – | – | – | – | 0.00 | 0.00 | 0.00 | −0.01 | 0.05 |
| OCG μl/min/mmHg | – | – | – | – | – | – | 3.08 | 2.2164. | 2.78 | 1.53 | 0.99 |
| CRG | – | – | – | – | – | – | 0.0243 | 0.04 | 0.06 | 0.06 | 0.04 |
| UF (ml) La Milia | 205.00 | 306.00 | 300.00 | 170.00 | 113.00 | ||||||
| UFSP ml | 94.73 | 147.79 | 144.98 | 76.01 | 93.86 | ||||||
| UFUSP ml | 110.27 | 159.21 | 155.02 | 93.99 | 19.14 | ||||||
| APT Urea | 60.00 | 60.54 | 85.65 | 50.60 | |||||||
| APT PD Urea | 0.55 | 0.56 | 0.63 | 0.60 | |||||||
| APT Cr | 75.75 | 77.90 | 110.32 | 57.87 | |||||||
| APT PD Cr | 0.51 | 0.52 | 0.55 | 0.55 |

EPS is an uncommon (incidence 0.7–13.6 per 1,000 patients/year) but serious complication of peritoneal dialysis (PD). It occurs more frequently in younger patients and is associated with a high mortality rate and the need for transfer to haemodialysis. Augustine's theory (X) states that two factors (“hits”) are required for the development of EPS.3–5 The first “hit” is PM inflammation, which can be triggered by peritoneal infections, dialysis fluids rich in glucose or low in pH, their degradation products or lactate.4–6 Pro-inflammatory molecules such as TGF-beta, IL-1, FGF and TNF-alpha are elevated, giving rise to the phenomenon known as EMT. In parallel, VEGF increases and tPA decreases, leading to neoangiogenesis, an increase in the extracellular matrix and the migration of mesothelial cells. The second “hit” is triggered by the acute ending of PD therapy, kidney transplant, frequent peritonitis or genetic predisposition.4–7 Other authors suggest that EPS develops as a progressive and reversible continuum from EMT, passing through peritoneal sclerosis until the final stage, which is EPS (X).
Along with the morphological changes, we also see functional changes in the PM. First, due to neoangiogenesis, there is an increase in solute transport. Later, after the onset of fibrosis, dissociation of solute transport and osmotic conductance to glucose (OCG) takes place. Finally, ultrafiltration (UF) failure occurs.6 EPS typically causes UF failure with reduced effective peritoneal surface area and permeability.7
For the study of the PM, two blood samples and six peritoneal fluid samples at 0, 30, 60, 120, 180 and 240 min are usually extracted. In recent years, we have been taking a third blood sample and included a 1.36% Physioneal® bag with complete drainage at 60 min for studying, according to the La Milia methodology.
Our aim in presenting this case report is to demonstrate the usefulness of peritoneal function studies to anticipate cases like that of our patient. As can be seen in Table 1, until 2005 PM studies in our unit were carried out with Dianeal® solution and 2.27% bags, an interesting finding being a higher UF compared to studies carried out with Physioneal®. In addition, from 2012 we starting performing the studies with 3.86% bags. The changes when comparing the 2009 and 2010 studies after the temporary transfer onto haemodialysis in 2009 are particularly striking. The first element to highlight is the increase in the peritoneal surface area and the increase in the mass transfer area coefficient (MTAC) for urea, creatinine and glucose after the "peritoneal rest". Also interesting is the marked decrease in UF through large and small pores (SP) and ultrasmall pores (USP) between the 2014 and 2016 studies, and in OCG, leading to ultrafiltration failure and giving warning of the EPS which became clinically evident after 2017.
We decided to start our patient on treatment with tamoxifen, but it had to be withdrawn after a year due to liver function abnormalities and, after being on APD for 16 years and 8 months, she had to be transferred to definitive haemodialysis.
Diagnosis of EPS continues to be a challenge. Modifications in the functionality parameters of the PM may be evident before the diagnosis is established, so systematic and periodic study of the functionality of the peritoneal membrane enables early detection and management of this disease.
Conflicts of interestThe authors have no conflicts of interest to declare.


