
Cardiovascular disease (CD), the leading cause of death in hemodialysis (HD) patients,1 is closely related to inflammation. C-reactive protein (CRP) and interleukin-6 (IL-6) reflect inflammation and are associated with malnutrition and atherosclerosis.2
Platelets are fundamental for hemostasis and also have a role on inflammation and immunity3 since they interact with the endothelium and cells of innate and acquired immunity.
During the last five years, the platelet/lymphocyte ratio (PLR) and the neutrophil/lymphocyte ratio (NLR)4 have been proposed as potential markers of inflammation. The NLR is also related to systemic endothelial dysfunction.5 Both PLR and NLR are easily obtained, however there is not much research relating PLR and NLR with inflammation in HD.
The objectives of the present study were: (1) To compare in 81 patients in HD with inflammation (PCR ≥10mg/l) and 52 patients without inflammation (PCR ≤10mg/l) the values of Hemoglobin (Hb), red cell distribution width (RDW), total lymphocyte count, total platelet count (TPC), mean platelet volume (MPV), PLR and NLR; (2) To analyze these parameters in patients with/without diabetes mellitus type 2 (DM2) and with/without inflammation; and (3) To determine the correlation between PLR and NLR with known biomarkers of inflammation and nutrition (PCR, IL-6, transferrin, ferritin and albumin).
The ethics and research committee approved the study. The study was performed at the Instituto Mexicano del Seguro Social in patients on HD for more that 3 months and between 18 and 79 years of age. The study was prospective, cross-sectional. Clinical history and laboratory tests were performed. Patients with infection or thrombocytopenia were excluded.
Statistical analysis was performed using the SPSS® v. 20 in Spanish. Depending on the data distribution comparisons were made using Student's t or U of Mann–Whitney, ANOVA or Kruskal–Wallis, Pearson or Spearman. Linear regression analysis was performed to identify independent factors associated to inflammation. We consider a statistically significant difference a p<0.05.
A total of 133 patients were included, 51.1% male. The mean age was 45.86±17.7 years, with a mean dialysis vintage of 45.4±38.4 months; body mass index (BMI) 23.9±5Kt/V of 1.3±0.09. Diabetes mellitus type 2 in 32% and hypertension in 78.9% of the patients. The main causes of end-stage renal disease were unknown (38.3%) and DM2 (32.3%).
The mean NLR was 3.5 (range: 0.28–61.8) and PLR 173.35±98.5 (range: 40.2–778.9).
As compared with patients with PCR <10mg/l, those with CRP >10mg/l had increased levels of IL-6 (10.38 [range: 6.8–13.8pg/ml] vs. 5.73 [range: 3.3–8.1pg/ml]). The RDW were (15.9±12.2 vs. 14.7±1.7.7%), total leukocytes (6.31±1.75 vs. 5.38±1.56×10³/μl), PLR (189.8±114.4 vs. 149±61, p<0.05), NLR (3.53 (range: 0.3–28) vs. 2.41 (range: 0.28–7.58), p=0.005), total number of neutrophils (4.0±1.4 vs. 3.1±1.36×10³/μl, p=0.001).
The number of lymphocytes and Hb level were comparatively lower in the group with inflammation 1.48±0.77 vs. 1.62±0.93×10³/μl (p=0.52) and 9.7±2.2 vs.10.3±2g/L (p=0.17), respectively. The MPV and number of platelets were not significantly different between the two groups.
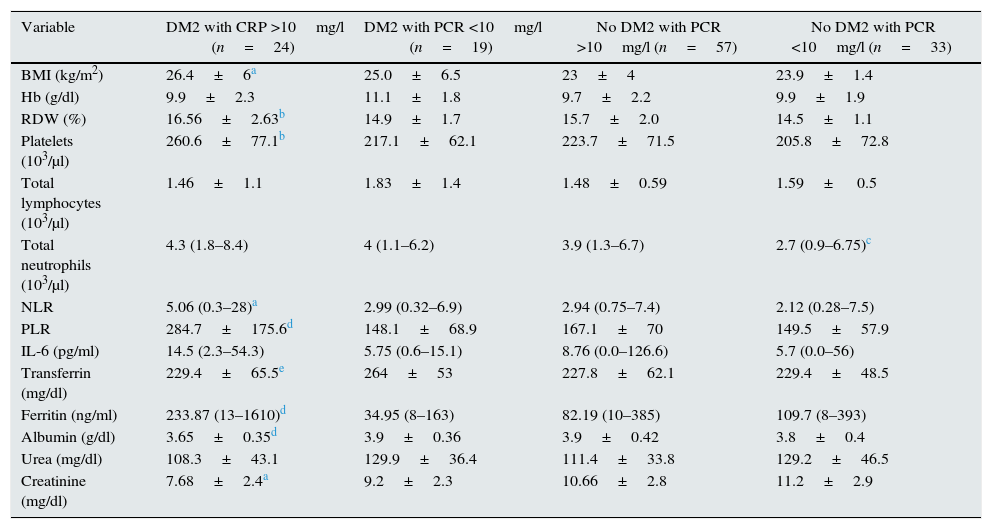
Comparisons of patients with and without DM2 revealed differences in IL-6 (p=0.001), NLR (p=0.02) and PLR (p=0.017), but not in CRP (p=0.16). Patients with DM2 showed a higher degree of inflammation; therefore 4 groups of patients were generated according to the presence or absence of DM2 and/or inflammation (Table 1).
Comparison between patients with/without DM2 and with/without inflammation.
| Variable | DM2 with CRP >10mg/l (n=24) | DM2 with PCR <10mg/l (n=19) | No DM2 with PCR >10mg/l (n=57) | No DM2 with PCR <10mg/l (n=33) |
|---|---|---|---|---|
| BMI (kg/m2) | 26.4±6a | 25.0±6.5 | 23±4 | 23.9±1.4 |
| Hb (g/dl) | 9.9±2.3 | 11.1±1.8 | 9.7±2.2 | 9.9±1.9 |
| RDW (%) | 16.56±2.63b | 14.9±1.7 | 15.7±2.0 | 14.5±1.1 |
| Platelets (103/μl) | 260.6±77.1b | 217.1±62.1 | 223.7±71.5 | 205.8±72.8 |
| Total lymphocytes (103/μl) | 1.46±1.1 | 1.83±1.4 | 1.48±0.59 | 1.59± 0.5 |
| Total neutrophils (103/μl) | 4.3 (1.8–8.4) | 4 (1.1–6.2) | 3.9 (1.3–6.7) | 2.7 (0.9–6.75)c |
| NLR | 5.06 (0.3–28)a | 2.99 (0.32–6.9) | 2.94 (0.75–7.4) | 2.12 (0.28–7.5) |
| PLR | 284.7±175.6d | 148.1±68.9 | 167.1±70 | 149.5±57.9 |
| IL-6 (pg/ml) | 14.5 (2.3–54.3) | 5.75 (0.6–15.1) | 8.76 (0.0–126.6) | 5.7 (0.0–56) |
| Transferrin (mg/dl) | 229.4±65.5e | 264±53 | 227.8±62.1 | 229.4±48.5 |
| Ferritin (ng/ml) | 233.87 (13–1610)d | 34.95 (8–163) | 82.19 (10–385) | 109.7 (8–393) |
| Albumin (g/dl) | 3.65±0.35d | 3.9±0.36 | 3.9±0.42 | 3.8±0.4 |
| Urea (mg/dl) | 108.3±43.1 | 129.9±36.4 | 111.4±33.8 | 129.2±46.5 |
| Creatinine (mg/dl) | 7.68±2.4a | 9.2±2.3 | 10.66±2.8 | 11.2±2.9 |
Mean±SD (standard deviations) are reported, the ranges within brackets.
DM2: type 2 diabetes mellitus; Hb: hemoglobin; IL-6: interleukin 6; BMI: body mass index; NLI: neutrophil/lymphocyte index; PLI: platelet/lymphocyte index; CRP: C-reactive protein; RDW: red cell distribution with.
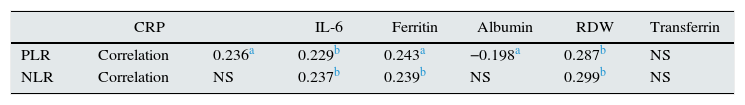
Correlation between PLR and NLR (Spearman's) was 0.654, p=0.0001. No relationship was found between these ratio and the Hb level or dose of erythropoietin. The rest of the data analysis is shown in Table 2.
IPR and INR correlations with biomarkers.
| CRP | IL-6 | Ferritin | Albumin | RDW | Transferrin | ||
|---|---|---|---|---|---|---|---|
| PLR | Correlation | 0.236a | 0.229b | 0.243a | −0.198a | 0.287b | NS |
| NLR | Correlation | NS | 0.237b | 0.239b | NS | 0.299b | NS |
IL-6: interleukin 6; NLR: neutrophil/lymphocyte ratio; PLR: platelet/lymphocyte ratio; NS: not significant; CRP: C-reactive protein; RDW: red cell distribution with.
The values of PLR correlated significantly (by linear regression) with: IL-6 (β=3.26; p=0002) and ferritin (β=3.15; p=0.003). The NLR correlated with ferritin (β=4.0; p=0.0001) and PLR (β=7.9; p=0.0001).
In HD, a low lymphocyte count and a high neutrophil count are independent predictors of mortality6; it is important to note that lymphocyte count in patients with inflammation is lower than 1.5×10³/μl and this is associated with an increased risk of mortality.7 Likewise hypoalbuminemia is associated with mortality and it is more frequent in diabetics and patients with inflammation.
The mean values of PLR and NLR were higher than those reported by other authors; the values were particularly elevated in DM2 patients with CRP >10mg/l, similar to the report by Lou et al.8
We found that the correlation between PLR with inflammatory and nutritional parameters was superior than that obtained by NLI; this is similar to what was reported by Turkmen et al.9
In conclusion, the PLR and NLR are elevated in HD patients with inflammation; both parameters can be obtained at no additional cost and may be used to identify patients with inflammation.
Please cite this article as: Chávez Valencia V, Orizaga de la Cruz C, Mejía Rodríguez O, Gutiérrez Castellanos S, Lagunas Rangel FA, Viveros Sandoval ME. Inflamación en hemodiálisis y su correlación con los índices neutrófilos/linfocitos y plaquetas/linfocitos. Nefrologia. 2017;37:554–556.


