
Categorization of the capacity of ultrafiltration during a peritoneal equilibration test (PET) is a usual step during the monitoring of peritoneal transport characteristics of Peritoneal Dialysis (PD) patients. Quantifying the peritoneal residual volume (Vr) after the dwell preceding the PET (Vrpre) and at the end of the test (Vrpost) could help to improve the accuracy of the estimation of this variable.
MethodFollowing a prospective design, we calculated Vrpre and Vrpost in 116 patients, incident or prevalent on DP, who underwent one or two (n = 27) PET with 3,86/4,25% glucose-based PD solutions and complete drainage at 60 min. We evaluated the consistency of Vr by comparing Vrpre and Vrpost, as also these two parameters in repeated tests. We scrutinized potential associations between demographic and clinical factors, on one side, and the amount of Vr on the other, as also the impact of correcting ultrafiltration during PET for Vr on the categorization of the capacity of ultrafiltration.
ResultsAs a mean, Vrpost was larger than Vrpre. Consequently, correction of ultrafiltration for Vr resulted in significantly higher values than those obtained according to the standard procedure (494 vs. 449 mL, p < 0,0005). We disclosed marked inconsistencies for different estimations of Vr in the same patients (Vrpre vs Vrpost and repeated PET studies). Moreover, no demographic or clinical variable was able to predict the amount of Vr. We observed a significant deviation (>200 mL) between both methods of estimation of the capacity of utrafiltration in only 12,9% of the patients. However, 21,1% of the patients categorized as cases of ultrafiltration failure according to the standard procedure did not maintain this condition after correction for Vr.
ConclusionsCorrection for Vr of the capacity of ultrafiltration during a PET carries, as a mean, a minor impact on the categorization of this parameter. However, the results of the test can be significantly affected in 12,9% of the cases. We have been unable to detect demographic or clinical predictors of Vr, which suggests a random component for the mechanics of single peritoneal exchanges. We suggest that Vr should be estimated at the time of categorizing the capacity of ultrafiltration, whenever inconsistencies during serial PET studies are detected.
La categorización de la capacidad de ultrafiltración durante la prueba de equilibrio peritoneal (PEP) es parte habitual de la monitorización del funcionalismo peritoneal en pacientes tratados con Diálisis Peritoneal (DP). La estimación del volumen residual (Vr) tras el cambio previo (Vrpre) y el de la propia PEP (Vrpost) podría ayudar a mejorar la precisión de la prueba.
MétodoSiguiendo un diseño prospectivo, estimamos el Vrpre y Vrpost en 116 pacientes incidentes o prevalentes en DP que fueron sometidos a una o dos (n = 27) PEP con solución de glucosa al 3,86/4,25% y drenaje completo a los 60 minutos. Valoramos la consistencia del Vr comparando Vrpre y Vrpost y también estos parámetros en PEP sucesivas. Analizamos la posible influencia de factores demográficos y clínicos en la cuantía del Vr, así como el impacto de la corrección para Vr de la ultrafiltración durante la PEP sobre la categorización de la capacidad de ultrafiltración.
ResultadosEl Vrpost fue mayor que el Vrpre, por lo que la ultrafiltración corregida para Vr fue signficativamente mayor que la calculada por procedimiento estándar (494 vs. 449 mL, p < 0,0005). Resultó notable la escasa concordancia de estimaciones sucesivas (Vrpre vs Vrpost y PEP sucesivas) del Vr. Asimismo, ningún parámetro demográfico o clínico escrutado mostró asociación con la magnitud del Vr. Tan solo un 12,9% de los pacientes presentó una desviación clínicamente significativa (>200 mL) de la ultrafiltración corregida para Vr frente al valor estándar. Sin embargo, un 21,1% de los pacientes que cumplían criterio de fallo de ultrafiltración por método estándar, no lo hacían si se aplicaba la corrección para Vr.
ConclusionesLa corrección para Vr modifica escasamente, como media, la estimación de la capacidad de ultrafiltración durante la PEP al 3,86/4,25%, aunque tiene un impacto significativo en un 12,9% de las pruebas. No hemos detectado factores predictivos del Vr durante la PEP, lo que sugiere un componente de aleatoriedad en la mecánica del cambio peritoneal. Sugerimos que este parámetro debe ser estimado si se observan inconsistencias en los resultados de la PEP en lo relativo a la capacidad de ultrafiltración.
The functional integrity of the peritoneal membrane is essential for a successful treatment with peritoneal dialysis (PD). The evolutionary monitoring of peritoneal transport is part of the current routine of most PD units, and is usually performed based on the classic peritoneal equilibration test (PET).1 Although initially it was very focused on the transport of small solutes, over the last twenty years the standardized evaluation of ultrafiltration (UF) capacity and its fractions has gained progressive relevance. This interest has led to the progressive use of PET with 3.86/4.25% glucose solutions and to the emergence of variants of the procedure that facilitate the analysis.2 Of the various parameters examined, the transport of small solutes (creatinine and glucose) and the standardized UF capacity at 240' during PET, most commonly with 3.86/4.25% glucose solution,3–8 but also classic PET at 2.27/2.5%,8,9 currently constitute the core of the periodic evaluation of peritoneal functionalism.
Standardized and serial estimation of UF capacity by PET demands a sufficient degree of precision. However, it is not uncommon to observe significant variations between different studies in the same patient. When this occurs in successive estimates, the effects on the membrane of PD exposure and evolutionary incidences (especially peritoneal infections) usually justify the changes. Despite this, other factors may interfere with a correct assessment of this parameter. The need for good peritoneal drainage mechanics in the two changes associated with PET (the previous to and during the test itself) is a potential distorting element. The estimation of the residual volume (RV) at the beginning and end of PET can provide guidance on the level of imprecision introduced by this factor, and allow indirect estimation of the real UF during PET. However, measurement of RV is not part of the recommended routines for performing this test.8 To analyze the impact of this correction parameter, we conducted an observational and prospective study, whose main objective was to quantify RV in a large sample of incident and prevalent patients on PD, exploring the demographic and clinical profile of RV magnitude, and analyzed how it influences the categorization of UF capacity during PET with 3.86/4.25% glucose solution.
MethodOverall designFollowing an observational and prospective design, we analyzed the meaning of RV in patients who performed a scheduled PET in our Unit during a period of 18 months (2019–2020). The objectives of the study were:
- 1)
Quantify the magnitude of RV during the aforementioned studies and analyze its consistency, comparing RV at baseline and at the end of the tests, as well as in a limited number of patients with more than one test during the study period.
- 2)
To explore demographic, clinical and PD technique-related factors that could predict which patients will have a higher RV
- 3)
To analyze the impact of RV on the values of the main parameters of PET.
The study was carried out in accordance with the Declaration of Helsinki, the Oviedo Convention and other applicable ethical provisions and standards, related to current health, research and data protection regulations. The protocol was evaluated and approved by a Local Research Ethics Committee. Written informed consent was requested from the patients participating in the study.
PopulationAll incident or prevalent patients on PD in our center during a period of 18 months, who underwent at least one PET, were included in the study. Exclusion criteria were age less than 18 years and absence of written informed consent.
According to clinical routine, in patients with peritoneal infection or active or recent peritoneal catheter dysfunction (<1 month), the study was postponed until resolution of the problem.
All patients used solutions low in glucose degradation products and buffered with bicarbonate-lactate. Although solutions from two different companies were used, a large majority (90.5%) came from one of them, so no subanalysis of this variable was performed.
Study variables and proceduresPeritoneal equilibrium testThe main test of the study was a standard PET with complete drainage at 60', performed according to a protocol presented in the Appendix B supplement archive 1. The parameters scrutinized for the study were: dialysate/creatinine plasma ratio at 240' (D/P crea), dialysate ratio at 240'/dialysate at 0' glucose (D/D0 glucose), UF at 240' and drop in sodium concentration at 60'.
Residual volumeThe main study variable was RV, estimated at baseline (RVpre) and at the end of PET (RVpost), according to the following formulas10–12:
RV was estimated for urea and creatinine, applying the arithmetic mean of both parameters.
Other variablesIntraperitoneal pressure (IPP) was estimated in all cases at 60' after PET, following the classic Durand method.13,14
Other variables analyzed are shown in Table 1. Body mass index was calculated by the usual formula (weight/height2). Glomerular filtration rate was estimated by the arithmetic mean of the renal clearance of urea and creatinine. Episodes of previous surgery were only collected if they affected the peritoneal membrane (excluding peritoneal catheter insertion). Daily UF was obtained from patients' clinical records in the month following PET.
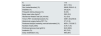
Study population.
| N | 116 |
| Age (years) | 63.7 (15.3) |
| Sex (males/females) (%) | 68/48 (58.6/41.4) |
| Diabetes (%) | 26 (22,4) |
| Polycystic kidney disease (%) | 8 (6.9) |
| Body mass index (kg/m2) | 28.2 (5.2) |
| Glomerular filtration rate (mL/minute) | 5.2 (3.8) |
| Time to PET (incident/prevalent) (%) | 35/81 (30.2/69.8) |
| Abdominal surgery before PET (%) | 37 (31.9) |
| Peritoneal dialysis modality (manual/automated) (%) | 85/31 (73.3/26.7) |
| Number of daily refills | 3,75 (1,16) |
| Peritoneal glucose load (g/24 h) | 84.9 (68.8) |
| Icodextrin (%) | 85 (73.3) |
| Daily ultrafiltration (mL) | 966 (361) |
PET: peritoneal equilibrium test.
In a first step, RVpre and RVpost were calculated and then the values obtained were compared to explore the consistency of the deviation. With the same purpose, the results of two PET tests were compared in those patients who had it done during the study period. This was followed by an exploratory analysis of demographic, clinical and PD prescription-related factors and also the magnitude of RV. As will be realized later, the inconsistency between RVpre and RVpost made it necessary to analyze both variables separately. Finally, UF during PET corrected for RV values (adjusted PET UF = UF standard at PET − RVpre + RVpost) was calculated, and was used to analyze the potential effect of RV on PET results and categorization of UF failure (defined by a UF at 240' <400 mL).
The distribution of the numerical variables scrutinized showed no significant deviations from normality, so they are presented as mean ± standard deviation values. Categorical variables are presented as n (%). Comparisons between numerical variables were performed using Student's t test (for paired and unpaired data) and analysis of variance. Spearman's test was used for correlation analysis. Comparisons between categorical variables were based on the χ2 test. SPSS 19.0 software (IBM Ind., Armonk, New York, USA) was used for data analysis.
ResultsTable 1 shows the demographic and clinical characteristics and PD prescription pattern of the population studied. Table 2 shows the basic results of PET. Regarding estimated RV, it was higher if calculated from urea than from creatinine (p = 0.001), although both values showed a close correlation (r = 0.78 pre-PET samples, r = 0.82 post-PET samples, p < 0.0005).
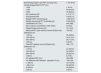
Main results of the peritoneal equilibration tests (PET).
| Drained bag weight in pre-PET exchange (mL) | 1,757 (516) |
| Volume programmed for PET (mL) | |
| 1.000 | 1 (0,9%) |
| 1.500 | 40 (34,5%) |
| 2.000 | 75 (64,6%) |
| D/P creatinine 240' | 0.71 (0.11) |
| D/D0 glucose 240' | 0.29 (0.11) |
| Weight of PET infused bag (g) | 1,889 (377) |
| Weight drained bag PET (corrected) (g)a | 2.340 (539) |
| Ultrafiltration PET (mL) | 449 (395) |
| Dip in sodium concentration at 60' (mM/L) | 6.9 (5.0) |
| Intraperitoneal pressure (cm) | 12.4 (3.2) |
| Mean prePET mean residual volume (RVpre) (mL) | 142 (92). |
| Distribution (%) | |
| <100 mL | 45 (38.8%) |
| 100–200 mL | 44 (41.4%) |
| 200−400 mL | 20 (17.2%) |
| >400 mL | 3 (2.6%) |
| Post-PET residual volume (RVpost) (mL) | 183 (117)* |
| Distribution (%)** | |
| <100 mL | 27 (23.3%) |
| 100–200 mL | 54 (46.6%) |
| 200–400 mL | 26 (22.4%) |
| >400 mL | 9 (7.8%) |
| UF adjusted PEP (mL)b | 494 (362) |
| UF difference 240' standard - adjusted UF (mL) | −39 (126) |
| <−200 mL | 12 (10.3%) |
| −200–0 mL | 56 (48.3%) |
| 0–200 mL | 45 (38.8%) |
| >200 mL | 3 (2.6%) |
D/P: dialysate/plasma ratio; D/D0: dialysate to 240'/dialysate to 0' ratio; RVpre: residual volume at the beginning of the peritoneal equilibration test; RVpost: residual volume at the end of the peritoneal equilibration test.
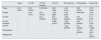
The RVpost was significantly greater than RVpre (Table 2). As a logical consequence, UF for PET corrected for RV (494 ± 362 mL) was significantly higher than the standard estimate (449 ± 395 mL) (p < 0.0005). In addition, RVpre and RVpost showed a significant correlation, but of limited magnitude (r = 0.34, p = 0.001) (Table 3). Univariate analysis (Table 4) confirmed the sense of inconsistency, showing that none of the scrutinized parameter showed association with the double estimate of RV. This analysis was performed separately for RVpre and RVpost, given the relatively poor correlation between the two estimates (Table 4). We also did not observe an apparent effect of RV on small solute transport parameters or fall of sodium at 60 min (Table 4).
Main correlations between parameters.
| Vrpost | UF PET | UF PET corected | UF 24 h | D/P creatinine | D/D0 glucose | Sodium dip | |
|---|---|---|---|---|---|---|---|
| RVpre | 0.34 (0.001) | 0,30 (0.002) | 0.19 (0.04) | 0.06 (0.52) | −0.14 (0.14) | 0.28 (0.003) | −0.10 (0.29) |
| RVpost | – | 0.04 (0.70) | 0.24 (0.012) | −0.02 (088) | −0.04 (0.66) | 0.08 (0.43) | −0.04 (0.71) |
| UF PET | – | – | 0.94 (0.0005) | 0.25 (0.007) | −0.66 (0.0005) | 0.55 (0.0005) | 0.13 (0.16) |
| UF PET corrected | – | – | – | 0.236 (0.007) | −0.62 (0.0005) | 0.49 (0.0005) | 0.11 (0.18) |
| UF 24 h | – | – | – | – | −0.46 (0.0005) | 0.41 (0.0005) | 0.26 (0.006) |
| D/Pcreatinine | – | – | – | – | – | −0.77 (0.0005) | −0.21 (0.01) |
| D/D0glucosa | – | – | – | – | – | – | 0.27 (0.004) |
Values indicate Spearman correlation coefficient values (p).
RVpre: residual volume after drainage prior to PET; RVpost: residual volume at the end of PET; UF PET: standard ultrafiltration at 240' in PET; UF PET corrected: ultrafiltration at 240' in PET corrected for RVpre and RVpost; UF 24-hr: 24 -h ultrafiltration in clinical setting at the time of PET; D/P creatinine: creatinine D/P ratio at 240' in PET; D/D0 glucose: D/D0 ratio in dialysate of glucose at 240'; Dip sodium: drop in dialysate sodium concentration at 60'.
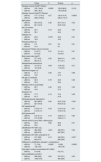
Association between RV and demographic and clinical markers.
| RVpre | P | RVpost | p | |
|---|---|---|---|---|
| Residual volume PrePET (RVpre) | ||||
| <200 mL | 105.7 (44.6) | 0.0005 | 129.5 (88.9) | 0.,015 |
| >200 mL | 294.7 (8.3) | 176.3 (94.8) | ||
| Residual volume PostPET (RVpost) | ||||
| <200 mL | 177.1 (113.0) | 0.27 | 120.4 (41.6) | 0.0005 |
| >200 mL | 208.6 (136.8) | 326.5 (112.7) | ||
| Age (years) | ||||
| <200 mL | 62.8 (15.6) | 0.36 | 62.7 (15.1) | 0.53 |
| >200 mL | 66.1 (12.5) | 64.6 (15.2) | ||
| Sex (% women) | ||||
| <200 mL | 42.7 | 0.70 | 40.8 | 0.87 |
| >200 mL | 38.1 | 42.4 | ||
| Diabetes (%) | ||||
| <200 mL | 23.6 | 0.578 | 25.0 | 0.61 |
| >200 mL | 19.0 | 18.2 | ||
| Policystic kidney (%) | ||||
| <200 mL | 4.5 | 0.57 | 5.3 | 0.61 |
| >200 mL | 14.3 | 9.1 | ||
| Glomerular Filtration rate (mL/minute) | ||||
| <200 mL | 4.9 (3.7) | 0.27 | 5.1 (4.1) | 0.91 |
| >200 mL | 6.0 (4.2) | 5.0 (3.4) | ||
| Body mass index (kg/m2) | ||||
| <200 mL | 27.7 (5.0) | 0.32 | 28.6 (5.1) | 0.25 |
| >200 mL | 28.8 (4.7) | 27.1 (5.1) | ||
| Intraperitoneal pressure(cm) | ||||
| <200 mL | 12.4 (3.1) | 0.68 | 12.6 (3.0) | 0.41 |
| >200 mL | 12.2 (3.8) | 11.9 (3.4) | ||
| Abdominal surgery (%) | ||||
| <200 mL | 21.3 | 0.82 | 19.7 | 0.86 |
| >200 mL | 19.0 | 21.2 | ||
| PD age (% incidents) | ||||
| <200 mL | 30.3 | 0.79 | 32.9 | 0.36 |
| >200 mL | 33.3 | 24.2 | ||
| Modality of PD (% automated) | ||||
| <200 mL | 28.1 | 0.40 | 30.3 | 0.33 |
| >200 mL | 19.0 | 21.2 | ||
| Icodextrin (%) | ||||
| <200 mL | 77.5 | 0.14 | 72.4 | 0.29 |
| >200 mL | 61.9 | 81.8 | ||
| Peritoneal glucose load (g/24 h) | ||||
| <200 mL | 84.6 (69.0) | 0.90 | 93.2 (72.9) | 0.091 |
| >200 mL | 82.5 (73.8) | 68.4 (61.2) | ||
| D/P creatinine 240’ | ||||
| <200 mL | 0.73 (0.11) | 0.33 | 0.72 (0.12) | 0.51 |
| >200 mL | 0.70 (0.11) | 0.73 (0.10) | ||
| D/D0 glucose 240’ | ||||
| <200 mL | 0.27 (0.11) | 0.10 | 0.28 (0.11) | 0.93 |
| >200 mL | 0.31 (0.09) | 0.28 (0.11) | ||
| Volume of PET (Low [1.000−1.500 mL])(%) | ||||
| <200 mL | 36.0 | 0.82 | 36.8 | 0.51 |
| >200 mL | 33.3 | 30.3 | ||
| Ultrafiltration PET 240’ (mL) | ||||
| <200 mL | 394 (330) | 0,001 | 436 (371) | 0.52 |
| >200 mL | 689 (479) | 487 (391) | ||
| Ultrafiltration PET 240' corrected for Vra | ||||
| <200 mL | 471 (325) | 0,13 | 435 (351) | 0.007 |
| >200 mL | 603 (471) | 636 (345) | ||
| Difference in ultrafiltration (standard - corrected)(mL) | ||||
| <200 mL | 71 (104) | 0,0005 | −9 (90) | 0.0005 |
| >200 mL | −86 (134) | 149 (130) | ||
| Drop (dip) in sodium concentration 60' (mM/L) | ||||
| >200 mL | 5.9 (4.8) | 6.3 (3.7) | ||
| Daily ultrafiltration (mL/24 h) | ||||
| <200 mL | 958 (348) | 0.62 | 975 (371) | 0.55 |
| >200 mL | 1002 (419) | 930 (334) | ||
RV: mean residual volume; PET: peritoneal equilibration test; RVpre: RV at change prior to PET; RVpost: RV at change of PET.
RVpre (left) and RVpost (right) categorized according to amount less than or greater than 200 mL.
Patients with UF failure had lower RVpre (118.6 ± 66.4 mL) than those without UF failure (165.6 ± 108.0 mL)(p = 0.007), with no differences in RVpost (p = 0.73). Overall, 15 patients (12.9%) had a clinically significant variation (>200 mL) in UF estimation during PET when taking into account RV. In 12 of them standard UF underestimated actual UF during PET, and only in three cases it was overestimated. The standard estimate of UF indicated UF failure in 57 patients (49.1%), versus 45 (40.9%) if corrected UF was used (p < 0.0005). In other words, 21.1% of the patients who presented UF failure with standard estimation did not present such failure using corrected UF. Only one patient presented UF failure with corrected estimation, without UF failure by standard estimation.
In 27 patients, the study was repeated in a second PET, which confirmed once again the inconsistency of RV. Thus, the correlation between RVpre in first and second PET was 0.20 (p = 0.35), and the correlation for RVpost was 0.29 (p = 0.19).
DiscussionAlthough the classical view of peritoneal transport assumed a sharp inverse relationship between small solute transport and UF capacity, the magnitude of that relationship is known to be limited.15 This apparent mismatch is primarily because UF capacity depends not only on the active surface area of ultrapores and small pores, but also on other factors, including the variable character of the rate of lymphatic reabsorption16 and acquired alterations in membrane function, associated with interstitial fibrosis and vasculopathy, that modify the ability of osmotic agents to generate and maintain water transfer (osmotic conductance).8 Awareness of these issues was the driving force behind the interest in standardizing UF during PET as an independent parameter of clear prognostic relevance.9 In addition, other factors may contribute to the discordance between solute transport and UF during PET, as well as to the not infrequent incongruence between the UF capacity observed in the clinical setting and that obtained in a standardized manner during PET. Thus, daily UF is highly conditioned by the prescription pattern (PD modality, glucose load, duration and volume of changes, icodextrin use); conversely, UF during PET represents a point estimate and is therefore subject to the specific variations that may occur during a single PD refill. Standardization of the test is an attempt to minimize these factors (for example, by separating it in time from episodes of peritoneal infection or catheter dysfunction, or by meticulously protocolizing the procedure), but the mechanics of the exchange cannot be predicted or modulated and, during a PET, these mechanics must be adequate in two changes (the previous one and that of the PET itself), for the test to be valid. One way to control for this factor is to estimate the RV (RVpre and RVpost).11 RV can be calculated quite accurately using dextran or albumin as markers,10,16,17 but this methodology has no application in clinical practice. The use of small solutes is less precise,11,12,18 but allows affordable estimates in clinical routine.11 Despite this, RV is not routinely estimated in most PD units, since the most common tendency is to simplify the development of the test.
The results of our study provide some interesting data. The quantification of RV obtained was consistent with the majority of previous studies11,16,18,19 although lower than other estimates.17 Of note is the inconsistency of the parameter, which varies markedly between patients and, above all, in each individual patient (RVpre vs. RVpost and in different PET). This circumstance suggests a significant component of randomness in the mechanics of peritoneal shift possibly linked, at least in part, to the mobility of the intraperitoneal portion of the catheter. Furthermore, the epidemiological analysis was unable to detect minimally consistent predictors of increased RV (Table 4). In particular, recent PD initiation, obesity, dialysate volume used in PET, PIP, presence of polycystic kidneys or history of abdominal surgery(s) did not show consistent relationship with RV. These results suggest that only estimation of RV in each PET would allow adequate control of this factor. Conversely, RV did not significantly influence, on average, the results regarding solute transport,16 the sodium fall at 60 min or UF during PET, nor did it change the categorization of UF capacity in most patients. However, 21.1% of patients who had UF failure based on standard criteria did not fall into this category if the UF was adjusted for RV. In general, the PET results are slightly affected on average by RV, but may influence a relatively low, but significant percentage of tests. This factor may help explain inconsistencies in successive estimates of the UF capacity of patients on PD.
The present study has significant limitations. The most important is the inexactitude inherent in the use of small solutes as markers for estimating RV. However, it should be emphasized that higher precision methods are not within the reach of clinical routine in most centers. Although good exchange mechanics is a prerequisite for a correct assessment of PET, correct positioning of the peritoneal catheter tip may influence the RV; this factor was not analyzed in our study. The strengths of the study include a prospective and rigorous design, a sufficient number of cases for analysis, and the inclusion of the main potential predictive variables for RV.
In conclusion, the consideration of RV affects little, on average, the estimation of UF capacity during PET at 3.86/4.25%, but it may have a significant impact in some cases, changing the categorization of UF failure in more than one-fifth of the patients so defined from the standard criteria. The amount of RV shows notable variations in each patient, and is not associated with a particular demographic or clinical profile. The data suggest the convenience of estimating this parameter in patients in whom PET has to be repeated due to unexpected inconsistencies in the estimation of UF capacity. In addition, although the estimation of RV is relatively simple, it increases the laboriousness of the PET protocol so that, according to our results, systematic monitoring of this parameter does not seem necessary.
FundingThe authors declare the absence of specific funding for this research.
Conflict of interestThe authors declare that they have no conflicts of interest.
To the nursing staff of the Home Dialysis Unit for their indispensable and enthusiastic collaboration in this study.
The following is Supplementary data to this article:


