Calcineurin inhibitors (CNI) are the first-line treatment for steroid-resistant nephrotic syndrome (SRNS) due to focal segmental glomerulosclerosis (FSGS), though response rates vary. This study analyzed lymphocyte activation through IL-2 receptor expression on T lymphocytes and serum IL-2Rα (soluble CD25) levels in these patients to evaluate their relationship with response to CNI therapy.
Materials and methodsA multicenter case-control study was conducted with 39 patients with steroid-resistant FSGS, diagnosed via renal biopsy, and 23 healthy controls. Clinical, biochemical, and immunological variables were assessed. Soluble CD25 levels were measured using ELISA, and lymphocyte activation was analyzed by flow cytometry. Treatment criteria and response evaluation followed KDIGO guidelines. Diagnostic performance was assessed using ROC curves for soluble CD25.
Results48.7% of patients responded to CNI treatment. Soluble CD25 levels and IL-2 expression on CD3 T lymphocytes were significantly associated with CNI response (p < 0.01): responders had higher CD25 levels (477 ± 84.47 pg/mL) compared to non-responders (290.28 ± 85.98 pg/mL). Responders showed a significant reduction in soluble CD25 (-35.8%) and CD3-IL2+ cells after remission, alongside increases in CD8 DR + cells and regulatory T cells. ROC analysis identified a soluble CD25 cutoff of 324 pg/mL, with 94% sensitivity and 75% specificity for predicting response to CNI.
ConclusionsElevated soluble CD25 levels and T cell activation were associated with better CNI response. Soluble CD25 could be a predictive biomarker to identify patients with higher likelihood of response, optimizing therapeutic decisions and avoiding unnecessary treatments in steroid-resistant FSGS.
Ante un síndrome nefrótico (SN) resistente a corticoesteroides por una glomeruloesclerosis focal y segmentaria (GFS) los inhibidores de la calcineurina (ICN) constituyen la primera línea de tratamiento, aunque la respuesta es variable. Este estudio analizó la activación linfocitaria en estos pacientes mediante la expresión de receptores de IL-2 en linfocitos y los niveles séricos de IL-2Rα (CD25 soluble) para evaluar su relación con la respuesta al tratamiento con ICN.
Material y métodosSe realizó un estudio caso-control multicéntrico en 39 pacientes con SN por GFS resistente a corticoides, diagnosticada por biopsia renal, y 23 controles sanos. Se evaluaron variables clínicas, bioquímicas e inmunológicas. Los niveles de CD25 soluble se midieron mediante ELISA y la activación linfocitaria mediante citometría de flujo. Tanto los criterios de tratamiento como la evaluación de la respuesta a ICN se definieron según los criterios de las guías KDIGO. Los datos se analizaron mediante curvas ROC para determinar el rendimiento diagnóstico de CD25 soluble.
ResultadosUn 48,7% de los pacientes respondió al tratamiento con ICN. Los niveles de CD25 soluble y la expresión de IL-2 en linfocitos CD3 se asociaron significativamente con la respuesta a ICN (p < 0,01) con valores de CD25 soluble 477 ± 84.47 (respondedores) vs. 290.28 ± 85.98 pg/mL (no respondedores). Tras la remisión, los pacientes sensibles a ICN mostraron una reducción significativa de CD25 soluble (-35,8%), linfocitos CD3 y CD3-IL2+, junto con un incremento en CD8 DR + y células T reguladoras. El análisis ROC identificó un punto de corte de 324 pg/mL de CD25 soluble, con una sensibilidad del 94% y una especificidad del 75% para predecir la respuesta a ICN.
ConclusionesEn nuestro estudio, los niveles elevados de CD25 soluble y la activación linfocitaria T se asoció con una mejor respuesta al tratamiento con ICN. La medición de CD25 soluble podría integrarse como un biomarcador predictivo útil para identificar de manera temprana a los pacientes con mayor probabilidad de respuesta, optimizando así las decisiones terapéuticas y evitando tratamientos innecesarios en la GFS resistente a corticoides. Este estudio presenta ciertas limitaciones, como el tamaño reducido de la muestra y la ausencia de validación externa.
Idiopathic focal segmental glomerulosclerosis (FSGS) represents an important cause of nephrotic syndrome (NS) and may be resistant to treatment with corticosteroids. This resistance can be evident from the first therapeutic cycle or can manifest after several treatment cycles.1 The response to corticosteroids has been defined as the main long-term prognostic indicator in all stages of life.2,3 In cases of corticosteroid resistance, calcineurin inhibitors (CNIs) are currently the first-line treatment, with variable response rates ranging between 31% and 89% for complete remission and between 19% and 38% for partial remission, depending on the selection criteria used.4 CNI efficacy is associated with a significant reduction in the risk of progression to advanced chronic kidney disease.4
The mechanism of action of CNIs is based on the inhibition of calcineurin, which regulates the expression of genes involved in the synthesis of cytokines essential for the activation and proliferation of cytotoxic T lymphocytes.5,6 Among these cytokines are IL-2, IL-4, interferon gamma, and tumor necrosis factor alpha. Of these, IL-2 is particularly relevant because it plays a crucial role as a regulator of T cells in numerous immune processes. The inhibition of calcineurin leads to a decrease in the production of IL-2 and other proinflammatory cytokines, as well as a suppression of lymphocyte proliferation.7 Additionally, CNIs stabilize the actin cytoskeleton in podocytes, thus reducing proteinuria and improving glomerular function.8
Lymphocyte activation, measured by the expression of IL-2 and serum levels of IL-2Rα (soluble CD25), is characteristic of various immunological diseases, including idiopathic nephrotic syndrome (INS).9 During episodes of relapse, elevated levels of IL-2, IL-4, and IL-8 have been documented in patients with INS,10,11 whereas the T lymphocytes of corticosteroid-resistant patients show greater expression of IL-2 mRNA than those of patients sensitive to corticosteroids.11 Other studies have identified inflammatory response patterns in patients with FSGS characterized by increased levels of the cytokines IL-1 and IL-6, which are associated with increased resistance to corticosteroids.12,13 Despite this evident association, the exact mechanism by which lymphocyte activation is related to the alteration of the filtration barrier or to the podocyte injury is unknown. Studies in animal models have suggested that excess IL-2 can promote the upregulation of proapoptotic molecules and the loss of structural integrity of the glomerular barrier.14
In this context, the objective of the present study was to analyze the activation state of T lymphocytes in patients with corticosteroid-resistant FSGS, evaluate the expression of IL-2 receptors and serum levels of IL-2Rα (soluble CD25) and explore their possible association with the response to treatment with CNIs.
Materials and methodsStudy design and inclusion criteriaA multicenter case-control study was conducted in patients with corticosteroid-resistant NS caused by idiopathic FSGS, diagnosed by renal biopsy. The study included adult and pediatric patients treated at 4 hospital centers between January 2012 and March 2019. The inclusion criteria were steroid resistance, histological diagnosis of FSGS by renal biopsy, absence of secondary etiologies according to a systematic study and protocol, absence of a family history of nephropathy, and negative results in the genetic study. In addition, only patients who had not yet received treatment with steroids, immunosuppressants, angiotensin II receptor blockers, or statins at the time of blood and urine sample collection were included. The exclusion criteria were secondary etiologies such as a reduction in renal mass; morbid obesity; HIV-associated nephropathy; heroin or cocaine use; parvovirus B19 infection; the use of analgesics, bisphosphonates, or interferon; vesicoureteral reflux; and obstructive sleep apnea. A genetic study was performed to rule out pathogenic mutations in all patients under 35 years of age with corticosteroid resistance using a previously described and validated renal panel (Bullich et al., 2018).
The design consisted of 2 phases: 1) a case‒control observational phase to analyze the response to CNIs and associated variables and 2) a prospective follow-up of the cohort of treated patients to evaluate the evolution of the variables of interest after treatment as a function of the outcome.
Operational definitionsIdiopathic NS (INS) was defined by 24 h urinary protein excretion values >3.5 g/day in adults and >40 mg/m2/h in children, associated with hypoalbuminemia <3.5 g/dL and edema. After diagnosis, both clinical follow-up and treatment were carried out following the recommendations indicated in the Kidney Disease: Improving Global Outcomes (KDIGO)15 guidelines at the discretion of each participating center. To be included in the study, the criteria for corticosteroid resistance were explicitly defined and were the same for all the centers. In pediatric patients, corticosteroid resistance was defined as a lack of complete remission (reduction in the protein/creatinine ratio in urine to <0.2 mg/mg) after 8 weeks of therapy with prednisone at a standard dosage of 60 mg/m2/day. In adult patients, corticosteroid resistance was defined as the lack of remission (reduction in proteinuria to <0.3 g/day, stable serum creatinine levels, and serum albumin levels > 3.5 g/dL) after a minimum exposure of 16 weeks to prednisone at a daily dosage of 1 mg/kg or at a dosage every other day of 2 mg/kg. Patients with partial remission to corticosteroids were not included; only those patients who, according to the definition, did not achieve remission were considered resistant to corticosteroids, regardless of whether they presented a decrease in proteinuria without reaching the threshold established for partial remission. The type of CNI indicated (tacrolimus or cyclosporine) was freely selected by each of the participating centers. The guidelines for treatment in terms of dose, trough levels, and controls were the same in all centers and were also based on the recommendations of the KDIGO guidelines.15 A response to treatment with CNIs was considered if, after the start of treatment, total or partial remission of proteinuria was achieved, according to the criteria described in the KDIGO guidelines for pediatric and adult patients. Pediatric patients were considered those <18 years of age.
The control group included healthy subjects paired by age and sex selected from an electronic database containing the demographic data of 450 healthy blood donors and healthy individuals of pediatric age obtained from preoperative studies of dermatological processes or minor local surgeries. All participants in the study signed the corresponding informed consent form prior to inclusion. In the case of pediatric controls, blood samples were obtained after informed consent was obtained from their parents or guardians. The study was carried out in accordance with the parameters established by the Declaration of Helsinki and the local law on the protection of personal data (LOPD 15/1999). The study protocol was approved by the independent bioethics committees of the participating centers (internal code 2551).
Laboratory methodsAll blood, serum, and DNA samples were obtained before any immunosuppressive or immunomodulatory treatment was started. Blood samples were obtained in standard tubes without additives, centrifuged at 1500 g for 10 min, and stored at −80 °C until use. Serum creatinine levels were measured by the compensated method traceable to isotope dilution mass spectrometry (IDMS) (Hitachi Modular P-800 Roche Diagnostics, Germany). The estimated glomerular filtration rate (eGFR) was calculated using the Schwartz equation in children and the Chronic Kidney Disease Epidemiology Collaboration (CKD-EPI) formula in adults. Serum levels of CD25 were measured by enzyme-linked immunosorbent assay (ELISA) (Quantikine R&D Systems, Inc., MN, USA). All ELISA analyses were performed in the same laboratory using the same equipment and in duplicate. In addition, to analyze the reproducibility of the measurements, in a sample of 15 patients, 3 or more determinations were performed during the nephrotic flare-up phase before starting any treatment. In all cases, the coefficients of variation of the repeated measurements were <10%.
The analysis of lymphocyte activation was performed using multichannel flow cytometry (Cytoflex Beckman Coulter, USA) including the following: subpopulations of T lymphocytes (helper (CD4 DR+), cytotoxic (CD8 DR+) and regulatory T cells), soluble IL-2 receptor (CD25), and CD3 lymphocytes with CD25 expression. For this analysis, monoclonal antibodies conjugated with fluorophores specific for each marker (Abyntek Biopharma, Spain) were used.
Anatomopathological analysis of renal biopsiesAll renal biopsies were analyzed centrally in a blinded manner by 2 experienced pathologists who confirmed the morphological pattern of FSGS on a case-by-case basis. Renal biopsies were stained with hematoxylin and eosin, periodic acid-Schiff-methenamine, and Masson’s trichrome for morphological analysis, and immunofluorescence studies were performed with antibodies against immunoglobulin A (IgA), IgG, IgM, C3, fibrinogen, and light chains. Samples were also processed for examination by electron microscopy.
Statistical methodsQuantitative variables are expressed as the mean ± standard deviation, and qualitative variables are expressed as proportions. Comparisons of means between groups for independent data were performed using Student’s t-test or the Mann‒Whitney U test in the case of a nonnormal distribution. Comparisons of 2 intragroup means were performed using Student’s t-test for paired data or its equivalent and the Wilcoxon test for nonparametric variables. The association between quantitative variables was analyzed using the Pearson or Spearman correlation coefficient as a function of the distribution of the variable. Comparisons between categorical variables were performed using the chi-square test. To analyze the normality of the distribution of the data, the Kolmogorov‒Smirnov or Shapiro‒Wilk test was used. A p value was accepted as significant when <0.05. After the patients were classified according to their response to CNI treatment, univariate analysis was performed to analyze the variables associated with remission. The cutoff values for the quantitative variables associated with the response to treatment were calculated by receiver operating characteristic (ROC) curve analysis, and the Youden index was used to select the optimal value. Statistical calculations were performed using SPSS®, version 20.0.
ResultsDemographic, clinical, and biochemical characteristics at the time of inclusionA total of 39 patients with corticosteroid-resistant FSGS were included; 15 (38.5%) were pediatric patients (15 ± 2 years), and 24 (61.5%) were older than 18 years (38 ± 17 years). The control group included 23 healthy controls, of whom 26.1% were pediatric, with an average age of 17 ± 1 years, and 73.9% were adults, with an average age of 34 ± 12 years.
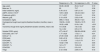
Table 1 summarizes the demographic, clinical, and biochemical characteristics of both groups. No statistically significant differences were observed in terms of age, sex, or the eGFR between patients with FSGS and healthy controls. However, compared with controls, patients with FSGS showed significantly higher levels of soluble CD25, expression of IL2 receptors in CD3 T lymphocytes (CD3-IL2+), and DR in CD4 and CD8 lymphocytes, as well as a higher CD4/CD8 ratio (p < 0.01).
Demographic and biochemical characteristics of patients with FSGS and healthy controls.
| FSGS (n = 39) | Controls (n = 23) | P value | |
|---|---|---|---|
| Age, years | 28.7 ± 17.95 | 29.4 ± 13.12 | 0.34 |
| Male sex, % | 66.7 | 43.5 | 0.07 |
| Initial creatinine, mg/dL | 0.82 ± 0.13 | 0.79 ± 0.11 | 0.40 |
| eGFR, ml/min/1.73 m2 | 140 ± 27 | 145 ± 17 | 0.45 |
| Proteinuria, g/24 h | 15.59 ± 4.01 | 0.09 ± 0.03 | <0.01 |
| Albumin, g/dL | 2.22 ± 0.37 | 4.35 ± 0.37 | <0.01 |
| Cholesterol, mg/dL | 376 ± 129 | 186 ± 65 | <0.01 |
| Soluble CD25, ng/mL | 383.6 ± 126.5 | 262.8 ± 62.7 | <0.01 |
| CD3 (total) | 1.74 ± 0.8 | 1.35 ± 0.4 | 0.09 |
| CD3-IL2+ | 23.85 ± 8.7 | 14.96 ± 3.54 | <0.01 |
| CD8 (total) | 0.57 ± 0.17 | 0.63 ± 0.24 | 0.31 |
| CD4 (total) | 1.13 ± 0.56 | 1.35 ± 0.38 | 0.03 |
| CD4 DR+, % | 10.38 ± 6.03 | 2.26 ± 1.19 | <0.01 |
| CD8 DR+, % | 17.23 ± 9.12 | 2.5 (0−29) | <0.01 |
| CD4/CD8 | 2.37 ± 1.13 | 1.34 ± 0.85 | <0.01 |
| Tregs | 2.24 ± 0.84 | 3.49 ± 0.62 | <0.01 |
Mean ± SD.
SD: standard deviation; FSGS: focal segmental glomerulosclerosis; eGFR: estimated glomerular filtration rate.
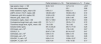
Table 2 summarizes the correlation matrix between the variables related to the activation of T lymphocytes studied in the total group of patients with FSGS. The level of soluble CD25 was moderately associated with the expression of IL2 in CD3 lymphocytes and weakly associated with DR expression in CD4 and CD8 lymphocytes. A significant correlation was also observed between the total number of CD3 lymphocytes and the number of CD8 DR+ lymphocytes, and a strong negative correlation was detected between the number of CD4 DR+ lymphocytes and the number of CD8 DR+ lymphocytes. In the healthy control group, there were no significant associations between any of the variables studied (data not shown).
Correlation matrix between variables in the group of patients with FSGS.
| Total CD3 | CD3-IL2+ | CD4 DR+ | CD8 DR+ | |
|---|---|---|---|---|
| Soluble CD25 | 0.02 | 0.45** | 0.26* | 0.39* |
| Total CD3 | 0.19 | 0.04 | 0.48** | |
| CD3-IL2+ | 0.14 | −0.29 | ||
| CD4 DR+ | −0.67** |
The correlations between the variables were calculated using the Pearson correlation coefficient. P values were considered significant when they were less than 0.05 (*p < 0.05) or 0.01 (**p < 0.01). The correlations were interpreted as follows: A) Positive correlation: Indicates a direct relationship between the variables (the greater the value of one variable is, the greater the value of the other). B) Negative correlation: Indicates an inverse relationship between the variables (the greater the value of one variable is, the lower the value of the other).
FSGS: focal segmental glomerulosclerosis.
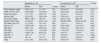
The minimum duration of treatment with calcineurin inhibitors was 6 months, following the recommendations of the clinical guidelines, with a mean of 11.7 ± 5.35 months (range: 6–24 months), without significant differences in the duration between cyclosporine A and tacrolimus (p = 0.92). However, when the response or resistance to CNI treatment was analyzed, statistically significant differences were observed: responding patients received more months of treatment, whereas in patients without any response, the treatment was interrupted relatively early to avoid side effects and due to a lack of efficacy (Table 3).
Demographic and biochemical characteristics of patients with FSGS stratified by the response to CNI treatment.
| Response (n = 19) | No response (n = 20) | P value | |
|---|---|---|---|
| Age, years | 33.06 ± 20.38 | 25.4 ± 14.47 | 0.19 |
| Male sex, % | 60 | 73.7 | 0.36 |
| Initial creatinine, mg/dL | 0.78 ± 0.13 | 0.87 ± 0.10 | 0.03 |
| eGFR, ml/min/1.73 m2 | 145.5 ± 28.0 | 120.44 ± 32.0 | 0.21 |
| Proteinuria, g/24 h | 11.7 ± 3.37 | 13.4 ± 4.5 | 0.34 |
| Albumin, g/dL | 2.13 ± 0.33 | 2.32 ± 0.40 | 0.14 |
| Cholesterol, mg/dL | 396.3 ± 143.2 | 354.8 ± 112.5 | 0.32 |
| Cyclosporine trough level (ng/mL)/treatment duration (months), mean ± SD | 152.55 ± 12.05 | 159.05 ± 15.75 | 0.31 |
| 16.22 ± 4.89 | 8.16 ± 1.64 | <0.01 | |
| Tacrolimus trough level (ng/mL)/treatment duration (months), mean ± SD | 7.6 ± 0.58 | 7.6 ± 0.42 | 0.87 |
| 14.4 ± 6.2 | 8.5 ± 2.13 | 0.02 | |
| Soluble CD25, ng/mL | 477 ± 84.47 | 290.28 ± 85.98 | <0.01 |
| CD3 (total), cell × 109 | 1.77 ± 0.23 | 1.72 ± 1.1 | 0.01 |
| CD3-L2+, % | 27.09 ± 6.36 | 20.61 ± 9.65 | <0.01 |
| CD8 (total) | 0.60 ± 0.16 | 0.54 ± 0.19 | 0.18 |
| CD4 (total) | 1.13 ± 0.35 | 1.12 ± 0.73 | 0.11 |
| CD4 DR+, % | 10.82 ± 7.93 | 9.4 ± 3.4 | 0.65 |
| CD8 DR+, % | 14.5 ± 7.7 | 19.9 ± 9.8 | 0.01 |
| CD4/CD8 | 2.5 ± 1.5 | 2.3 ± 0.6 | 0.91 |
| Tregs | 2.12 ± 0.92 | 2.36 ± 0.76 | 0.72 |
Mean ± SD.
SD: standard deviation; FSGS: focal segmental glomerulosclerosis; CNI: calcineurin inhibitor; eGFR: estimated glomerular filtration rate.
Of the 39 patients, 19 (48.7%) responded to CNI treatment; among them, 12 (63.2%) achieved a partial response, and 7 (36.8%) achieved a complete response. Compared with nonresponders, responders had significantly higher levels of soluble CD25, absolute numbers of CD3 lymphocytes, and expression of IL-2 in CD3 lymphocytes and lower expression of DR in CD8 lymphocytes (p < 0.05; Table 3).
When patients who responded to CNI treatment were analyzed by partial remission and complete remission (Table 4), patients with complete remission were significantly younger, whereas no significant differences were found in the other variables studied (Table 4).
Demographic and biochemical characteristics of patients with FSGS who responded to CNI treatment stratified by the type of response.
| Partial remission (n = 12) | Total remission (n = 7) | P value | |
|---|---|---|---|
| Age (years), mean ± SD | 30.8 ± 14.9 | 14.7 ± 2.14 | <0.01 |
| Sex, ratio males:females | 3:1 | 2.5:1 | 0.86 |
| Initial creatinine, mg/dL, mean ± SD | 0.90 ± 0.1 | 0.82 ± 0.1 | 0.07 |
| eGFR, ml/min/1.73 m2, media ± DE | 126.58 ± 29.7 | 109.92 ± 35.3 | 0.72 |
| Proteinuria, g/dL 24 h, media ± DE | 12.26 ± 4.55 | 14.54 ± 4.63 | 0.31 |
| Albumin, g/dL, mean ± SD | 2.32 ± 0.35 | 2.36 ± 0.48 | 0.86 |
| Cholesterol, mg/dL, mean ± SD | 353.1 ± 106.8 | 357.7 ± 130.4 | 0.93 |
| Cyclosporine trough level, µg/L, mean ± SD | 151.7 ± 11.7 | 155.5 ± 17.6 | 0.72 |
| Tacrolimus trough level, ng/mL, mean ± SD | 7.6 ± 0.58 | 7.6 ± 0.42 | 1.00 |
| Soluble CD25, ng/mL | 491.4 ± 84.20 | 445.7 ± 77.53 | 0.25 |
| CD3 (total), cell × 109 | 1.74 ± 0.21 | 1.79 ± 0.30 | 0.67 |
| CD3-IL2+, % | 28.47 ± 7.54 | 26.14 ± 4.67 | 0.47 |
| CD8 (total), cell × 109 | 0.59 ± 0.15 | 0.60 ± 0.19 | 0.92 |
| CD4 (total), cell × 109 | 1.21 ± 0.35 | 1.02 ± 0.34 | 0.28 |
| CD4 DR+, %, cell × 109 | 9.26 ± 3.14 | 13.28 ± 12.27 | 0.31 |
| CD8 DR+, %, cell × 109 | 12.6 ± 4.81 | 17.6 ± 10.42 | 0.17 |
SD: standard deviation; FSGS: focal segmental glomerulosclerosis; CNI: calcineurin inhibitor; eGFR: estimated glomerular filtration rate.
The analysis of CD25 levels revealed statistically significant differences between responsive FSGS patients and controls (477 ± 84 vs. 262 ± 62 pg/mL, respectively; p < 0.01). In contrast, no significant differences were found between nonresponders and controls (290 ± 86 vs. 262 ± 62 pg/mL, respectively; p = 0.31).
Subgroup analysis of the pediatric population (<18 years)The pediatric cohort included a total of 15 patients, 52.4% of whom were male. The mean age was 14.7 ± 2.1 years. When demographic, clinical, and biochemical characteristics were compared between the pediatric and adult populations, no significant differences were observed. Similarly, no differences were detected in the serum levels of soluble CD25, in the proportion of CD3 lymphocytes with IL-2 expression, or in the rest of the lymphocyte subpopulations analyzed.
Regarding the response to CNI treatment, 53.3% (n = 8) of the pediatric patients met the response criteria. Among these patients, 87.5% (n = 7) achieved total remission of NS, which represents a statistically significant difference compared with the adult population, where none of the patients achieved complete remission (p < 0.01).
Predictive analysisA binary logistic regression model was constructed based on the statistically significant variables of the bivariate study, and only the CD25 variable demonstrated significance in the final model.
ROC curve analysis showed an AUC of 0.937 and revealed a cutoff of 324 pg/mL for soluble CD25, with a sensitivity of 94%, specificity of 75%, positive predictive value of 78%, and negative predictive value of 94% (Fig. 1).
Evolution after treatment
After an average follow-up of 13.7 ± 5.3 months, both groups (responders and nonresponders) showed a significant decrease in the eGFR and an increase in the serum creatinine level. The loss of renal function was greater in nonresponders (−6.97 [p25: −1.92; p75: −4.8] ml/min/month) than in responders (−3.39 [p25: −0.3; p75: −2.2] ml/min/month; p < 0.01).
In responsive patients, a statistically significant reduction in proteinuria and the cholesterol level and an increase in the serum albumin level were observed. In addition, these patients presented statistically significant decreases in the levels of soluble CD25, the number of CD3 and CD3-IL2+ lymphocytes, and the CD4/CD8 ratio. In contrast, they showed a significant increase in the number of CD8 DR+ and regulatory T cells. In patients who did not respond to treatment, a significant reduction in the level of soluble CD25, the level of CD3 IL-2+, and the level of CD8 DR+ and a significant reduction in the CD4/CD8 ratio were detected, but the other variables did not change (Table 5).
Changes in the different biochemical variables and variables related to the activation of T lymphocytes in patients with FSGS before and after treatment stratified by the response to treatment.
| Response (n = 19) | No response (n = 20) | P value | ||||
|---|---|---|---|---|---|---|
| Before | After | P value | Before | After | ||
| Initial creatinine, mg/dL | 0.78 ± 0.13 | 1.1 ± 0.41 | 0.01 | 0.87 ± 0.10 | 1.8 ± 0.83 | <0.01 |
| eGFR, ml/min/1,73 m2 | 145.5 ± 28.0 | 74.6 ± 23.5 | <0.01 | 120.4 ± 32.0 | 43.5 ± 21.8 | <0.01 |
| Proteinuria, g/24 h | 11.7 ± 3.37 | 2.35 ± 2.2 | <0.01 | 13.4 ± 4.5 | 15.3 ± 6.7 | 0.27 |
| Albumin, g/dL | 2.13 ± 0.33 | 3.92 ± 0.54 | <0.01 | 2.32 ± 0.40 | 2.4 ± 0.32 | 0.35 |
| Cholesterol, mg/dL | 396.3 ± 143.2 | 192 ± 75 | <0.01 | 354.8 ± 112.5 | 299 ± 201 | 0.01 |
| Soluble CD25, ng/mL | 477 ± 84.47 | 304.7 ± 65.1 | <0.01 | 290.28 ± 85.98 | 269.95 ± 61.56 | 0.03 |
| CD3 (total), cell × 109 | 1.77 ± 0.23 | 1.6 ± 0.10 | 0.04 | 1.72 ± 1.1 | 1.69 ± 1.2 | 0.34 |
| CD3-IL2+, % | 27.09 ± 6.36 | 13.2 ± 7.6 | <0.01 | 20.61 ± 9.65 | 15.4 ± 11.6 | 0.022 |
| CD8 (total) | 0.60 ± 0.16 | 0.59 ± 0.21 | 0.44 | 0.54 ± 0.19 | 0.56 ± 0.10 | 0.44 |
| CD4 (total) | 1.13 ± 0.35 | 1.12 ± 0.67 | 0.48 | 1.12 ± 0.73 | 1.10 ± 0.12 | 0.36 |
| CD4 DR+, % | 10.82 ± 7.93 | 9.91 ± 6.8 | 0.22 | 9.4 ± 3.4 | 9.5 ± 5.3 | 0.47 |
| CD8 DR+, % | 14.5 ± 7.7 | 17.7 ± 11 | 0.01 | 19.9 ± 9.8 | 17.4 ± 11.3 | 0.042 |
| CD4/CD8 | 2.5 ± 1.5 | 1.9 ± 1.3 | 0.01 | 2.3 ± 0.6 | 1.96 ± 0.7 | 0.046 |
| Tregs | 2.12 ± 0.92 | 3.34 ± 0.75 | 0.01 | 2.36 ± 0.76 | 2.4 ± 0.91 | 0.47 |
FSGS: focal segmental glomerulosclerosis; eGFR: estimated glomerular filtration rate.
The reduction in the soluble CD25 level was significantly greater in patients who responded to treatment than in those who did not respond (mean reduction: −169.5 ± 99.2 vs. −20.15 ± 8.9 pg/mL, respectively, p < 0.01). When the reduction in the soluble CD25 level was analyzed according to partial or total remission, no statistically significant difference was detected.
DiscussionThe results indicate that patients with corticosteroid-resistant FSGS present a heterogeneous profile of T lymphocyte activation in terms of the distribution of the variables analyzed. However, the clinical profile, especially in terms of renal function and severity of NS, is comparable among all patients.
An elevated soluble CD25 level is significantly associated with the expression of IL-2 in CD3 lymphocytes. This may indicate that the level of soluble CD25 is due, at least in part, to the activation of CD3 lymphocytes. However, this activation is not present in all patients with FSGS, at least at the time of the study and the extraction of blood samples. In addition, it is clearly related to the response to treatment with CNIs.
Our data suggest that there may be different mechanisms responsible for the same type of podocyte injury, since there is no evidence to indicate that NS, by itself, is capable of altering the level of soluble CD25. Both the severity and the clinical characteristics of patients who responded were comparable to those of resistant patients. Through the inclusion criteria, it was ensured as much as possible that the activation state of T lymphocytes was not influenced by external pharmacological factors. There is no evidence indicating that corticosteroids induce irreversible changes in the state of lymphocyte activation. This could be due to diverse pathogenic mechanisms, as has been demonstrated in previous studies, or to different stages of activity of the same pathogenic process. For either of the 2 hypotheses, the data suggest that the measurement of the soluble CD25 level prior to the start of treatment may be useful for predicting the probability of a response to CNIs, although not for predicting whether the type of response expected will be total or partial remission.
The changes in the level of soluble CD25 observed after treatment indicate that remission is associated with a significant reduction in the parameters related to the activation of T lymphocytes. This reduction cannot be attributed to the NS alone, since it follows a different behavior depending on the type of response and is not evident in patients who do not respond to treatment. The number of CD3 lymphocytes expressing IL-2 receptors is also an indicator of T-lymphocyte activation. However, the analysis revealed that although this number is greater in patients who respond to treatment, its predictive value is very low—lower than that observed with the soluble CD25 level.
The exact mechanism of action of CNIs in FSGS is not yet fully understood. According to the literature, T cells act on podocytes, causing proteinuria, and the antiproteinuric effects of CNIs result from the inhibition of T-cell nuclear factor signaling for the expression of IL-2 and its receptor, which leads to a decrease in the activation of T cells. This mechanism is based on the inhibition of the activation of T lymphocytes by binding to various intracellular proteins, thus inhibiting the activity of calcineurin phosphatase.16 However, other authors have suggested that CNIs could also have a nonimmunological effect on podocytes.8 A dose-dependent effect has been described on the vascular resistance of the afferent artery, which leads to a reduction in renal blood flow and glomerular filtration pressure and, consequently, a decrease in filtered proteinuria.17 In addition, some researchers have suggested that CNIs can improve the size and load selectivity of the glomerular filtration barrier.18 Finally, their effects could be explained by the protection they provide to the phosphorylation of synaptopodin, which is crucial for the integrity of the actin cytoskeleton of podocytes.8 Although other hypotheses cannot be excluded, the data clearly indicate that, at least to a large extent, the beneficial effects of CNIs on corticosteroid-resistant FSGS could be related to a reduction in the activation of T lymphocytes.
A notable finding in terms of sociodemographic data is that all patients who achieved a total response were pediatric patients. This finding underscores the relevance of age as a determining factor in the response to treatment with CNIs in patients with corticosteroid-resistant FSGS. The efficacy observed exclusively in pediatric patients could be related to differences in the pathogenesis of kidney disease between children and adults or to the fact that the podocyte lesions in adults could be found, in many cases, to be more advanced, which would preclude a complete response.
Although the distribution of the populations of DR+ CD4 and CD8 lymphocytes and that of regulatory T lymphocytes differ depending on the type of response to calcineurin inhibitors, none of these parameters are useful for predicting the response.
This research has several limitations that should be considered when interpreting the results. First, the proposed cutoff for soluble CD25 levels is not supported by previous evidence in the literature, and exploring its variability across different cohorts or clinical conditions is relevant for evaluating its general applicability. In addition, the sample size was relatively small, which may limit the ability to generalize the findings to broader populations, especially with respect to subgroup analyses, such as comparisons between pediatric and adult patients. Future research with larger samples could validate and expand these results. Although the study was conducted in multiple centers, the differences in clinical practice between them could have influenced the results; thus, it would be advisable to standardize clinical protocols in future multicenter studies. Similarly, the findings have not been validated in external cohorts or in different population contexts; thus, it is essential to replicate these results in other populations to confirm their clinical applicability. In addition, although the level of soluble CD25 showed a significant predictive value, the approach is limited to a single biomarker, which could be expanded by including other complementary biomarkers that improve the diagnostic accuracy and the prediction of the response to treatment. Finally, the follow-up period was limited, preventing the evaluation of the long-term effects of calcineurin inhibitors on the progression of chronic kidney disease and renal survival. Therefore, a more extensive follow-up would allow a better understanding of the lasting effects of these treatments.
ConclusionThis study supports the idea that the soluble CD25 level could be a useful predictor of treatment response in patients with corticosteroid-resistant FSGS. Analysis revealed that soluble CD25 concentrations greater than 342 pg/mL are associated with high sensitivity for identifying the response to treatment with CNIs, although they do not predict the expected type of remission. The implementation of this diagnostic approach could reduce the exposure of patients to the long-term side effects of CNIs by identifying more precisely those who could benefit from this immunosuppressive treatment. However, it is crucial that these findings be validated in larger prospective studies and that a comprehensive evaluation of the response to treatment be considered, taking into account other clinical and biological factors.
FundingThis work was not supported by any funding.
The authors of this manuscript have no conflicts of interest to declare.
This work was supported by the Immunohistochemistry and Histology Unit of IRBLleida.