
At present, there is a high incidence of elderly patients with advanced chronic kidney disease (CKD) and it is important to know the long term progression and the factors that influence it.
ObjectivesTo analyse the progression of advanced CKD in elderly patients and the influence of bone-mineral metabolism.
MethodsRetrospective study of 125 patients ≥70years of age with CKD stages 4–5 who started follow-up from January 1, 2007 to December 31, 2008, showing the progression of CKD (measured by the slope of the regression line of the estimated glomerular filtration rate [eGFR] by MDRD-4) over 5years.
ResultsProgression in the entire group (median and 25th and 75th percentiles): −1.15 (−2.8/0.17) ml/min/1.73m2/year, CKD-4: −1.3 (−2.8/0.03) ml/min/1.73m2/year, CKD-5: −1.03 (−3.0/0.8) ml/min/1.73m2/year; the slope of the regression line was positive in 35 patients (28%: CKD does not progress) and negative in 90 patients (72%: CKD progresses). Negative correlation (Spearman) (slower progression): PTH, albumin/Cr ratio and daily Na excretion (all baseline measurements). No correlation with eGFR, serum P, urinary P excretion, protein intake and intake of P (all baseline measurements). In the linear regression analysis (dependent variable: slope of progression): albuminuria and PTH (both at baseline measurements) influenced this variable independently. Logistic regression (progresses vs. does not progress): PTH, albuminuria and eGFR (all at baseline measurements) influenced significantly.
ConclusionsIn our group of elderly patients, impairment of renal function is slow, particularly in CKD-5 patients. Albuminuria and PTH at baseline levels are prognostic factors in the evolution of renal function.
En la actualidad hay una elevada incidencia de pacientes ancianos con enfermedad renal crónica avanzada (ERCA), siendo importante conocer la evolución a largo plazo y qué factores influyen.
ObjetivosAnalizar la evolución de la ERCA en pacientes ancianos y la influencia del metabolismo óseo-mineral.
MétodosEstudio retrospectivo de 125 pacientes ≥70años con ERC 4-5, que iniciaron seguimiento desde el 1 de enero de 2007 al 31 de diciembre de 2008, observándose la progresión de la ERC (medida con la pendiente de la línea de regresión del filtrado glomerular estimado [FGe] obtenido mediante MDRD-4) durante 5años.
ResultadosProgresión grupo completo (mediana y percentiles 25 y 75): –1,15 (–2,80/0,17) ml/min/1,73m2/año, ERC-4: –1,3 (–2,8/0,03) ml/min/1,73m2/año, ERC-5: –1,03 (–3/0,8) ml/min/1,73m2/año; pendiente de línea de regresión positiva en 35 pacientes (28%: ERC no progresa) y negativa 90 pacientes (72%: ERC progresa). Correlación (Spearman) negativa (progresión más lenta): hormona paratiroidea (PTH), albuminuria/Cr, excreción diaria de Na (todos basales). No se correlacionó con FGe, P sérico, excreción urinaria de P, ingesta proteica e ingesta de P (todas basales). Regresión lineal (variable dependiente: pendiente de progresión): albuminuria y PTH (ambos a nivel basal) influyeron de forma independiente en dicha variable. Regresión logística (progresa vs. no progresa): PTH, albuminuria y FGe (todos basales) influyeron de forma significativa.
ConclusionesEn nuestro grupo de pacientes de edad avanzada el deterioro de la función renal es muy lento, especialmente en los pacientes en estadio5. La albuminuria y la PTH al inicio del seguimiento son factores pronósticos en la evolución de su función renal.
In recent years the number of elderly patients with advanced chronic kidney disease (ACKD) has increased. In some series it has been estimated that the number has doubled during the past 25years.1,2 Factors, such as increased life expectancy and medical advances, have contributed to an increase in time exposure for the development of ACKD, mainly associated with atherosclerosis and diabetes mellitus (DM); in the past, these patients died before reaching ACKD.3
Patients with ACKD have specific characteristics: increased comorbidity, difficulty regarding the vascular access, need (sometimes not met) for family support for transportation to the haemodialysis centre or help with peritoneal dialysis. Renal replacement therapy may improve survival but it may also increase morbidity, decrease quality of life and involves enormous costs. The need to find factors that prevent or slow down the progression of CKD in this aged patients is a primary objective in health care.
Recent observational studies on the general population,4–6 without stratifying by age, suggest that elevated serum phosphate (P) and parathyroid hormone (PTH) levels may be responsible for a faster rate of CKD progression, although the aetiopathogenic mechanisms are not totally clear. Among the possible underlying mechanisms are the vascular and renal tubular calcification, causing cell damage and fibroblast proliferation. An elevated serum phosphate level induces osteoblast differentiation of vascular smooth muscle cells and subsequent mineralisation of the vascular wall due to vesicle and apoptotic body secretion.7–9 In animal studies, treatment with phosphate binders slows down the vascular calcification process, even in the presence of high levels of calcium and calcitriol.10 Another proposed mechanism is phosphate induced endothelial injury due to down-regulation of annexin II (involved in various biological processes of the endothelial cell and in angiogenesis),11 FGF-23 (acting on the FGFR1-klotho receptor) increases as GFR declines in an attempt to facilitate the urinary excretion of phosphate, may also play a role in CKD progression, but the mechanism is not well defined. One recent study showed that FGF23 was the marker most significantly related to CKD progression in patients with diabetic nephropathy.12
Since these parameters are at least partially modifiable with treatment, it is important to evaluate them in a population of older patients with ACKD.
The purpose of our study was to analyse whether parameters of bone and mineral metabolism predict CKD progression in a group of elderly patients (≥70 years of age) followed at our ACKD clinic for 5years.
Material and methodsWe performed a retrospective, observational and longitudinal study that included 125 patients aged 70years or older with CKD stages 4–5 who had been followed in our ACKD clinics since January 1st 2007 to December 31st 2013, and all patients had a minimum of 6months of follow-up.
We analysed demographic data, comorbidity (general comorbidity measured by the Charlson index, particularly DM and ischaemic heart disease), body mass index (BMI), estimated glomerular filtration rate (eGFR) using the 4-variable Modification of Diet in Renal Disease (MDRD-4) study,13 serum levels of calcium, phosphate, PTH, 25(OH) vitamin D. Urine parameters (in 24h urine collection): calcium, phosphate, creatinine, urea, sodium, albumin, phosphate/creatinine ratio (in g) urine albumin/creatinine ratio (in g). Protein intake, phosphate intake, fractional excretion of phosphate and tubular phosphate reabsorption were estimated. Data on treatment with active vitamin D (paricalcitol and calcitriol) and nutritional (calcifediol) derivatives, and phosphate binders (calcium binders, lanthanum carbonate and hydrochloride or sevelamer carbonate) were also collected from the patients’ medical records.
Biochemical measurements were performed using standardised automatic methods. Creatinine level was determined by the Jaffe reaction. Albuminuria was measured in Beckman AU 2700. Plasma concentrations of 25(OH) and PTH were measured by quimioluminescence (ECL) (Roche Diagnostics, Cobas 6000).
The Maroni equation14 [protein intake (g/day)=6.25×((24-h urine ureag)/2.14)×(0.031×weight kg)] was used to calculate the daily protein intake and was normalised by weight (nPNA). Daily phosphate intake was estimated from protein intake by applying the Boaz equation15 [protein intake (mg)/day=128+(14×g of protein ingested)].
All biochemical parameters analysed as the baseline value and as the mean value during the follow-up period.
Fractional excretion of phosphate (FEPi) was calculated according to the following formula: (P urine (mg/dl)×Cr plasma/P plasma×Cr urine)×100.
The change in GFR was the main outcome variable (slope of decline in GFR) and it was estimated in each patient as the slope of the line resulting from the linear regression between the eGFR and the period of follow-up (months); this parameter was expressed as ml/min/1.73m2/year. The negative sign of this value was considered as CKD progression, otherwise means stable of renal function.
For the statistical analysis, SPSS version 19.0 (SPSS, Chicago, USA) was used. Since virtually all of the variables fail to show a normal distribution, the results are expressed as the median and interquartile range. The non-parametric Mann–Whitney U test was used to compare 2 independent populations. The qualitative variables were compared by chi-square test. To evaluate what variables were associated with the slope of regression line regarding kidney disease progression, we used a bivariate correlation (Spearman's rank correlation coefficient) and a multivariate correlation. The logistic regression analysis was used to determine the variables that best represented the patients who remained with stable renal function.
Given the dependence of different variables of bone and mineral metabolism maintained with the level of renal function, the analysis was performed in the whole group, and separate analyses were performed in patients with either CKD stages 4 and 5, so the eGFR was more homogeneous in each one of these groups.
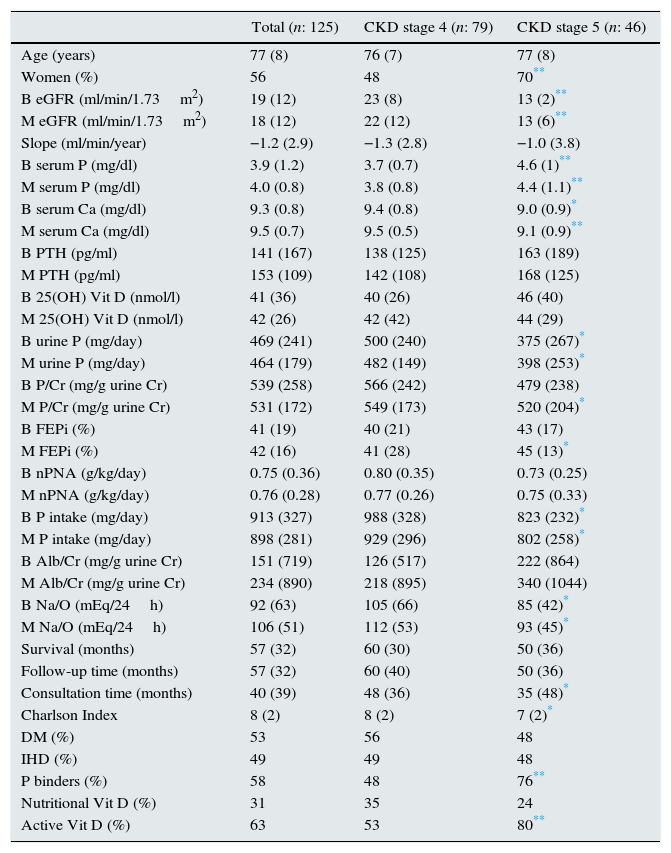
ResultsThe clinical and analytical characteristics of the study group (total and separated by CKD stages 4–5) are shown in Table 1.
Characteristics of all patients: total and CKD stages 4 and 5.
| Total (n: 125) | CKD stage 4 (n: 79) | CKD stage 5 (n: 46) | |
|---|---|---|---|
| Age (years) | 77 (8) | 76 (7) | 77 (8) |
| Women (%) | 56 | 48 | 70** |
| B eGFR (ml/min/1.73m2) | 19 (12) | 23 (8) | 13 (2)** |
| M eGFR (ml/min/1.73m2) | 18 (12) | 22 (12) | 13 (6)** |
| Slope (ml/min/year) | −1.2 (2.9) | −1.3 (2.8) | −1.0 (3.8) |
| B serum P (mg/dl) | 3.9 (1.2) | 3.7 (0.7) | 4.6 (1)** |
| M serum P (mg/dl) | 4.0 (0.8) | 3.8 (0.8) | 4.4 (1.1)** |
| B serum Ca (mg/dl) | 9.3 (0.8) | 9.4 (0.8) | 9.0 (0.9)* |
| M serum Ca (mg/dl) | 9.5 (0.7) | 9.5 (0.5) | 9.1 (0.9)** |
| B PTH (pg/ml) | 141 (167) | 138 (125) | 163 (189) |
| M PTH (pg/ml) | 153 (109) | 142 (108) | 168 (125) |
| B 25(OH) Vit D (nmol/l) | 41 (36) | 40 (26) | 46 (40) |
| M 25(OH) Vit D (nmol/l) | 42 (26) | 42 (42) | 44 (29) |
| B urine P (mg/day) | 469 (241) | 500 (240) | 375 (267)* |
| M urine P (mg/day) | 464 (179) | 482 (149) | 398 (253)* |
| B P/Cr (mg/g urine Cr) | 539 (258) | 566 (242) | 479 (238) |
| M P/Cr (mg/g urine Cr) | 531 (172) | 549 (173) | 520 (204)* |
| B FEPi (%) | 41 (19) | 40 (21) | 43 (17) |
| M FEPi (%) | 42 (16) | 41 (28) | 45 (13)* |
| B nPNA (g/kg/day) | 0.75 (0.36) | 0.80 (0.35) | 0.73 (0.25) |
| M nPNA (g/kg/day) | 0.76 (0.28) | 0.77 (0.26) | 0.75 (0.33) |
| B P intake (mg/day) | 913 (327) | 988 (328) | 823 (232)* |
| M P intake (mg/day) | 898 (281) | 929 (296) | 802 (258)* |
| B Alb/Cr (mg/g urine Cr) | 151 (719) | 126 (517) | 222 (864) |
| M Alb/Cr (mg/g urine Cr) | 234 (890) | 218 (895) | 340 (1044) |
| B Na/O (mEq/24h) | 92 (63) | 105 (66) | 85 (42)* |
| M Na/O (mEq/24h) | 106 (51) | 112 (53) | 93 (45)* |
| Survival (months) | 57 (32) | 60 (30) | 50 (36) |
| Follow-up time (months) | 57 (32) | 60 (40) | 50 (36) |
| Consultation time (months) | 40 (39) | 48 (36) | 35 (48)* |
| Charlson Index | 8 (2) | 8 (2) | 7 (2)* |
| DM (%) | 53 | 56 | 48 |
| IHD (%) | 49 | 49 | 48 |
| P binders (%) | 58 | 48 | 76** |
| Nutritional Vit D (%) | 31 | 35 | 24 |
| Active Vit D (%) | 63 | 53 | 80** |
Parameters expressed as median (interquartile range); DM: diabetes mellitus; IHD: ischaemic heart disease; eGFR (MDRD-4): estimated glomerular filtration rate using the MDRD-4 equation (4-variable Modification of Diet in Renal Disease study); CKD: chronic kidney disease; BMI: body mass index; PTH: parathyroid hormone; urine P: 24-h urine phosphate excretion; P/Cr: urine P excretion per gram of urinary creatinine; FEPi: fractional excretion of phosphate; Alb/Cr: albumin excretion per gram of urinary creatinine; nPNA: protein intake normalised by weight; B: baseline value of the variable (start of the follow-up); M: mean value of the variable (during follow-up).
The aetiology of CKD in the 125 patients was as follows: vascular nephropathy in 62 patients (49.6%), diabetic nephropathy in 33 patients (26.4%), chronic tubulointerstitial nephropathy in 13 patients (10.4%), non-associated CKD in 8 patients (6.4%), polycystic kidney disease in 4 patients (3.2%), glomerulopathy in 3 patients (2.2%), and other causes in 2 patients (1.6%).
During the 5 years of follow-up, 77 patients (61.6%) died: 61 during their clinic-based follow-up and 16 on dialysis; 48 patients (38.4%) were still alive at the end of the observational period: 31 patients at the clinic and 17 on dialysis. A total of 33 of the 125 patients started dialysis (26.4%). No patient received a kidney transplant.
The percentage of patients with mean calcium, phosphate and PTH values within the range of Spanish Society of Nephrology's recommendations16 (normal values for patients without CKD, except for PTH) were as follows: in patients with CKD stage 4 (n=79), mean levels of PTH, calcium and phosphate were within the recommended range in 27%, 95% and 86%, respectively, and in patients with CKD stage 5 (n=46), the values were 49%, 93% and 56%, respectively.
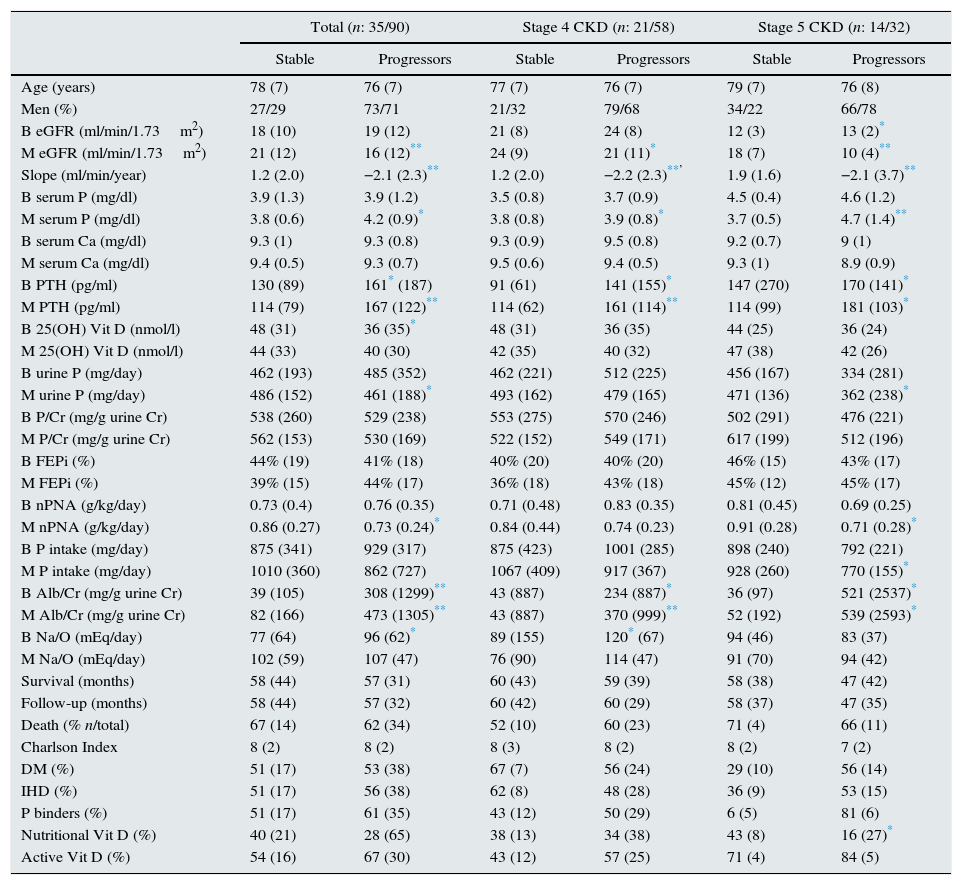
The slope of progression of renal failure was positive in 35 patients (28%), considered as stable CKD, and negative in 90 patients (72%), considered as patients with CKD progression. Table 2 shows the results of the comparison of both groups.
Comparison of patients with stable CKD vs. progressive CKD. All patients together and separated into CKD stages 4 and 5.
| Total (n: 35/90) | Stage 4 CKD (n: 21/58) | Stage 5 CKD (n: 14/32) | ||||
|---|---|---|---|---|---|---|
| Stable | Progressors | Stable | Progressors | Stable | Progressors | |
| Age (years) | 78 (7) | 76 (7) | 77 (7) | 76 (7) | 79 (7) | 76 (8) |
| Men (%) | 27/29 | 73/71 | 21/32 | 79/68 | 34/22 | 66/78 |
| B eGFR (ml/min/1.73m2) | 18 (10) | 19 (12) | 21 (8) | 24 (8) | 12 (3) | 13 (2)* |
| M eGFR (ml/min/1.73m2) | 21 (12) | 16 (12)** | 24 (9) | 21 (11)* | 18 (7) | 10 (4)** |
| Slope (ml/min/year) | 1.2 (2.0) | −2.1 (2.3)** | 1.2 (2.0) | −2.2 (2.3)**’ | 1.9 (1.6) | −2.1 (3.7)** |
| B serum P (mg/dl) | 3.9 (1.3) | 3.9 (1.2) | 3.5 (0.8) | 3.7 (0.9) | 4.5 (0.4) | 4.6 (1.2) |
| M serum P (mg/dl) | 3.8 (0.6) | 4.2 (0.9)* | 3.8 (0.8) | 3.9 (0.8)* | 3.7 (0.5) | 4.7 (1.4)** |
| B serum Ca (mg/dl) | 9.3 (1) | 9.3 (0.8) | 9.3 (0.9) | 9.5 (0.8) | 9.2 (0.7) | 9 (1) |
| M serum Ca (mg/dl) | 9.4 (0.5) | 9.3 (0.7) | 9.5 (0.6) | 9.4 (0.5) | 9.3 (1) | 8.9 (0.9) |
| B PTH (pg/ml) | 130 (89) | 161* (187) | 91 (61) | 141 (155)* | 147 (270) | 170 (141)* |
| M PTH (pg/ml) | 114 (79) | 167 (122)** | 114 (62) | 161 (114)** | 114 (99) | 181 (103)* |
| B 25(OH) Vit D (nmol/l) | 48 (31) | 36 (35)* | 48 (31) | 36 (35) | 44 (25) | 36 (24) |
| M 25(OH) Vit D (nmol/l) | 44 (33) | 40 (30) | 42 (35) | 40 (32) | 47 (38) | 42 (26) |
| B urine P (mg/day) | 462 (193) | 485 (352) | 462 (221) | 512 (225) | 456 (167) | 334 (281) |
| M urine P (mg/day) | 486 (152) | 461 (188)* | 493 (162) | 479 (165) | 471 (136) | 362 (238)* |
| B P/Cr (mg/g urine Cr) | 538 (260) | 529 (238) | 553 (275) | 570 (246) | 502 (291) | 476 (221) |
| M P/Cr (mg/g urine Cr) | 562 (153) | 530 (169) | 522 (152) | 549 (171) | 617 (199) | 512 (196) |
| B FEPi (%) | 44% (19) | 41% (18) | 40% (20) | 40% (20) | 46% (15) | 43% (17) |
| M FEPi (%) | 39% (15) | 44% (17) | 36% (18) | 43% (18) | 45% (12) | 45% (17) |
| B nPNA (g/kg/day) | 0.73 (0.4) | 0.76 (0.35) | 0.71 (0.48) | 0.83 (0.35) | 0.81 (0.45) | 0.69 (0.25) |
| M nPNA (g/kg/day) | 0.86 (0.27) | 0.73 (0.24)* | 0.84 (0.44) | 0.74 (0.23) | 0.91 (0.28) | 0.71 (0.28)* |
| B P intake (mg/day) | 875 (341) | 929 (317) | 875 (423) | 1001 (285) | 898 (240) | 792 (221) |
| M P intake (mg/day) | 1010 (360) | 862 (727) | 1067 (409) | 917 (367) | 928 (260) | 770 (155)* |
| B Alb/Cr (mg/g urine Cr) | 39 (105) | 308 (1299)** | 43 (887) | 234 (887)* | 36 (97) | 521 (2537)* |
| M Alb/Cr (mg/g urine Cr) | 82 (166) | 473 (1305)** | 43 (887) | 370 (999)** | 52 (192) | 539 (2593)* |
| B Na/O (mEq/day) | 77 (64) | 96 (62)* | 89 (155) | 120* (67) | 94 (46) | 83 (37) |
| M Na/O (mEq/day) | 102 (59) | 107 (47) | 76 (90) | 114 (47) | 91 (70) | 94 (42) |
| Survival (months) | 58 (44) | 57 (31) | 60 (43) | 59 (39) | 58 (38) | 47 (42) |
| Follow-up (months) | 58 (44) | 57 (32) | 60 (42) | 60 (29) | 58 (37) | 47 (35) |
| Death (% n/total) | 67 (14) | 62 (34) | 52 (10) | 60 (23) | 71 (4) | 66 (11) |
| Charlson Index | 8 (2) | 8 (2) | 8 (3) | 8 (2) | 8 (2) | 7 (2) |
| DM (%) | 51 (17) | 53 (38) | 67 (7) | 56 (24) | 29 (10) | 56 (14) |
| IHD (%) | 51 (17) | 56 (38) | 62 (8) | 48 (28) | 36 (9) | 53 (15) |
| P binders (%) | 51 (17) | 61 (35) | 43 (12) | 50 (29) | 6 (5) | 81 (6) |
| Nutritional Vit D (%) | 40 (21) | 28 (65) | 38 (13) | 34 (38) | 43 (8) | 16 (27)* |
| Active Vit D (%) | 54 (16) | 67 (30) | 43 (12) | 57 (25) | 71 (4) | 84 (5) |
Parameters expressed as median (interquartile range); B: baseline value of the variable (start of follow-up); M: mean value of the variable (during follow-up); DM: diabetes mellitus; IHD: ischaemic heart disease; eGFR (MDRD-4): estimated glomerular filtration rate using the MDRD-4 equation (4-variable Modification of Diet in Renal Disease study); CKD: chronic kidney disease; BMI: body mass index; PTH: parathyroid hormone; P urine: 24-h urine phosphate excretion; P/Cr: urinary P excretion per gram of urinary creatinine; FEPi: fractional excretion of phosphate; Alb/Cr: albumin excretion per gram of urinary creatinine; nPNA: protein intake normalised by weight.
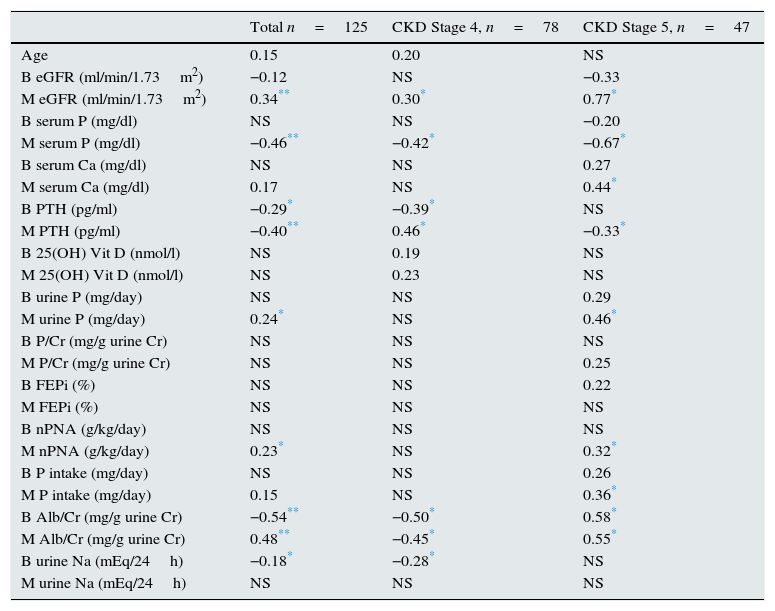
Table 3 shows the correlation of the slope of the progression of renal failure with different variables, both in the entire population and in the groups separated according to stage of CKD.
Correlation coefficients of the slope of kidney disease progression with several independent variables. All patients and separated according to CKD stages 4 and 5.
| Total n=125 | CKD Stage 4, n=78 | CKD Stage 5, n=47 | |
|---|---|---|---|
| Age | 0.15 | 0.20 | NS |
| B eGFR (ml/min/1.73m2) | −0.12 | NS | −0.33 |
| M eGFR (ml/min/1.73m2) | 0.34** | 0.30* | 0.77* |
| B serum P (mg/dl) | NS | NS | −0.20 |
| M serum P (mg/dl) | −0.46** | −0.42* | −0.67* |
| B serum Ca (mg/dl) | NS | NS | 0.27 |
| M serum Ca (mg/dl) | 0.17 | NS | 0.44* |
| B PTH (pg/ml) | −0.29* | −0.39* | NS |
| M PTH (pg/ml) | −0.40** | 0.46* | −0.33* |
| B 25(OH) Vit D (nmol/l) | NS | 0.19 | NS |
| M 25(OH) Vit D (nmol/l) | NS | 0.23 | NS |
| B urine P (mg/day) | NS | NS | 0.29 |
| M urine P (mg/day) | 0.24* | NS | 0.46* |
| B P/Cr (mg/g urine Cr) | NS | NS | NS |
| M P/Cr (mg/g urine Cr) | NS | NS | 0.25 |
| B FEPi (%) | NS | NS | 0.22 |
| M FEPi (%) | NS | NS | NS |
| B nPNA (g/kg/day) | NS | NS | NS |
| M nPNA (g/kg/day) | 0.23* | NS | 0.32* |
| B P intake (mg/day) | NS | NS | 0.26 |
| M P intake (mg/day) | 0.15 | NS | 0.36* |
| B Alb/Cr (mg/g urine Cr) | −0.54** | −0.50* | 0.58* |
| M Alb/Cr (mg/g urine Cr) | 0.48** | −0.45* | 0.55* |
| B urine Na (mEq/24h) | −0.18* | −0.28* | NS |
| M urine Na (mEq/24h) | NS | NS | NS |
B: baseline value of the variable (start of follow-up); M: mean value of the variable (during follow-up);FEPi: fractional excretion of phosphate; CKD: chronic kidney disease; eGFR (MDRD-4): estimated glomerular filtration rate using the MDRD-4 equation (4-variable Modification of Diet in Renal Disease study); nPNA: protein intake normalised by weight; urine P: 24-h urine phosphate excretion; P/Cr: urine P excretion per gram of urinary creatinine; PTH: parathyroid hormone. Alb/Cr: albumin excretion per gram of urinary creatinine; P intake (mg/day): dietary intake of P; Na urine: urinary Na excretion in 24h.
The phosphate and PTH values are dependent on different variables: degree of GFR, intake of calcium and phosphate, and administration of phosphate binders and vitamin D.
To neutralise the influence of eGFR on the phosphate and PTH levels in the entire group was separated by tertiles of eGFR (tertile 1), median 13 (11–14) ml/min/1.73m2; tertile 2, median 19 (16–21) ml/min/1.73m2, and tertile 3, median 27 (26–28ml/min/1.73m2). In each eGFR tertile, the median phosphate values were determined, and patients were grouped into 2 (group A for values above the median and group B values below the median). Then it was analysed whether the slope of progression of kidney failure was significantly different between these two groups. The same procedure was used for PTH: group A and B included patients with PTH values above and below the median respectively.
In relation to phosphate, there were no significant differences between groups A and B in tertiles 1: −0.91(−2.63±0.56) vs. −1.05 (−4.30±0.82) ml/min/1.73m2/year (p=0.6) and 3: −1.64 (−3.00±0.54) vs. −0.62 (−2.8±−0.28) ml/min/1.73m2/year (p=0.4), almost significant level in tertile 2: −0.19 (−2.43±1.34) vs. 2.04 (−2.97±0.08) ml/min/1.73m2/year (p=0.06).
PTH values were analysed in the same manner, as the phosphate values. The slope of group A was significantly higher that group B in tertiles 1: −0.62 (−1.95±1.9) vs. −1.6 (−5±−0.12) ml/min/1.73m2/year (p=0.07) and 2: −0.12 (−2.3±0.70) vs. −2.1 (−3.2±−0.29) (p=0.06) and tertile 3: −0.78 (−2.37±−0.13) vs. −2.56 (−3.07±−0.46) ml/min/1.73m2/year (p=0.1). The levels of phosphate and eGFR were not significantly different when comparing group A vs. group B in each tertile.
A second approach consisted in studying the patients in CKD stage 4 and 5 separately. In each stage, patients were separated into 2 groups with serum phosphate above or below the median. The same was done with the PTH.
No significant differences were found in the rate of progression of kidney failure between the two phosphate groups (P: 3.2 [2.9–3.4] vs. 4.0 [3.9–4.4] mg/dl) in stage 4, or in stage 5 (P: median 3.2 [2.9–3.4] vs. 4.0 [3.9–4.4] mg/dl).
By contrast, we found significant differences in the rate of progression of kidney failure between the patients with PTH above and below the median (PTH: median 87 [66–115] vs. 210 [162–351] pg/ml; p=0.04) in stage 4, and in stage 5 (PTH: median 102 [71–134] vs. 284 [209–406] pg/dl; p=0.03), with a faster progression rate in the group with higher PTH. The median PTH was not statistically different in CKD 4 and 5.
Finally, patients were grouped into tertiles phosphate levels in stage 4 and in stage 5. There was not significant differences by ANOVA test in the slopes of progression of kidney failure between the different tertiles for phosphate, in both stage 4 and in stage 5. In patients separated by tertiles of PTH it was found that among patients in CKD stage 4 the lowest tertile of PTH was associated with a lower progression of kidney failure as compared with the other 2 tertiles (p=0.04). The same analysis in stage 5 shows that the lower tertile of PTH has a reduced progression of renal failure, as compared with the highest tertile (p=0.01) and it almost reach significant difference vs. the intermediate tertile (p=0.07).
Protein intake, as measured by nPNA was also analysed. Patients were separated into those with protein intake above and below the median of 0.8g/kg/day (0.61–0.96g/kg/day). When compared to each other, there was no significant difference with respect to eGFR or with the slope of progression of renal failure. If patients were divided according to the median of estimated phosphate intake (988mg/day [774–1102mg/day]), no significant differences were observed in eGFR or in the slope of progression of kidney failure, in the total group as well as separated by stages.
Fifty percent of the patients with a serum phosphate value lower than the median received phosphate binders, compared with 67% of patients with serum phosphate concentration above the median (p=0.03); 53% of patients a serum phosphate value lower than the median were treated with active vitamin D (calcitriol, paricalcitol), compared with 74% of patients with higher phosphate (p=0.01). As for treatment with calcifediol, there were no differences between the two groups (30% vs. 31%).
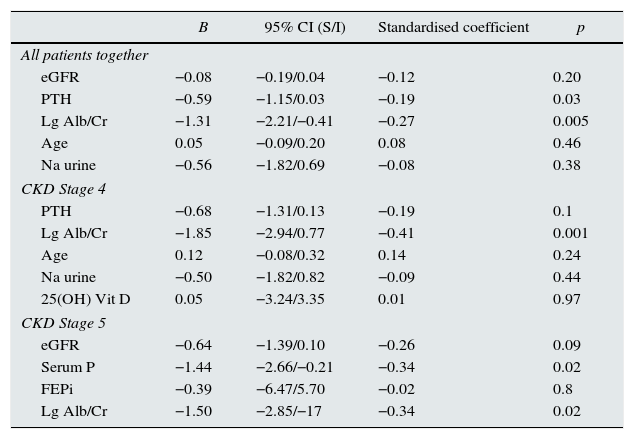
Multivariate analysis was performed, using the slope of progression as a dependent variable, and the independent variables that showed significance in the bivariate correlation analysis. The analysis was performed the entire group and separately, according to stages (Table 4). In some cases, a variable was included that was close to be statistical significant and it was considered to be clinically relevant.
Linear regression. Dependent variable: slope of kidney disease progression. All patients and separated into CKD stages 4 and 5.
| B | 95% CI (S/I) | Standardised coefficient | p | |
|---|---|---|---|---|
| All patients together | ||||
| eGFR | −0.08 | −0.19/0.04 | −0.12 | 0.20 |
| PTH | −0.59 | −1.15/0.03 | −0.19 | 0.03 |
| Lg Alb/Cr | −1.31 | −2.21/−0.41 | −0.27 | 0.005 |
| Age | 0.05 | −0.09/0.20 | 0.08 | 0.46 |
| Na urine | −0.56 | −1.82/0.69 | −0.08 | 0.38 |
| CKD Stage 4 | ||||
| PTH | −0.68 | −1.31/0.13 | −0.19 | 0.1 |
| Lg Alb/Cr | −1.85 | −2.94/0.77 | −0.41 | 0.001 |
| Age | 0.12 | −0.08/0.32 | 0.14 | 0.24 |
| Na urine | −0.50 | −1.82/0.82 | −0.09 | 0.44 |
| 25(OH) Vit D | 0.05 | −3.24/3.35 | 0.01 | 0.97 |
| CKD Stage 5 | ||||
| eGFR | −0.64 | −1.39/0.10 | −0.26 | 0.09 |
| Serum P | −1.44 | −2.66/−0.21 | −0.34 | 0.02 |
| FEPi | −0.39 | −6.47/5.70 | −0.02 | 0.8 |
| Lg Alb/Cr | −1.50 | −2.85/−17 | −0.34 | 0.02 |
eGFR (MDRD-4): estimated glomerular filtration rate using the MDRD-4 equation (4-variable Modification of Diet in Renal Disease study); PTH: parathyroid hormone. Lg Alb/Cr: base-10 log transformation of albumin excretion per gram of urinary creatinine; Na urine: urine sodium excretion over 24 hours; P: serum phosphate level; FEPi: fractional excretion of phosphate
All variables at baseline (start of follow-up).
The results of the present study show that in a group of elderly patients with ACKD (CKD stages 4 and 5) further impairment in renal function progresses slowly over a 5-year follow-up. The variables that most influenced CKD progression were proteinuria and serum PTH concentration. In CKD stage 5 patients there was an association between baseline serum phosphate and progression of renal disease. We found no association of progression of renal function impairment with age, overall comorbidity, Diabetes, ischaemic heart disease and gender.
The methodology normally used to measure renal function, i.e. eGFR using the MDRD-4 equation, has significant limitations (the main one, concerning our study, is that it has not been validated for patients over 70years of age). Other formulas, also have these limitations, but they are widely used so results are easily comparable.17 In the present study, the method used to measure kidney disease progression: slope of the eGFR regression line during the follow-up period, defines the tendency of renal function impairment and it is better than other criteria, such as the need for regular dialysis, progression to CKD stage 5 (some patients enter the study already at this stage and many others die before reaching it), doubling baseline creatinine or percent reduction baseline eGFR. The method used is recommended in clinical trials to evaluate drugs that may improve kidney disease progression.18
Elderly patients have different factors that may influence kidney disease progression. Among the negative influences are the presence of cardiovascular comorbidity (which implies greater haemodynamic instability and greater susceptibility to low cardiac output and hypovolaemia); among the positive influences, there is a lower overall intake and a lower protein intake, and therefore less phosphate intake,4 also they have less incidence of some of the morbid processes, such as cancer and possibly also CKD.19
In our group of elderly patients, progression was slow (median of 1.15ml/min/1.73m2/year), especially considering that the baseline renal function (e GFR) was reduced, (19ml/min/1.73m2), the rate of progression was similar to people of the same age (>70years) without kidney disease.20 In one study carried out in Spain19 in patients over 65years of age; (median 83years) with CKD stages 3–4 (eGFR 40–60ml/min/1.73m2) followed for 5years, eGFR fell at a rate of 0.52ml/min/1.73m2/year. Furthermore, the renal function deterioration in our patients is relatively low as compared with that of CKD patients not stratified by age; in these patients slow progression is considered if the fall in eGFR is <3ml/min/1.73m2, and rapid progression if there is a decline of >3ml/min/1.73m2.21 In 2 recent studies done in Spain5,22 involving patients followed in an ACKD outpatient clinic, using the same method to measure CKD employed as in our study, (although elderly patients were not analysed separately), the mean decline of renal function was somewhat higher (1.64 and 2.37ml/min/1.73m2/year, in the respective studies), and in both studies patient started with a reduced eGFR similar to our patients (22±7 and 15±6ml/min/1.73m2 respectively). In both studies, the follow-up time was markedly shorter so precision should have been less which may justify the discrepancy with our results. It is likely that if patients >70years were analysed separately, the rate of renal function deterioration may have resulted to be similar to our study. The close care provided at the ACKD clinic,23,24 may have also contributed to a slower progression in our patients, all of whom underwent follow-up at a specific ACKD clinic for at least 6months and a median of 40months.
In our elderly patients, it was found that albuminuria and PTH, both in the univariate and in the multivariate analyses, have a significant adverse effect on the progression renal function impairment; even after being adjusted for baseline GFR and other related variables.
The baseline phosphate level was not associated to progression, as was evident in our study, by comparing progression in eGFR tertiles and in groups with phosphate levels above or below the median. Also, tertiles of baseline phosphate did not show differences in disease progression. It is likely that the findings by others showing a significant effect of serum phosphate concentration in CKD progression (5, 22), may be explained by the colinearity of serum levels of phosphate and the degree of renal function impairment (in our study: R2:0.557; p<0.001), and therefore in the progression of GFR deterioration.
Baseline PTH levels were associated to progression of kidney failure in groups with similar baseline renal function and in the other various analyses performed. The mechanism whereby PTH may impair renal function could be related to secondary hyperparathyroidism associated with CKD, being a surrogate parameter of excess body phosphate and elevated FGF-23, which does not manifest itself or it is not expressed in serum phosphate or the urinary excretion of phosphate. The secretion of PTH increases in the early stages of kidney disease, initially stimulated by low calcitriol levels and phosphate accumulation, and it causes an increase in FGF-23. Failing kidneys could not eliminate the phosphate load ingested, without the phosphaturic effect of PTH and FGF-23. Although these mechanisms attempt to correct the initial pathogenic event (excess body content of phosphate), these changes (elevated PTH) also cause pathological effects, such as vascular calcification, renal tubular calcification and bone disease.25 In our study, baseline PTH levels were not correlated with baseline GFR or baseline serum phosphate, it was correlated, however, with baseline fractional excretion of phosphate (r=0.186, p=0.04). Therefore PTH di not correlate with renal function at baseline and with other mechanisms that increase PTH secretion, such as increased phosphate intake, not well quantified by phospahturia or by the other formulas (Boaz) used in this work that include the measurement on 24-h urine collection; and we admit that data from 24h collections are some times difficult to reproduce. It might be deduced that PTH level is an indicator of kidney injury caused by disturbed phosphate–calcium metabolism, and it is more sensitive than phosphataemia. FGF-23 levels, not measured in this study, could have guided us assessing body load of phosphate. It seems that with lower filtration rates (stage 5), the role of baseline serum phosphate as a marker of renal function deterioration or as a pathogenic factor becomes important at its effect is independent of the concomitant reduction in renal function. Other factors, besides diet, influence phosphataemia, such as changes in the tubular management of phosphate, bone, muscle, the effects of sex hormones and changes in the exchange of phosphate between intra- and extra-cellular compartments.26
These results, are similar to other studies in patients with CKD with higher GFR levels and without stratification/separation by age27 and in patients with a low GFR,26 where the observed relationship of serum phosphate in progression disappears after adjustment for GFR.; Phosphataemia is a poor marker of the body's total phosphate content (it represents 1% of it), and the serum phosphate levels are affected by intake, and therefore they vary throughout the day,27 and the baseline level, while fasting, may not be representative of the average phosphatemia.
When assessing serum phosphate concentration in our elderly patients, it is necessary to consider that most of these patients present serum phosphate values that are close to normal, this has been previously described in other studies.4 Some studies show that the serum phosphate values in this elderly population are lower than in the same CKD stage not stratified by age.5,22 This is likely explained by the lower protein intake of elderly patients.
Finally, the influence of proteinuria on kidney disease progression well recognised in diabetic and non-diabetic patients,28 is also verified in our population of elderly patients with ACKD.
In our patients there was no association between gender and comorbidity with progression of renal disease. Comorbidity was measured globally with the Charlson index and, in particular, DM and ischaemic heart disease. It is likely that all our patients were fairly homogeneous regarding comorbidities, as these are common diseases in this group of patients.
The highlights of our study include the fact that it is based on a specific population (elderly patients with ACKD), which accounts for a high percentage of the patients followed at our ACKD outpatient clinics and with no many studies available. In contrast to other studies, we have performed multiple measurements of calcium, phosphate, PTH and 25(OH) vitamin D levels besides those obtained at baseline. The method to measure progression of renal disease is quantitative an more reliable than most commonly used qualitative methods (e.g. doubling of creatinine, reaching end-stage kidney disease) and the follow-up period was fearly long, >5years.
The 2 groups (stable vs. progressors) started from similar eGFRs (baseline MDRD), thus making it easy to compare. This study included a detailed evaluation of phosphate: intake, urinary excretion and tubular reabsorption.
The weak points of the study are that the number of patients is not very high, although this can be offset by the profusion of data, the duration of the study and; data on FGF23 may have been helpful. The socioeconomic status, which has been associated with higher serum phosphate levels, was not evaluated; it may determine the more frequent use of pre-cooked or packaged foods with large quantities of phosphate-containing additives that are easily absorbed by the gut.29 This fact may justify the lack of correlation observed, in some studies, between calculated phosphate intake (through estimated protein intake) and urinary phosphate.29
In conclusion, CKD progresses slowly in advanced age patients; this is even more patent in the group of patients in CKD stage 5. Hyperparathyroidism increases the progression of CKD in the elderly, even if as in most cases they have normal serum phosphate concentration. Albuminuria is a relevant factor in the progression of ACKD in elderly patients, as in other groups with kidney failure.
Conflicts of interestThe authors declare that they have no potential conflicts of interest.
Please cite this article as: Toapanta Gaibor NG, Nava Pérez NC, Martínez Echevers Y, Montes Delgado R, Guerrero Riscos MÁ. El nivel de la hormona paratiroidea (PTH) y no el de fósforo sérico es predictor de la progresión de la enfermedad renal en pacientes mayores con enfermedad renal crónica avanzada. Nefrología. 2017;37:149–157.


