
Irisin is an adipomyokine with claimed anti-obesity and anti-diabetic effects. This hormone has been insufficiently studied in patients with advanced chronic kidney disease (CKD).
ObjectiveTo perform an exploratory analysis of serum irisin levels in patients undergoing different CKD treatments.
MethodFollowing a cross-sectional design, we estimated serum levels of irisin in 95 patients with CKD managed conservatively (advanced CKD), with peritoneal dialysis (PD) or with haemodialysis, and compared our findings with a control group of 40 healthy individuals. We investigated the correlations between serum irisin and demographic, clinical, body composition and metabolic variables.
ResultsIrisin levels were lower in all the CKD groups than in the control group. The univariate analysis revealed limited correlations between irisin, on the one hand, and fat (but not lean) mass, glomerular filtration rate (GFR) and plasma albumin and bicarbonate, on the other. The multivariate analysis confirmed that advanced CKD patients managed conservatively (difference 111.1ng/mL), with PD (25.9ng/mL) or haemodialysis (61.4ng/mL) (all p<.0005) presented lower irisin levels than the control group. Furthermore, PD patients presented higher serum levels of irisin than those on haemodialysis (difference 39.4ng/mL, p=.002) or those managed conservatively (24.4ng/mL, p=.036). The multivariate analysis also identified plasma bicarbonate (B=3.90 per mM/l, p=.001) and GFR (B=1.89 per mL/min, p=.003) as independent predictors of irisin levels. Conversely, no adjusted correlation between irisin and body composition markers was found.
ConclusionsSerum irisin levels are low in patients with CKD and show a consistent correlation with GFR and plasma bicarbonate levels. PD patients present higher levels of irisin than those managed conservatively or with haemodialysis. Our study confirms a general inconsistency of the association between serum irisin levels, on the one hand, and body composition and metabolic markers, on the other.
La irisina es una adipomioquina con posibles efectos antiobesidad y antidiabéticos. Esta hormona ha sido insuficientemente estudiada en pacientes con enfermedad renal crónica (ERC) avanzada.
ObjetivoRealizar un análisis exploratorio de los niveles séricos de irisina en pacientes con diferentes modalidades de tratamiento de la ERC.
MétodoSegún diseño transversal, estimamos niveles de irisina en 95 pacientes con ERC manejados conservadoramente (ERCA), con diálisis peritoneal (DP) o con hemodiálisis, comparándolos con un grupo control de 40 individuos sanos. También investigamos las correlaciones entre irisina sérica y variables demográficas, clínicas, metabólicas y de composición corporal.
ResultadosLos niveles de irisina fueron más bajos en cualquier grupo de pacientes que en los controles. El análisis univariante desveló correlaciones moderadas entre irisina, por un lado, y masa grasa (pero no magra), filtrado glomerular (GFR) y albúmina y bicarbonato plasmático, por otro. El análisis multivariante confirmó que los pacientes con ERCA (diferencia 111,1ng/mL), en DP (25,9ng/mL) o hemodiálisis (61,4ng/mL) (todos p<0,0005) presentaban niveles ajustados más bajos de irisina que los controles. Asimismo, los pacientes en DP presentaban niveles más altos de la hormona que los de hemodiálisis (diferencia 39,4ng/mL; p=0,002) o ERCA (24,4ng/mL; p=0,036). El análisis multivariante también identificó bicarbonato plasmático (B=3,90 por mM/L; p=0,001) y GFR (B=1,89 por mL/min; p=0,003) como predictores independientes de los niveles de irisina. Por el contrario, no observamos correlación ajustada entre irisina y marcadores de composición corporal.
ConclusionesLos niveles de irisina son bajos en pacientes con ERC, y muestran correlación consistente con GFR y bicarbonato plasmático. Los pacientes en DP presentan niveles más altos de irisina que los manejados conservadoramente o con hemodiálisis. Nuestro estudio confirma una inconsistencia general en los análisis de asociación entre irisina sérica, por un lado, y marcadores metabólicos y de composición corporal, por otro.
In recent years, muscle tissue has been emerging as an important endocrine organ, involved in regulating many physiological processes.1–3 Irisin4 is an adipomyokine that appears to participate in regulating energy metabolism and other physiological processes. Its best-known and probably most important function is to break down body fat, thereby converting it into brown adipose tissue.4 The main consequence is an increase in energy expenditure, caused by the thermogenic nature of brown fat. This phenomenon contributes to the regulation of body temperature as an immediate effect but other potential consequences include weight loss and therefore a decrease in plasma levels as well as an improvement in insulin tolerance. Therefore, irisin could have a beneficial effect against obesity and as an antidiabetic agent.5,6
The effects of chronic kidney disease (CKD) on the synthesis and secretion of irisin, and its influence on the complex metabolic disorders of CKD patients, have not been investigated sufficiently. Some studies have reported relatively low levels of serum irisin in patients with advanced CKD,7–9 but the comparative effect of different treatment methods has not been evaluated adequately. In addition, the correlations observed between irisin and different clinical, biochemical and metabolic markers in these patients are controversial.
We have undertaken a cross-sectional, exploratory analysis of a large sample of patients with CKD on different modalities of treatments. Our goal was to conduct a comparative analysis of irisin levels and uncover potential associations with different demographic, clinical, biochemical, metabolic and body composition markers.
Population and methodFollowing a cross-sectional design, we investigated serum irisin levels in a sample taken consecutively from a set of advanced CKD patients managed conservatively (ACKD), with peritoneal dialysis (PD) or with haemodialysis (HD) at our centre. We used the following inclusion/exclusion criteria:
- 1.
Aged between 18 and 80.
- 2.
CKD, with estimated glomerular filtration rate (GFR) <30mL/min.
- 3.
No significant clinical events for at least 3 months prior to inclusion.
- 4.
Full capacity to understand the objectives and conditions of the study.
- 5.
Written informed consent.
The primary study variable was serum irisin. We investigated the correlation of this variable with the following:
- (a)
Demographic data: age, gender, diabetes, comorbidity (Charlson Comorbidity Index), treatment method (ACKD, PD, HD), duration of dialysis, blood pressure (at the time of sampling) and treatment with statins, renin–angiotensin–aldosterone system (RAAS) antagonists and erythropoiesis-stimulating factors (ESAs).
- (b)
Body composition: body weight, body mass index (weight/height2), total body water, intra-/extracellular water ratio, overhydration, and body fat and lean body mass (corrected for body surface area [BSA]). The last 5 parameters were estimated using a multifrequency bioimpedance analysis (BIA) device (BCM, Fresenius, Heidelberg, Germany).
- (c)
Laboratory: GFR (mean renal urea and creatinine clearances), proteinuria, haemoglobin, albumin, cholesterol, triglycerides, uric acid, bicarbonate, calcium, phosphate (automated analyser), parathyroid hormone (PTH) (IRMA, Nichols Inst., San Juan Capistrano, USA), interleukin 6 (ELISA, Abcam, Cambridge, UK) and C-reactive protein (CRP) (Immunoturbidimetry, Roche, Mannheim, Germany).
- (d)
Hormonal: blood glucose, C-peptide (Chemiluminescence, Immulite 2000, Siemens, Munich, Germany), insulin (RIA, CIS Bio Int. Cedex, France), HOMA calculator (by Matthews),10 growth hormone (RIA, Nichols), IGF1 (Immunoassay, Nichols), leptin (ELISA, R&D Systems, Minneapolis, USA) and 25-OH vitamin D test (Chemiluminescence, Centaur, Siemens, Erlangen, Germany).
- (e)
To select the method for estimating irisin levels, we conducted a preliminary analysis of the correlation between 2 commercially available ELISA kits (EK-067-29 by Phoenix Pharmaceuticals, Burlingame, USA And AG-45A-0046 by Adipogen International, San Diego, USA). On average, the EK-067-29 kit provided values 41% higher than the AG-45A-0046 kit. The AG-45A-0046 kit was selected for the greater internal consistency of the estimates, which were made in duplicate. Blood samples were placed in serum separator tubes and centrifuged at 3000×g for 15min at 4°C. The serum was stored at −80°C until analysis.
The variables are presented as means (± standard deviation [SD]) except for abnormal distributions (median with amplitude). Univariate comparisons were generated by ANOVA and Kruskal–Wallis and distribution tests χ2. Univariate correlations were estimated using Spearman's rank correlation coefficient. The adjusted correlations between serum irisin and different variables were investigated using multiple regression models (stepwise). We used a random sample of 40 healthy individuals, adjusted for age, gender and body mass index as a reference control group. We used SPSS 19.0 software for data management.
ResultsThe number of patients asked to take part in the study was 105 patients. Seven patients refused to participate and 3 were excluded for having developed clinical events during the screening phase. Thus, the study group was composed of 95 patients. The main demographic and body composition variables are shown in Table 1, while the biochemical variables and those concerning treatments are shown in Table 2. Patients on HD had a longer average time on dialysis than those on PD, as well as lower values for body weight and body fat, and a higher mean level of overhydration than the other 2 study groups (Table 1). The differences observed for GFR values were as anticipated (Table 2). The healthy control group consisted of 20 men and 20 women, aged 56.6±8.7 and with a body mass index of 27.6±4.6kg/m2.
Demographic variables and body composition.
| ACKD | Peritoneal dialysis | HD | p | |
|---|---|---|---|---|
| N | 30 | 35 | 30 | |
| Age (years) | 57.0 (12.4) | 60.8 (12.3) | 56.1 (13.3) | 0.29 |
| Gender (% male) | 60.0 | 61.1 | 50.0 | 0.62 |
| Diabetes (%) | 10 (33.3) | 16 (44.4) | 12 (40) | 0.87 |
| Charlson Comorbidity Index | 4.5 (1.8) | 5.3 (2.0) | 5.4 (1.9) | 0.11 |
| Body weight (kg) | 78.1 (12.5) | 75.5 (11.5) | 64.7 (13.7) | 0.0005a |
| Body mass index (kg/m2) | 28.6 (4.3) | 28.2 (3.9) | 24.6 (3.7) | 0.001a |
| Systolic BP (mmHg) | 142.9 (18.1) | 144.1 (19.3) | 141.9 (23.5) | 0.91 |
| Diastolic BP (mmHg) | 82.6 (11.4) | 83.0 (13.0) | 79.1 (13.5) | 0.16 |
| Time on dialysis (months) | N/A | 29.8 (29.2) | 60.7 (52.3) | 0.0005a |
| Total body water (L) (BIA) | 34.8 (6.2) | 34.3 (6.9) | 31.3 (7.4) | 0.10 |
| Intra-/extracellular water (BIA) | 0.92 (0.11) | 0.97 (0.14) | 0.98 (0.13) | 0.12 |
| Body fat (kg)b (BIA) | 15.4 (5.4) | 15.0 (4.7) | 11.5 (85.4) | 0.008a |
| Lean body mass (kg)b (BIA) | 13.6 (5.9) | 12.5 (2.7) | 11.7 (3.2) | 0.20 |
| Overhydration (L) (BIA) | 0.70 (1.15) | 1.40 (1.72) | 1.83 (2.37) | 0.059 |
BIA: multifrequency bioimpedance; ACKD: advanced chronic kidney disease (estimated GFR<30mL/min); HD: haemodialysis; N/A: not applicable; BP: blood pressure.
Comparisons using ANOVA and analysis χ2.
Laboratory and treatment variables.
| ACKD | Peritoneal dialysis | HD | p | |
|---|---|---|---|---|
| N | 30 | 35 | 30 | |
| GFR (mL/m) | 18.4 (8.3)a | 5.8 (4.3) | 0.9 (1.3) | 0.0005 |
| Proteinuria (g/24h) | 1.8 (1.8)a | 1.1 (1.4) | 0.2 (0.4) | 0.0005 |
| Haemoglobin (g/dL) | 11.3 (1.7) | 11.6 (1.4) | 11.5 (1.6) | 0.77 |
| ESFs (%) | 8 (26.7)a | 22 (61.1) | 27 (90.0) | 0.0005 |
| Albumin, plasma (g/dL) | 4.0 (0.4)a | 3.7 (0.4) | 3.7 (0.7) | 0.007 |
| Cholesterol, plasma (mg/dL) | 161.6 (40.2) | 155.9 (44.4) | 139.1 (28.5)a | 0.0005 |
| HDL cholesterol (mg/dL) | 42.3 (10.9) | 41.1 (14.7) | 43.3 (11.1) | 0.50 |
| LDL cholesterol (mg/dL) | 90.9 (38.9) | 93.8 (39.8) | 88.8 (35.5) | 0.79 |
| Triglycerides, plasma (mg/dL) | 146 (60.445)a | 106 (49.233) | 108 (33.242) | 0.020 |
| Uric acid, plasma (mg/dL) | 7.6 (1.5)a | 5.9 (1.1) | 6.2 (1.2) | 0.0005 |
| Bicarbonate, plasma (mM/L) | 23.2 (4.6) | 28.1 (3.5)a | 24.5 (2.6) | 0.0005 |
| Calcium, plasma (mg/dL) | 9.3 (0.5) | 9.0 (0.6) | 9.1 (0.8) | 0.42 |
| Phosphate, plasma (mg/dL) | 4.8 (1.1) | 4.8 (0.9) | 4.9 (1.2) | 0.94 |
| PTH, plasma (pg/mL) | 306.8 (194.6) | 309.8 (220.8) | 438.0 (370.4) | 0.10 |
| Interleukin 6, plasma (pg/mL) | 1.1 (0.5; 31.0) | 2.8 (0.5; 35.0) | 3.0 (1.0; 66.0) | 0.29 |
| CRP, plasma (mg/dL) | 0.33 (0.10; 11.30) | 0.45 (0.11; 6.40) | 0.50 (0.10; 12.40) | 0.15 |
| RAAS antagonists (%) | 15 (50.0) | 15 (41.7) | 8 (26.7) | 0.17 |
| Statins (%) | 25 (83.3) | 26 (72.2) | 19 (63.3) | 0.22 |
Values indicate means (SD) except triglycerides, CRP and interleukin 1, expressed as a median (range), ANOVA.
ACKD: advanced chronic kidney disease; ESFs: erythropoiesis-stimulating factors; GFR: glomerular filtration rate; HD: haemodialysis; HDL: high-density lipoprotein; LDL: low-density lipoprotein; CRP: C-reactive protein; PTH: parathyroid hormone; RAAS: renin–angiotensin–aldosterone system.
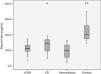
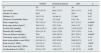
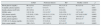
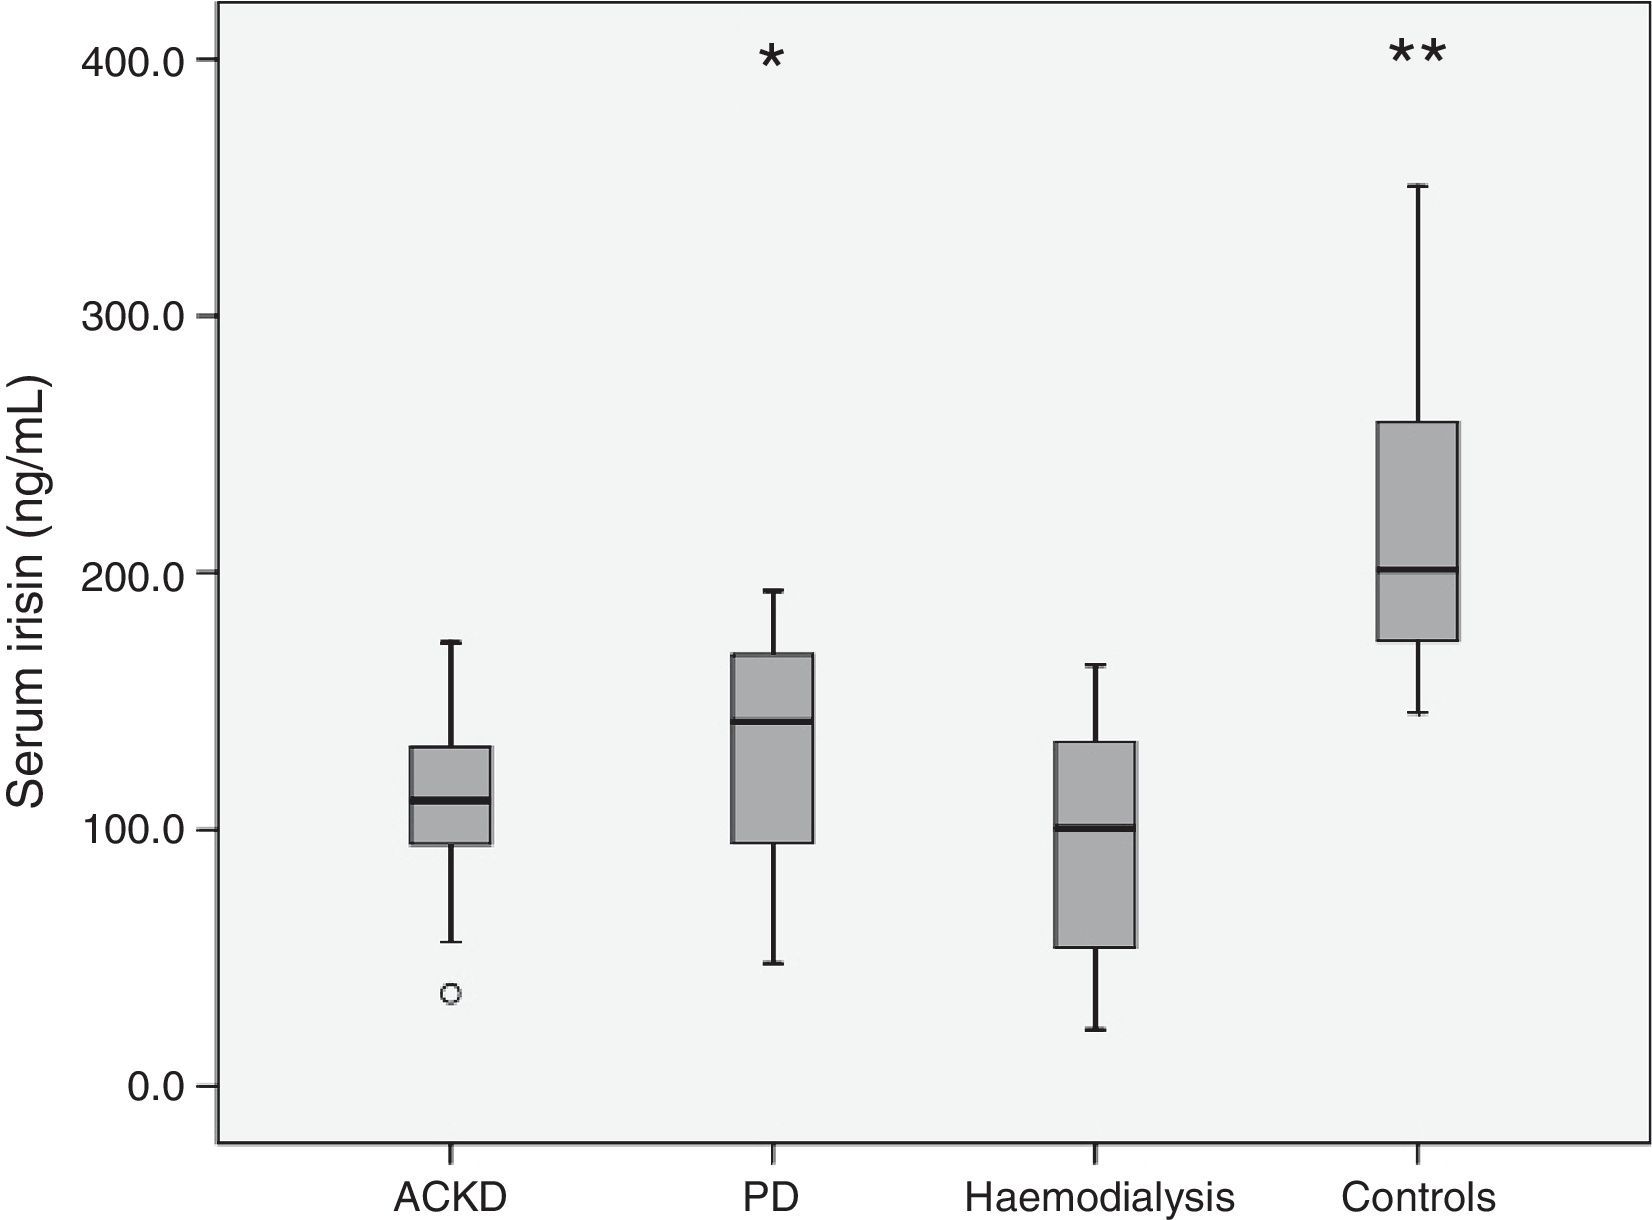
Table 3 shows the main hormonal variables analysed. Serum irisin levels were lower in any of the groups of patients than in the healthy controls. In addition, comparisons between the groups of patients revealed lower levels of adipomyokine in patients on HD than in those treated with PD (Fig. 1). Among patients, irisin levels were similar in diabetics (108.0±32.4ng/mL) and non-diabetics (113.3±45.4ng/mL) (p=0.77). Table 4 shows the main univariate correlations for irisin. A moderate direct association with body fat (BIA), diastolic blood pressure and GFR was observed. The most significant association was observed between serum concentration of irisin and bicarbonate, which was relatively consistent for the different groups, but it did not reach statistical significance in PD patients. Conversely, irisin levels showed no association with treatment with statins, RAAS antagonists or ESAs. Nor did we observe consistent associations between irisin levels and the serum concentration of the hormones measured (Table 4).
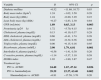
Hormonal variables.
| ACKD | Peritoneal dialysis | HD | Healthy controls | p | |
|---|---|---|---|---|---|
| Blood glucose (mg/dL) | 98.4 (37.8) | 114.0 (37.1) | 101.3 (37.3) | 95.5 (13.4) | 0.11 |
| C-peptide, plasma (ng/mL) | 4.6 (3.7)a | 9.5 (6.7) | 9.0 (5.1) | – | 0.001 |
| Insulin, plasma (mcIU/mL) | 20.5 (19.8) | 21.1 (17.7) | 13.4 (6.6) | 7.1 (5.0)e | 0.0005 |
| HOMA index | 3.65 (2.30) | 5.21 (2.51)b | 3.46 (2.50) | 1.67 (1.40)f | 0.011 |
| GH, plasma (ng/mL) | 0.52 (0.02; 13.80) | 0.83 (0.11; 13.54) | 2.25 (0.28; 23.71)c | 0.47 (0.05; 9.00)g | 0.0005 |
| IGF1, plasma (mg/dL) | 209.6 (93.2) | 260.6 (129.5) | 199.3 (89.7) | 139.0 (67.1)e | 0.0005 |
| Leptin, plasma (pg/mL) | 141.2 (105.3) | 161.1 (106.1) | 74.9 (80.0)c | 26.6 (12.7)f | 0.004 |
| 25-OH vit. D, plasma (ng/mL) | 19.2 (12.8) | 17.8 (10.4) | 11.5 (6.2)c | – | 0.010 |
| Irisin, serum (ng/mL) | 109.1 (34.3) | 132.2 (45.3) | 95.1 (41.2)d | 215.6 (53.1)f | 0.0005 |
ACKD: advanced chronic kidney disease; HD: haemodialysis; IGF1: insulin-like growth factor.
The values indicate the means (SD) except GH (growth hormone), expressed as a median (range), ANOVA.
Univariate correlations between serum irisin and main variables.
| All | ACKD | Peritoneal dialysis | HD | |
|---|---|---|---|---|
| Age | 0.09 (0.42) | 0.35 (0.08) | −0.07 (0.71) | −0.01 (0.95) |
| Gender | 0.15 (0.18) | 0.13 (0.54) | 0.11 (0.57) | 0.19 (0.36) |
| Charlson Comorbidity Index | 0.025 (0.83) | 0.36 (0.08) | −0.21 (0.21) | 0.14 (0.51) |
| Body mass index | 0.14 (0.21) | 0.09 (0.66) | −0.03 (0.90) | 0.09 (0.66) |
| Lean body mass by BSA (BIA) | −0.12 (0.29) | 0.001 (0.99) | −0.23 (0.26) | −0.25 (0.23) |
| Body fat by BSA (BIA) | 0.21 (0.07) | 0.10 (0.52) | 0.10 (0.64) | 0.12 (0.55) |
| GFR | 0.21 (0.07) | 0.40 (0.05) | 0.15 (0.35) | 0.37 (0.07) |
| Proteinuria | 0.00 (0.99) | −0.04 (0.84) | 0.13 (0.52) | 0.31 (0.12) |
| Albumin (plasma) | −0.25 (0.030) | −0.15 (0.45) | 0.15 (0.46) | 0.12 (0.56) |
| Bicarbonate (plasma) | 0.44 (0.0005) | 0.46 (0.02) | 0.28 (0.16) | 0.72 (0.001) |
| C-reactive protein (plasma) | −0.15 (0.20) | −0.15 (0.49) | −0.30 (0.13) | −0.03 (0.90) |
| Interleukin 6 (plasma) | −0.16 (0.20) | −0.18 (0.42) | −0.28 (0.19) | 0.08 (0.72) |
| Blood glucose | 0.01 (0.94) | −0.03 (0.90) | −0.29 (0.14) | 0.04 (0.86) |
| Insulin (plasma) | 0.10 (0.39) | −0.39 (0.04) | 0.11 (0.60) | 0.21 (0.30) |
| HOMA index | −0.24 (0.20) | −0.37 (0.05) | −0.06 (0.78) | 0.11 (0.59) |
| C-peptide (plasma) | −0.05 (0.67) | −0.38 (0.05) | −0.06 (0.77) | 0.11 (0.61) |
| GH (plasma) | −0.12 (0.28) | −0.06 (0.80) | −0.14 (0.49) | 0.07 (0.73) |
| IGF1 (plasma) | −0.04 (0.73) | −0.47 (0.019) | −0.10 (0.70) | 0.08 (0.68) |
| Leptin (plasma) | 0.18 (0.23) | 0.14 (0.52) | 0.16 (0.43) | 0.12 (0.58) |
BIA: bioimpedance; GFR: glomerular filtration rate; GH: growth hormone; IGF1: insulin-like growth factor; BSA: body surface area.
The values indicate Spearman's rank correlation coefficients (p). Other variables, including blood pressure (systolic, diastolic and mean), uric acid, cholesterol, HDL cholesterol, LDL cholesterol, triglycerides, haemoglobin, calcium, phosphate, PTH and vitamin D, with no significant values.
Statistically significant correlations are in bold.
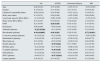
The multivariate analysis confirmed that, after adjusting for age, gender and body fat, irisin levels were lower in patients with CKD (mean difference: 111.1ng/mL, 95% CI: 83.0/139.2; p<0.0005) and patients treated with PD (25.9ng/mL; 95% CI: 15.1/36.7; p<0.0005) or HD (61.4ng/mL; 95% CI: 45.2/77.6; p<0.0005) than in healthy controls. When considering patients only, the multivariate analysis showed plasma bicarbonate, GFR and modality of treatment were the only consistent predictors of serum irisin (Table 5). In addition, patients on PD had higher levels of irisin than patients with CKD or those treated with HD. These differences persisted after adjusting for body fat and lean body mass (BIA).
Correlations adjusted between serum irisin and main variables.
| Variable | B | 95% CI | p |
|---|---|---|---|
| Diabetes mellitus | −0.52 | −11.69, 10.73 | 0.93 |
| Body mass index (kg/m2) | 1.24 | −1.02, 3.50 | 0.28 |
| Body mass (kg) (BIA) | 1.24 | −0.80, 3.29 | 0.23 |
| Lean body mass (kg) (BIA) | −0.27 | −2.83, 2.30 | 0.84 |
| GFR (mL/min) | 1.89 | 0.65, 3.13 | 0.003 |
| Proteinuria (g/24h) | 1.72 | −5.70, 9.15 | 0.64 |
| Cholesterol, plasma (mg/dL) | 0.13 | −0.10, 0.37 | 0.29 |
| HDL cholesterol, plasma (mg/dL) | 0.66 | −0.41, 1.74 | 0.28 |
| LDL cholesterol, plasma (mg/dL) | 0.02 | −0.32, 0.36 | 0.90 |
| Triglycerides, plasma (mg/dL) | 0.00 | −0.15, 0.16 | 0.95 |
| Bicarbonate, plasma (mM/L) | 3.90 | 1.79, 6.01 | 0.001 |
| Interleukin 6, plasma (pg/mL) | −0.56 | −1.41, 0.30 | 0.20 |
| C-reactive protein, plasma (mg/dL) | −1.14 | −5.37, 3.10 | 0.59 |
| HOMA index | 1.03 | −1.80, 3.87 | 0.47 |
| Treatment type | |||
| PD vs. ACKD | 24.40 | 1.67, 47.14 | 0.036 |
| PD vs. haemodialysis | 39.39 | 15.37, 63.40 | 0.002 |
| Haemodialysis vs. ACKD | −6.91 | −17.58, 3.76 | 0.20 |
BIA: bioimpedance; PD: peritoneal dialysis; ACKD: chronic kidney disease managed conservatively; GFR: glomerular filtration rate; CI: confidence interval.
Multiple regression analysis (stepwise). All patients. Variables independently associated with serum irisin are in bold. The best model includes significant variables, adjusted for age and gender. The coefficients of the other variables (not significant) represent the individual correlation of each variable with irisin after adjusting for the best model.
Irisin is a degradation peptide made of 112 amino acids, resulting from fibronectin type III domain-containing protein 5 when broken down by proteases.4 It was initially categorised as a myokine, as it was considered to be essentially synthesised in skeletal and cardiac muscle. But more recent work indicates that fat11,12 and, to varying degrees, other peripheral tissues5 are also able to secrete this factor. Irisin maintains a remarkable molecular homology across different species of mammals.13
The mechanisms that regulate the synthesis and subsequent secretion of irisin have not been fully elucidated. The initial belief that exercise and physical conditioning stimulate the synthesis and secretion of irisin has been confirmed by most, though not all subsequent investigations.5 Both cold and heat also appear to stimulate the release of this factor. Moreover, it has been noted that levels of irisin are higher in men than in women, and are elevated in obese patients, with a direct correlation with body fat and body mass index,6 although these associations have not been confirmed by other studies.5 It has been hypothesised that elevated levels of irisin in obese patients would be a compensatory mechanism for the progressive accumulation of body fat6 and also that irisin could play a role in improving carbohydrate metabolism observed after weight loss in obese patients with metabolic syndrome.14 Finally, some studies have reported relatively low levels of irisin in type 2 diabetics15,16 and patients with fatty liver disease.6
The effect of renal disease on serum irisin levels has not been adequately investigated. Irisin levels could maintain an inverse correlation with grade of proteinuria in type 2 diabetes.17 Wen et al.7 observed irisin levels up to 60% lower in 38 non-diabetic patients with CKD than in 19 healthy controls adjusted for age and gender. The authors indicated that sarcopenia and indoxyl sulfate-induced inhibition of the expression of fibronectin type III domain-containing protein 5 (FNDC5) in muscle cells could explain this phenomenon. A cursory exploratory analysis of selected biochemical values showed only a slight direct correlation with plasma levels of HDL cholesterol. In another study8 of 532 patients with CKD (including 169 on HD) there was a direct correlation (r-adjusted=0.277) between irisin levels and GFR. In this study, irisin levels were similar in diabetics and non-diabetics, higher in women than in men, and showed a significant adjusted association with age (inverse), HDL cholesterol and LDL cholesterol, and HOMA index (direct). Finally, Liu et al.9 studied 365 patients with type 2 diabetes and different levels of GFR, and confirmed the existence of an inverse association between GFR and serum irisin. This study also detected an inverse correlation between age and serum irisin that, remarkably, seemed to disappear in patients with lower levels of GFR. Finally, this analysis did not detect any association with gender, but showed trends, which were not very consistent, in correlation between irisinaemia and lean body mass and body fat.
Overall, attempts to characterise irisin secretion patterns and their correlation with clinical and metabolic markers have been unsuccessful, and these inconsistencies also affect patients with CKD. There are several possible explanations for the discrepancies observed. First, irisin is usually measured by ELISA, but significant variations have been observed in the estimated values when different kits on the market are used.18 The limitations of knowledge on the synthesis and secretion of irisin greatly hinder the search to explain these discrepancies, and has so far prevented normal ranges of serum irisin levels from being established. Inconsistencies in the estimates also help to explain the many contradictions regarding correlations between irisinaemia, on the one hand, and variables such as, for example, body fat or lean body mass, insulin resistance and lipid patterns on the other hand. Moreover, irisin levels have been investigated in very diverse contexts, which adds confusion to the overall analysis. For example, diabetes or obesity could significantly alter the physiological behaviour of irisin. Overall, it is clear that more research is needed to clarify the significance of irisin in health and disease.
Our study confirms previous analyses which indicated a direct correlation between GFR and irisinaemia. As might be expected in this context, irisin levels were lower in CKD patients than in healthy controls (Fig. 1). This difference affected patients with ACKD as well as those treated with PD or HD. In addition, patients on PD had higher levels of irisin than the other 2 groups. To our knowledge, this is the first study to specifically analyse this issue. The explanation for the differences is not clear. Patients on HD had a relatively low body fat, which could contribute to the difference, although this factor showed no independent association with irisinaemia in our study. In the case of ACKD patients, the significantly higher level of GFR allowed this group to maintain raw irisin levels comparable to those observed in patients on PD. Moreover, serum bicarbonate levels were higher in PD patients than in any other group of patients (Table 2), and this variable was a consistent predictor of irisinaemia. To our knowledge, this association has not been previously investigated, and we have no clear explanation for it, although metabolic acidosis has been mentioned as a determinant behind the secretion of other adipokines.19
This study has significant limitations, including its cross-sectional, exploratory design, which does not allow for investigating causality. The statistical power of the sample is also limited, which might explain some inconsistencies in the results, although this problem was observed in studies with larger samples.
In summary, our study confirms that serum levels of irisin are relatively low in patients with CKD, and there is a direct association between GFR and levels of this adipomyokine. In addition, our data indicate that irisinaemia maintains a consistent and independent relationship with plasma bicarbonate levels in patients with CKD. Patients on PD have higher levels of irisin than patients with ACKD or those treated with HD. Finally, our data confirm an essential inconsistency in associations between serum irisin, on the one hand, and metabolic markers or body composition on the other hand, as observed in previous studies. Further studies are needed to characterise the significance of abnormal levels of irisin in CKD.
FundingThis study was partially funded by grants from the Carlos III Health Institute Health Research Fund PI10/00088, PI13/00322 (the European Union's ERDF) and the “Xunta de Galicia” IN845B-2010/187, 10CSA916014PR, CN2012/312.
Conflicts of interestThe authors have no conflicts of interest to declare.
Please cite this article as: Rodríguez-Carmona A, Pérez Fontán M, Sangiao Alvarellos S, García Falcón T, Pena Bello ML, López Muñiz A, et al. Niveles séricos de la adipomioquina irisina en pacientes con enfermedad renal crónica. Nefrologia. 2016;36:496–502.