
Introducción y objetivos: La adición de aditivos fosfóricos en el procesamiento de carnes y pescados implica una sobrecarga de fósforo que no podemos cuantificar a través del etiquetado ni de las tablas de composición de alimentos. Analizamos este incremento mediante la determinación por espectrofotometría del fósforo contenido en estos productos. Material y método: Determinamos el cociente fósforo/proteínas en productos cárnicos y pescados frescos y con distintos grados de procesamiento mediante espectrofotometría (fósforo) y método Kjeldahl (proteínas). Contrastamos estos resultados con los reflejados en las tablas de composición de alimentos. Resultados: El cociente fósforo/proteínas es superior en los productos cárnicos procesados (15,83 mg/g) que en los rebozados (11,04 mg/g) y congelados (10,5 mg/g), siendo más reducido en productos cárnicos frescos (8,41 mg/g) y refrigerados (8,78 mg/g). El pescado blanco fresco presenta un cociente fósforo/proteínas de 8,58 mg/g, mientras que en el congelado se incrementa en un 22 % (10,3 mg/g) y en el rebozado en un 46 % (12,54 mg/g). La información de las tablas es pobre y confusa, sin referencia a las marcas analizadas. Conclusiones: El procesamiento de los productos cárnicos y pescados supone un serio obstáculo para la reducción del consumo de fósforo. El actual marco regulador no favorece el objetivo de reducir el uso de los aditivos fosfóricos al considerarlos seguros para el consumo público. Superar estas barreras implica esfuerzos coordinados para demostrar que el consumo alto de estos aditivos puede ser perjudicial para la población general y debe ser objeto de un mayor escrutinio por los reguladores.
Introduction and objectives. The use of phosphate additives in meat and fish processing leads to a phosphorus overload that we cannot quantify through labelling or food composition tables. We analysed this increase by measuring phosphorus content in these products by spectrophotometry. Materials and method. We determined the phosphorus/protein ratio in fresh meat and fish products with varying degrees of processing by spectrophotometry (phosphorus) and the Kjeldahl method (proteins). We contrasted these results with those reflected in the food composition tables. Results. The phosphorus/protein ratio was higher in processed meat products (15.83mg/g) than in battered (11.04mg/g) and frozen meat products (10.5mg/g), and was lower in fresh (8.41mg/g) and refrigerated meat products (8.78mg/g). Fresh white fish had a phosphorus/protein ratio of 8.58mg/g, while it increased by 22% (10.3mg/g) in frozen white fish and by 46% (12.54mg/g) in battered fish. The information in the tables was poor and confusing, and no reference is made to the brands tested. Conclusions. Processing meat and fish products poses a serious obstacle to the reduction of phosphorus intake. The current regulatory framework does not assist us in the objective of reducing phosphorus additives, since it considers them safe for public consumption. Overcoming these barriers requires a coordinated effort to demonstrate that a high intake of these additives may be harmful to the general population and it should be more closely examined by regulators.
INTRODUCTION
The modern diet leads to an ever increasing consumption of processed foods at the expense of fresh products. Phosphate additives are widely used in the manufacture of these foods, given the diversity of their application: pH regulators, antioxidants, protein stabilisers, flavour enhancers, colour enhancers, melting salts in cheeses, dough enhancers and chemical yeasts1,2 (Table 1). The proportion of phosphorus ingested from these additives is substantial, even more so if we take into account that it is not accompanied by protein intake.3
In patients with chronic kidney disease (CKD) excessive phosphorus intake is related to the development of atherosclerosis, secondary hyperparathyroidism and bone disease.4-8 The recent literature also provides sound data that shows its deleterious effects in the general population. Framingham and CARE studies carried out in the population suggest that it increases cardiovascular risk9,10 and studies in children, teenagers and premenopausal women relate its levels to hypocalcaemia, hyperparathyroidism and increased fractures.11,12 For this reason, some authors suggest that a term “new cholesterol” should be coined.
On reviewing the subject, we find that there is an accumulation of bad news about the use of phosphorus additives:
- Its use is widespread: out of 306 products with varying degrees of processing, we recorded these additives in 29.2% of labels.13
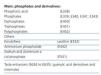
- It can be used in relatively large amounts, since the limits are intended more to prevent fraud than being based on the consumption risk (Table 2 displays the amounts authorised in a selection of products according to European regulations).14
- There are no clear regulations on the labelling of foods and the amount of phosphorus contained in the product or provided by the additives do not appear on the label.15
- The food composition tables do not usually include phosphorus from additives, and as such, we can talk about “hidden phosphorus”.
- Lastly, the phosphorus in these additives is in the form of phosphate salts, with practically 100% absorption.
Meat products and fish are major sources of protein in patients with CKD. However, the addition of phosphate additives results in phosphate overload that we cannot quantify through labelling or food composition tables. For this reason, we intend to determine, by spectrophotometry, the increase in phosphorus intake resulting from the processing of these products.
MATERIAL AND METHOD
Design
A cross-sectional descriptive study with analysis of food product components.
In local supermarkets, 118 products were collected to test for phosphorus and proteins. Among them, we selected 47 meat and fish products with different degrees of processing: refrigerated, frozen or battered. The products chosen were mostly relatively non-prepared, they were not from ready meals and did not include sauces. As examples of more prepared foods, we included some products that add cheese for melting (Cordon Bleu, pork cutlets, Frankfurters, ham and bechamel rolls and ham wraps in breadcrumbs) in which the increase in phosphorous content is also related to the content of cheese and the phosphate additive used as a melting salt. We also tested 6 fresh products (4 meats and 2 fish) to compare the results obtained. We distributed them into the following groups:
- Fresh meat products.
- Refrigerated meat products.
- Frozen meat products.
- Breaded meat products.
- Processed meat products.
- Fresh fish.
- Frozen fish.
- Breaded fish.
Of the total 118 foods, in the first group (52 products) we acquired three different batches to determine phosphorus content. After verifying that the repeatability of phosphorus content was correct with 3 repetitions, in the following 66 products tested, we acquired two batches, and performed a third phosphorus test when the values were conflicting (coefficient of variation - CV [standard deviation -SD/average value] ≥10%). Out of the 53 products listed in this study, we carried out three phosphorus tests in 15 and two tests in 38, with a third test not being necessary in any case.
Food was sent in its original container to the Food and Agriculture Research and Technology Centre of Aragón (CITA). The products were stored in a freezer before being processed for testing. The presence of phosphorus-containing additives was obtained from the list of ingredients included in the product label. Each product was assigned a CITA code before being delivered to the laboratory technicians who were unaware of the brand of food and their labelling.
Before each test, we prepared a part or a subsample that represented the laboratory sample; it had to be as homogeneous (intimate mixture of its components) as possible depending on its characteristics and within the limits of the analytical method applied. We chose them at random and they could be formed from one or more fractions of a unit sample or, in the case of samples consisting of several units of the same batch (aliquots), the subsample could be formed from one or more entire units or fractions of several units. The subsample was homogenised with a laboratory mill and packaged in a clean, dry, rigid plastic recipient (sample pot) that was properly sealed, clearly identified and stored at room temperature or refrigerated depending on its characteristics and the type of test performed on it. The rest of the sample was conserved in optimal conditions (at room temperature, refrigerated or frozen), since subsequent sampling could be performed on it. Likewise, depending on the characteristics of the sample (if it was very heterogeneous), the amount or the type of test, we could decide not to take a subsample but rather process the sample in its entirety.
Bases for determining phosphorus content
Phosphates present in organic matter (as orthophosphates, diphosphates, triphosphates and polyphosphates) were transformed into elemental phosphorus by an acid digestion that destroyed the molecular structures. Total phosphorus (natural and added) was determined by adding the reagent molybdate-vanadate and testing the colour produced by molecular absorption spectrophotometry at λ 436 nm. The first phase of the method was carried out by BD6-Digester (Foss Tcator, Denmark) sample digester. Spectrophotometric measurement was performed by UV-Pharmaspec 1700 (Shimadzu, Japan) dual beam spectrometer.
Determination of total protein content
We tested total protein by the Kjeldahl method. This was based on a digestion process whereby organic matter was destroyed with concentrated sulphuric acid and Cu sulphate (II) as a catalyst. The digestion temperature was adjusted to 420 ºC. Organic nitrogen was converted into ammonia and distilled in the presence of excess sodium hydroxide. Ammonia distillate was collected in a diluted boric acid solution and titrated with 0.1 N hydrochloric acid. These processes (distillation and titration) were performed automatically. The protein content of a product was the result of multiplying the total organic nitrogen content, determined by the Kjeldahl procedure, by a nitrogen-to-protein conversion factor. The factor depended on the type of protein in the food; the universal factor was 6.25. These processes (distillation and titration) were performed automatically using the Kjeltec 8400 system (Foss Tcator, Denmark).
Expression of results
The average of the two or three tests was considered as measured phosphorus. The more standardised protein content was only measured in the first batch of each product.
Phosphorous content was consistently expressed as mg/100g of product and the protein content as g/100g of product. We included the phosphorus-protein ratio calculation (expressed in mg/g) due to its importance for our patients.
We reviewed the information on phosphorus and protein content in different processed foods in the food composition tables by Moreiras,16 CESNID (Higher Education Centre for Nutrition and Dietetics)17 and the BEDCA Network of the Ministry of Science and Innovation, Spanish Agency for Food Safety and Nutrition.18
Statistical analysis
The description of quantitative variables was performed with their mean±SD and the qualitative variables with frequency distribution. The comparison of phosphorus content and the phosphorus-protein ratio between meats and fish was performed using the non-parametric Mann-Whitney test. Given the limited amount of data, no statistical analysis was performed on the difference between the various types of processing.
When the same operator using the same equipment made a certain number of repetitions within a laboratory in a very short period of time, we would have an ideal situation that should produce less variation between readings. This became a measure of the repeatability of measurements and was represented by calculating the repeatability SD. The r value, called the repeatability interval was found simply by multiplying the repeatability SD by 2.8, and it was similar to the statistical estimation of a 95% confidence interval in the difference between readings.
We performed a repeatability study of phosphorus content in various foods, with two or three repetitions for each sample. We calculated the mean, SD, the coefficient of variation (CV = SD/mean) expressed in % and repeatability interval (r=SDx2.8) for each set of repeated tests of the same sample. Subsequently, we calculated the means of all previous determinations in the sample set. Furthermore, we performed a stratified test depending on whether the phosphorus content was above or below the median for the sample (158mg/100g).
CV values <10% for phosphorus tests in the same sample were considered to be acceptable. p<.05 values were considered to be significant. Data were analysed with SPSS version 15.0.
RESULTS
Repeatability study
The mean of the phosphorus tests in the sample set was 158.8 (range 49.3-273.7) mg/100g, the SD mean was 9.3mg/100g, the CV mean was 6.4% and the repeatability interval (r) mean was 26.1mg/100g (this implies that, 95% of the time, a new test, repeated again would not differ from the previous mean by more than 26.1mg/dl).
In values below the median, the mean value of the phosphorus tests in the sample set was 118.2 (range 49.3-157.6) mg/100g, the SD mean was 8.5mg/100g, the CV mean was 7.7% and the repeatability interval (r) mean was 23.8mg/100g.
In values above the median, the mean value of the phosphorus tests in the sample set was 200.1 (range 158.3-273.7) mg/100g, the SD mean was 10.1mg/100g, the CV mean was 5.1% and the repeatability interval (r) mean was 28.35mg/100g.
The CV was significantly lower (5.1% compared to 7.7%, P=.013) in products with values above the median phosphorus content. There were no significant differences in the value of r.
Overall data
The mean phosphorus-protein ratio was 11.9±4.5mg/g. There were no significant differences for products with a phosphorus content above or below the median (12.9 compared with 10.9mg/g; P=ns)
Overall, meat and fish products with phosphate additives have a 60% higher phosphorus-protein ratio than those whose labels do not contain these additives (15.28 compared with 9.51 mg/g, respectively).
Practically all products used antioxidant or preservative additives, within the group of phosphates and its derivatives (Table 1). Only in one case (Pescanova Pescaburguers - crab surimi burgers) was only one phosphate additive used as a flavour enhancer, which in principle meant a lower phosphorus intake, since this type of additives contains it in a lower amount.
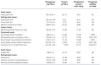
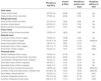
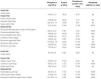
Tests on fresh, refrigerated, frozen, breaded and processed meat products (Table 3 and Table 4)
The presence of phosphorus-containing additives was displayed on the labels of 3 out of the 5 battered meats and in 10 out of the 15 processed meats. The mean phosphorus-protein ratio was 84% higher in products with additives than in products without additives (17.1 vs. 9.3 mg/g, respectively). The mean phosphorus-protein ratio was higher in processed meat products (15.83mg/g) than in battered meat products (11.04mg/g) and frozen meat products (10.5mg/g). The lowest phosphorus-protein ratio was recorded in fresh meat products (8.41mg/g) and refrigerated meat products (8.78mg/g).
However, some products with phosphate additives have a reasonable phosphorus-protein ratio (for example: Hacendado frozen meatballs 10.04mg/g), while other products that contain no phosphate additives have a much higher ratio (e.g. Hacendado chicken croquettes 15.84mg/g).
None of the refrigerated meat products displayed phosphate additives on their label. We note that in refrigerated meat products the phosphorus-protein ratio was similar to that of fresh products.
In frozen meat products, we found a good phosphorus-protein ratio for chicken and a high ratio for frozen loin chop (Martínez Loriente frozen loin chop 11.52mg/g).
There is very little information contributed by the tables on processed meats and the information is confusing. Even the small amount of information that we managed to find was contradictory: the phosphorus-protein ratio for Frankfurters in the Moreiras table was 8.92mg/g, while the CESNID table displays a value of 13.6mg/g and BEDCA table 13.7mg/g (Table 5). We found generic references such as “minced meat”, “country sausage”, “fresh sausage”, with notable variations in phosphorus content.
We did not find any reference to the commercial brands tested in the tables or any more data for refrigerated, frozen, breaded or prepared meat products.
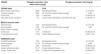
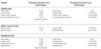
Tests on fresh, frozen and battered fish (Table 6)
Fresh white fish had a phosphorus-protein ratio of 8.58mg/g, while in frozen white fish it was 22% higher (10.3mg/g) and in battered white fish it was 46% higher (12.54mg/g).
Two frozen fish products contained additives (phosphorus-protein ratio 11.1mg/g) and 3 did not (ratio 9.89mg/g). In the battered white fish, 3 did not display additives (ratio 11.13mg/g) and 7 did (ratio 13.2mg/g). Battered products generally had a higher phosphorus content. Again it should be stressed that in a frozen product (Eroski cuttlefish rings 12.96mg/g) and in one battered product without additives (Pescanova egg hake fillets 13.1mg/g) the phosphorus-protein ratio was higher than would be expected.
The information in the tables is again very poor. Only some generic and confusing information is included for some processed products (Table 7). It should be highlighted that the Moreiras table displays similar phosphorus-protein ratio values for fresh and frozen hake in contrast to our results and those displayed in the CESNID table. We did not find any reference to the brands tested or any more data on refrigerated, frozen or breaded fish in the tables.
Comparison between meat and fish
The meat products included a higher phosphorus content than the fish products (177.9 compared to 121.7mg/100g; P<.0001), but their phosphorus-protein ratio was similar (12.2 compared to 11.4mg/g; P=ns).
DISCUSSION
Dietary phosphorus intake comes from organic sources in the form of esterified derivatives (meats, fish, dairy products, vegetable products) and from inorganic sources in the form of phosphate salts (additives used in processed food). Natural or organic forms of phosphorus are widespread in the diet and provide the greatest contribution of phosphorus. However, the use of phosphate additives has increased exponentially in recent decades and now constitutes up to a third of the total phosphorus intake.19 These data could be linked to the risk that they involve not only for dialysis patients but also for the CKD population and the general population.
Despite their widespread use, phosphate additives are not taken into account in phosphorus content estimations. Current regulations do not require producers to display their quantities on the labels and the quantity of phosphorus added by these additives is not clearly defined in the food composition tables. We note that the Spanish tables used in our study provide little information and contradictory data on the quantity of phosphorus in some products. Previous studies carried out in different geographical locations suggest that the food tables may underestimate phosphorus content by between 250 and 350mg/day.20-22
Some foods that are apparently not processed have received special attention in the literature on CKD patient nutirition.23 These are usually refrigerated meats, packaged in the supermarket, to which phosphate additives may be added to facilitate their preservation, improve their taste, colour and cooking characteristics. Sherman et al. detected high amounts of phosphorus in some of these products but the labels did not display phosphate additives.24 This would suggest treatment with additives without a specific indication in the list of ingredients. In our work, the phosphorus-protein ratio of refrigerated and packaged meats was similar to that of fresh meats, which suggests that no additives were added. However, the lack of regulation of this process is another reason for concern.
Furthermore, in accordance with the “General regulations for the labelling, presentation and advertisement of food products”, it is not compulsory to declare additives of an ingredient on the ingredient list if they do not perform a technological function in the final product. For example, a processed meat product may have meat prepared with phosphate additives, a sauce with phosphate additives, phosphates for melting cheese, etc. without phosphate additives appearing on the label. The same may apply to pre-cooked fish with potatoes or other prepared foods.
These data lead us to a troubling conclusion: with the current regulations, we are not capable of estimating the amount of phosphorus that our CKD patients are ingesting. Phosphate additives do not only increase phosphorus intake but they include a significant amount of “hidden phosphorus”.19,25
Recommending more suitable foods to minimise phosphorus intake would exceed the objectives of this study,26 but we do consider it important for nephrologists and nutritionists to be aware of the aforementioned barriers in order to recognise a potential for the reduction in phosphorus intake while maintaining protein intake.27 To address this matter while bearing in mind that not all phosphorus is contributed by meat and fish products, we can estimate that if we decrease the phosphorus-protein ratio from 12.24mg/g (mean of tested processed meat and fish products) to 8.45mg/g (mean of fresh meat and fish products) in a 70kg haemodialysis patient (recommended protein intake 70 x 1.2 = 84g/day), we would reduce phosphorus intake from 1028 to 710mg/day without reducing protein intake. The absorption of inorganic phosphorus from additives (practically 100%) is much higher than the absorption of phosphorus contained naturally in meats (70%-80%) or in vegetables (40%-60%, in the form of phytates). As such, additives will have a greater effect on hyperphosphataemia than equivalent amounts of phosphorus contained naturally in products. Until now, only one interventional study in haemodialysis has been carried out, in which patients are simply trained to study product labels and avoid those that contain phosphate additives, achieving a 0.6mg/dl reduction in serum phosphorus with respect to the group with regular dietary training.28
As positive data from our study, we must highlight the review of phosphorus content in a wide range of meat and fish products with different degrees of processing. The technique for measuring phosphorus could be repeated with a mean CV below 10% for contents both high and low in phosphorus in products. The repeatability interval was less than 30mg/100g of product regardless of the phosphorus content, a difference that was not relevant from a clinical point of view.
A limitation of the study was its cross-sectional nature with different batches of products being used and it was carried out in a specific geographical region. There obviously may be modifications in food processing that change their phosphorus contents, even more still if we take into account that the amounts permitted are indicated with “up to… grams of P2O5 per kg or litre” and that this level is high. As such, variations in phosphorus content, the introduction of new products and geographical variability add difficulties, not only for carrying out these studies, but also for the management of phosphorus intake in CKD patients.
To conclude, our results, the review of references, and analysis of current food regulations all highlight the increase in phosphate additives in modern food and the importance of reducing their consumption for CKD patients and the general population. In the test carried out, producing meat and fish products involves the use of additives with a phosphate salt load that can be easily absorbed. Neither labelling nor food composition tables allow this increase to be detected, and as such, it may be considered as “hidden phosphorus”. Although we can improve our CKD patients’ dietary education and train them to eat processed foods in moderation and perhaps train them to review additives on labels, we must take into account that our efforts are limited by the widespread use of processed products and the difficulty of knowing the amount of phosphorus, and therefore, of dietary phosphorus intake.
Without carrying out a throughout review, we would like to highlight some key points for addressing this problem:
1. The current regulations regarding the use of these additives do not favour their reduction, as they are considered to be safe for consumption. There should be coordinated efforts to demonstrate that their high intake is not recommended for CKD patients or the general population and that better regulation is necessary.
2. Companies should analyse the phosphorus content of their products, display this information on the labels and incorporate it into the food composition tables. Incentives could be established to produce food with low phosphorus content and alternatives to phosphate additives.
3. It would be recommendable to develop links between scientific societies such as the Spanish Society of Nephrology and the Food Safety and Nutrition Agency to begin an awareness-raising process and take recommended actions.
Conflicts of interest
The authors declare that they have no conflicts of interest related to the contents of this article.

Table 1. Phosphate additives

Table 2. Grams of P2O5 per kilo or litre authorised in different meat and fish products according to Regulation (EU) No 1129/2011

Table 3. Phosphorus and protein composition of meat products derived from pork and veal tested by spectrophotometry and the Kjeldahl method. Presence of phosphate additives on the labelling

Table 4. Composition of phosphorus and proteins in meat products derived from chicken and turkey tested by spectrophotometry and the Kjeldahl method. Presence of phosphate additives on the labelling

Table 5. Phosphorus-protein ratio of processed meat products according to the food composition tables and their comparison with our results

Table 6. Results of phosphorus and protein composition of fresh, frozen and battered fish tested by spectrophotometry and the Kjeldahl method. Presence of phosphate additives on the label

Table 7. Phosphorus-protein ratio values for fresh, frozen and battered fish according to food composition tables and their comparison with our results