Introducción: La malnutrición calórico-proteica es un factor de riesgo de mortalidad en pacientes en diálisis, sin embargo, su valoración clínica no ha sido bien definida. La bioimpedancia eléctrica (BIE) es un procedimiento no invasivo y objetivo, cada vez más empleado en su valoración. Objetivo: El objetivo de este estudio es analizar la relación entre el ángulo de fase determinado por BIE a una frecuencia de 50 kHz (AF50) con otros parámetros de nutrición y valorar prospectivamente su capacidad como marcador pronóstico de mortalidad a largo plazo. Pacientes y métodos: Incluimos a 164 pacientes, 127 en hemodiálisis y 37 en diálisis peritoneal, a los que se les realiza un análisis de BIE al tiempo que se solicitan parámetros de inflamación y nutrición y se calcula el índice de comorbilidad de Charlson. Resultados: En el análisis de correlación lineal, encontramos que el AF50 tiene una asociación directa con la masa magra, con el agua intracelular, con el agua extracelular y con la ganancia de peso interdiálisis, mientras que se asocia de forma inversa con la edad, con la masa grasa y con el log PCR. Los pacientes con AF50 >8º presentan un mejor estado nutricional, son más jóvenes y tienen una supervivencia significativamente mejor a los seis años de seguimiento. Entre los pacientes estudiados, tanto el AF50 como el resto de los parámetros de composición corporal son mejores en diálisis peritoneal que en hemodiálisis, pero estas diferencias pueden ser atribuidas a que los primeros son más jóvenes. En el análisis multivariable, sólo el AF50 <8º y la comorbilidad ajustada para la edad persisten como factores de riesgo independientes de mortalidad. Conclusiones: Concluimos que el AF50 tiene una buena correlación con los parámetros de nutrición y que es un buen marcador de supervivencia en pacientes en diálisis. No obstante, son necesarios estudios de intervención en los que se demuestre si la mejoría de los parámetros de BIE se acompaña de una mayor supervivencia.
Introduction: Protein-energy malnutrition is a risk factor for mortality in dialysis patients; however, its clinical assessment has not been well defined. Electrical bioimpedance (EBI) is a non-invasive and objective procedure, which is increasingly being used for this assessment. Objective: The aim of this study is to analyse the relationship between the phase angle determined by EBI at a frequency of 50kHz (AF50) and other nutritional parameters, and prospectively evaluate its ability as a marker for long-term mortality. Patients and methods: We included 164 patients (127 on haemodialysis and 37 on peritoneal dialysis) who underwent an EBI analysis while simultaneously determining inflammation and nutrition parameters. The Charlson comorbidity index was then calculated. Results: In the linear correlation analysis, we found that the AF50 had a direct association with lean mass, intracellular water, extracellular water and interdialytic weight gain, while having an inverse association with age and fat mass. Patients with AF50 >8º had a better nutritional status, were younger and had significantly longer survival at the six-year follow-up. Among the patients studied, both the AF50 and the other body composition parameters were better in peritoneal dialysis than in haemodialysis, but these differences may be attributable to the fact that the first patients were younger. In the multivariate analysis, only the AF50 <8º and comorbidity adjusted for age persisted as independent risk factors for mortality. Conclusions: We conclude that AF50 has a good correlation with nutritional parameters and is a good marker of survival in dialysis patients. Nevertheless, intervention studies are needed to demonstrate if the improvement in EBI parameters is associated with better survival.
INTRODUCTION
Protein-calorie malnutrition is a risk factor for mortality in dialysis patients.1,2 However, its clinical assessment is not well defined. The subjective global assessment has been widely studied in these patients and found to be associated with mortality.3,4 Another of the most widely used parameters is body mass index (BMI) which, in patients on haemodialysis (HD), has a reverse epidemiology; indeed, in large series, patients with a higher BMI have increased survival, which does not happen in the general population.5,6
Bioelectrical impedance analysis (BIA) has been widely used in the evaluation of body composition in dialysis patients.7-10 Its application is based on the resistance the body offers to the passage of an alternating electric current, and it has 2 vector components: resistance and reactance. The first determines the tissue hydration status, as water is an excellent conductor, such that the higher the water content, the less the resistance. Therefore, tissues with plenty of water (e.g., muscle) can be discriminated from those containing small quantities of water (e.g., fat and bone). The second component is reactance or capacitance, which determines the amount of energy that can be accumulated in tissue, as tissue cells behave as true capacitors. The vector sum of both components is the impedance and the angle it forms is called the phase angle. This variable has been related to the nutritional status of patients on HD.3,6
The aim of this study was to analyse the relationship between the phase angle determined at 50kHz with various nutritional parameters, and study its value as a predictor of long-term mortality in a sample of patients on dialysis.
PATIENTS AND METHODS
A prospective observational study, with a 6-year follow-up, of 164 patients on dialysis, including 127 on HD and 37 on peritoneal dialysis. The mean patient age was 61.1±14.5 years, of whom 99 were male (60.3%). The etiology of chronic kidney disease included 23.2% diabetes mellitus, 27.9% glomerulonephritis, 17.0% tubulointerstitial nephritis, 7.0% vascular nephritis, 7.0% of unknown etiology and 10.0% from other causes. The prevalence of diabetes mellitus in all patients was 32.2% and 54 patients had undergone a previous kidney transplant. The comorbidity of the patients was determined by the age-adjusted Charlson index.
At baseline, a multi-frequency BIA was conducted in all cases using a Bioscan system (Biológica, Tecnología Médica S.L., La Garriga, Spain) between January 2002 and October 2003, with the study being terminated in December 2009. The measurement was performed before a HD session in the middle of the week, after spending 10 minutes supine, with 4 conventional electrodes placed 2-by-2 in the hand and foot contralateral to vascular access. The bioimpedance analyser determined the resistance, reactance and phase angle at 10 different AC frequencies, ranging from 5 to 500kHz.
When performing the bioimpedance analysis, all patients were on conventional HD, lasting between 3.5 and 4 hours. Throughout the study, there were technical changes, including on-line progressive haemodiafiltration and increases in the session times. Patients on peritoneal dialysis were examined with the stomach empty and the same time in supine position. The data collected were resistance, reactance and phase angle at 50kHz (PA50), as it was the maximum phase angle frequency for most patients. This was the only frequency used to analyse the rest of the parameters. The total body water (TBW), intracellular water (ICW), extracellular water (ECW), fat mass (FM) and fat-free mass (FFM) were calculated by the system software. These parameters were adjusted on a percentage basis to estimated body weight of each patient. Also personal data, analytical data were collected according to conventional techniques and anthropometric parameters. For patients on HD, the interdialytic weight gain was calculated as the average of 3 weekly sessions.
Statistical analysis
Quantitative variables were expressed as mean and standard deviation and qualitative variables as percentages. The comparisons between means were performed using Student's t-test or the analysis of variance. Comparisons between quantitative variables were performed using the chi-squared analysis. Bivariate correlations were performed by calculating the Pearson or Spearman coefficient according to the type of variable. The Kolmogorov-Smirnov test was used to analyse for normal distribution of a variable. Survival analysis was performed using the Kaplan-Meier test and statistical significance calculated by the log-rank test. The Cox test was used with different models for the multivariate analysis which included significant variables in the univariate analysis. A P<.05 value was considered significant. The package SPSS version 18.0 (SPSS, Chicago, Illinois, USA) was used for the statistical analysis.
RESULTS
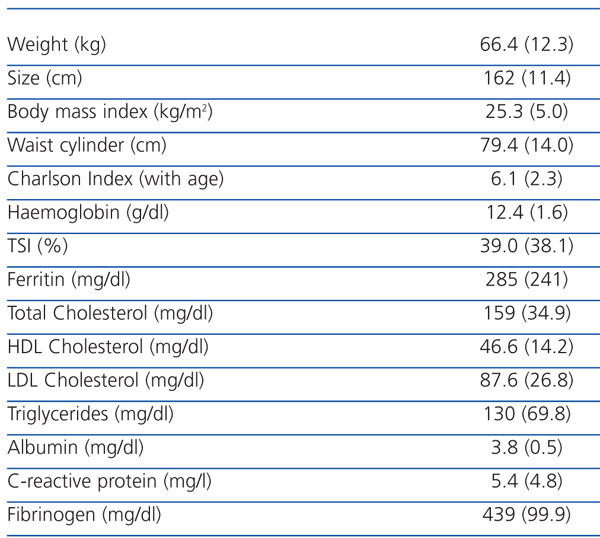
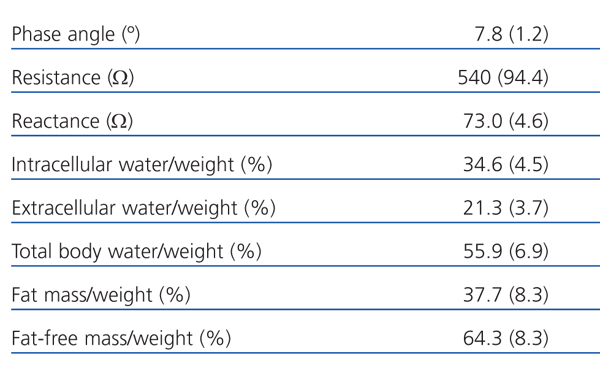
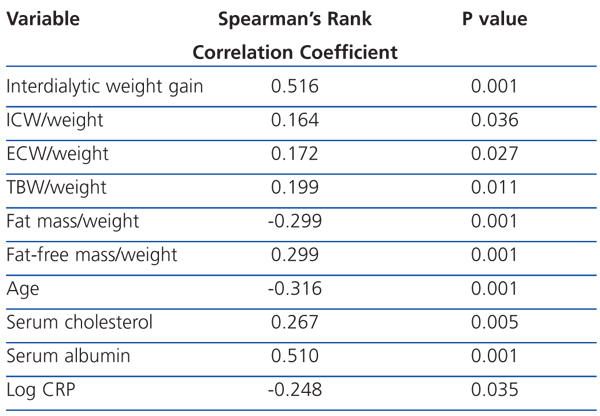
The initial clinical and analytical features of patients are shown in Table 1. Table 2 shows the results of the baseline parameters calculated by BIA at 50kHz. A bivariate correlation analysis was conducted between PA50 and the continuous variables analysed, with the results shown in Table 3. The significant relationship between nutritional parameters determined by BIA and serum albumin is worth noting, as well as the direct relationship between the intracellular and extracellular water content adjusted to the dry weight of the patient. However, there was no significant relationship between PA50 and some inflammation parameters, such as C-reactive protein, serum fibrinogen or serum ferritin.
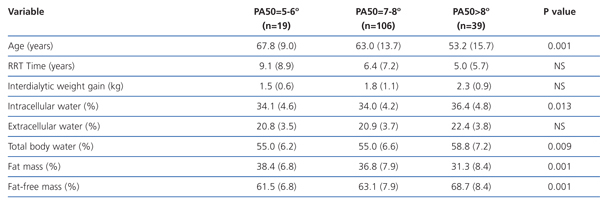
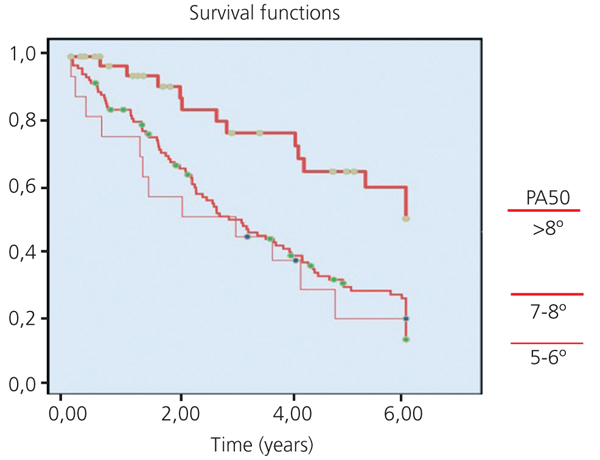
The mean PA50 was 7.8±1.2° (range, 5-14°). The patients were divided into 3 groups according to the PA50: a) 19 patients with PA50 of 5-6°, b) 106 patients with PA50 7-8°, and c) 39 patients with PA50>8°. The mean values were 5.7±0.4°, 7.5±0.5° and 9.5±1.1°, respectively (P<.001). After 6 years, the mean follow-up was 3.1±2.0 years: 100 patients (61%) had died, 22 (13.4%) had undergone transplantation, 4 (2.4%) were removed due to transfer to another centre, 36 (22%) remained on HD and 2 (1.2%) were on peritoneal dialysis. The Kaplan-Meier survival analysis showed that the group with the highest PA50 had significantly better survival than the remaining 2 (log-rank 14.9, P<.001), which is shown in Figure 1. The percentage AEC, FFM ICW, TBW and MG parameters among the 3 groups obtained from PA50 measurements were compared. The group with the greatest PA50 was the youngest and had a significantly higher FFM, ICW and TBW content, but lower MG (Table 4).
The BIA variables related to mortality in the univariate analysis showed that the percentage MG was associated with an increased risk of mortality (P=.003), while the percentage FFM (P=.003), percentage ICW (P=.044) and PA50>8° (P=.005) were associated with lower risk. The Cox multivariate analysis (Table 5) was performed with a model that included the above variables and body composition and, when adjusted for comorbidity by the Charlson index including age, the only independent risk factors for mortality were PA50<8° (P=.003) and comorbidity itself (P<.001).
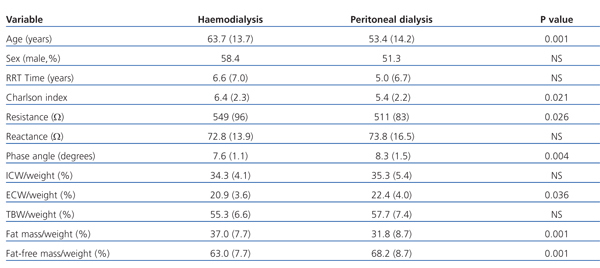
Table 6 shows the data analysed according to the dialysis modality of patients at the time of the study. It is notable that peritoneal dialysis patients were younger (P<.001), had increased extracellular hydration status (P=.036), a greater PA50 (P=.004), a higher proportion of lean tissue (P<.001) and a lower proportion of fat (P<.001).
DISCUSSION
Our study prospectively confirms that the BIA phase angle measured at 50kHz is associated with nutritional status, as described by other authors,11,12 and is also an independent risk factor for long-term mortality. Recently, Segall et al. reported that a PA50<6° has a relative risk of mortality per year of 4.1 compared to those who have a higher PA50.3 Our data demonstrate that this predictor effect remains at 6 years of follow-up, although with a slightly higher cut-off value.
BIA has been used in assessing the nutritional status of patients on dialysis for more than two decades.7,13,14 One of its most important components is the phase angle, which is the resultant vector of resistance and reactance. The former mainly reflects the patient's hydration status: such that the higher the water content, the lower the resistance; and, in the same individual, the greater the water loss, the greater the increase in resistance. Thus, the length of the vector, which is mainly due to the resistance, has been used as a procedure to assess ultrafiltration needs in HD.15,16 The reactance represents the ability of tissues to accumulate energy, since the cells have a similar electrical behaviour to a capacitor, such that the greater the number of cells, the greater the reactance.
Multi-frequency BI analysers can determine the 3 components: resistance, reactance and phase angle over a wide range of frequencies, which vary according to the manufacturer between 1 and 1000kHz. Typically, the single-frequency systems are set to make a single measurement at 50kHz, due to the phase angle being the maximum at this frequency.17 As a result, this frequency only was chosen for this study, without considering any others.
The water content in the body depends physiologically on the amount of fatty tissue it contains.18 Therefore, it is usually necessary to have reference values for a similar population to the one analysed. Fat content varies physiologically with sex (women have more fat and less water), age (older people have more fat and less water)14 and nutritional status (the fatter the person, the lower the water content). In general, bioimpedance analysers come with software which is based on validated formulas to calculate hydration and body composition parameters. These data are individualised on the basis of sex,16,17 but theoretically should also be based on age, nutritional status or even race.19
To avoid bias due to body composition, in this study we used the raw impedance data as a primary variable, with special emphasis on the phase angle as a combined result of resistance and reactance. Thus, it was not necessary to consider normal reference parameters. However, we also analysed parameters provided by the software system as secondary variables.
It is worth noting that the determination of the phase angle varies from one series to another, probably because of the type of BI analyser used. The mean obtained in our study is higher than that found by other authors, although our results also confirm that there is a strong relationship between nutritional status and phase angle.3
Numerous studies show a strong relationship between nutritional status assessed by bioelectrical impedance techniques and inflammation status, as well as its effect on survival for patients on dialysis.20-22 However, other authors report that the state of malnutrition may be a risk factor for mortality independent of inflammation.23 Our results show that PA50 has a strong correlation with nutritional parameters; however, it is not associated with inflammation parameters such as ferritin or fibrinogen, and has only a weakly significant relationship with the logarithm of C-reactive protein.
Although many authors evaluate nutritional status using body mass index (BMI), our study shows that it is necessary to differentiate between those with a high index of fat-free mass and those with a very low fat-free mass, even if they have a high BMI. The first group is associated with a high PA50 and has significantly better survival than the latter. These data have similar results to those described recently by Kalantar-Zadeh et al., who established the need to differentiate the various components of body composition to assess any prognostic effect.5
Table 4 shows how the subgroup of patients with the highest PA50 also has higher ICW and TBW percentages, as well as a higher content of fat-free mass. Therefore, these data show that patients with the highest PA50 have more muscle tissue and ICW, while the fat contains very little ICW. Therefore, the assessment of TBW has little meaning without knowing the total body composition.18
We recorded the interdialytic weight gain in the patients studied as the mean of 3 weekly sessions, and found a good correlation with nutritional status and age. These data corroborate previous findings, which found that this parameter is associated with greater survival, confirming the importance of nutrition in dialysis patients.24
The study included patients with 2 dialysis modalities. Although it was not a primary aim to compare the characteristics of patients in both techniques, Table 6 shows the characteristics of both groups. It is worth noting that the peritoneal dialysis patients have better nutritional status with higher levels of lean mass and less fat. They also have a significantly lower Charlson index comorbidity, but with a greater extracellular hydration status, as has been noted before.25 However, the most noticeable finding is the age difference between both groups, as usually happens, which largely determines nutrition, comorbidity, and body composition, and detracts from the comparison between both techniques.
In conclusion, our study shows that the gross parameters obtained by BIA at a frequency of 50kHz correlate well with nutritional parameters, with PA50 especially being a good marker of survival in dialysis patients. However, intervention studies are needed to demonstrate if improvement in BIA parameters is associated with greater survival.
Table 1. Clinical and analytical features of patients
Table 2. Parameters determined by bioelectrical impedance at 50kHz
Table 3. Analysis of bivariate correlation between the phase angle measured at 50kHz and analytical nutrition, anthropometric and bioimpedance parameters
Table 4. Group features according to the phase angle at 50kHz
Table 5. Multivariate analysis of the mortality risk factors
Table 6. Clinical and bioelectrical impedance features of patients on haemodialysis and peritoneal dialysis
Figure 1. Phase angle


