


The strategy of the concentration-dose (C/D) approach and the different profiles of tacrolimus (Tac) according to the cytochrome P450 polymorphisms (CYPs) focus on the metabolism of Tac and are proposed as tools for the follow-up of transplant patients. The objective of this study is to analyse both strategies to confirm whether the stratification of patients according to the pharmacokinetic behaviour of C/D corresponds to the classification according to their CYP3A4/5 cluster metabolizer profile.
Materials and methods425 kidney transplant patients who received Tac as immunosuppressive treatment have been included. The concentration/dose ratio (C/D) was used to divide patients in terciles and classify them according to their Tac metabolism rate (fast, intermediate, and slow). Based on CYP3A4 and A5 polymorphisms, patients were classified into 3 metabolizer groups: fast (CYP3A5*1 carriers and CYP34A*1/*1), intermediate (CYP3A5*3/3 and CYP3A4*1/*1) and slow (CYP3A5*3/*3 and CYP3A4*22 carriers).
ResultsWhen comparing patients included in each metabolizer group according to C/D ratio, 47% (65/139) of the fast metabolizers, 85% (125/146) of the intermediate and only 12% (17/140) of the slow also fitted in the homonym genotype group. Statistically lower Tac concentrations were observed in the fast metabolizers group and higher Tac concentrations in the slow metabolizers when compared with the intermediate group both in C/D ratio and polymorphisms criteria. High metabolizers required approximately 60% more Tac doses than intermediates throughout follow-up, while poor metabolizers required approximately 20% fewer doses than intermediates. Fast metabolizers classified by both criteria presented a higher percentage of times with sub-therapeutic blood Tac concentration values.
ConclusionDetermination of the metabolizer phenotype according to CYP polymorphisms or the C/D ratio allows patients to be distinguished according to their exposure to Tac. Probably the combination of both classification criteria would be a good tool for managing Tac dosage for transplant patients.
La estrategia de la aproximación concentración-dosis (C/D) y los distintos perfiles del tacrolimus (Tac) según los polimorfismos del citocromo P450 (CYPs) se centran en el metabolismo de Tac y se plantean como herramientas para el seguimiento de los pacientes trasplantados. El objetivo de este estudio es comparar la exposición al Tac analizado según ambas estrategias.
Materiales y métodosSe han incluido 425 pacientes trasplantados renales. El cálculo del cociente concentración Tac/dosis (C/D) permitió dividir la población en terciles y clasificar los pacientes según su tasa de metabolismo del Tac en 3 grupos (rápida, intermedia y lenta). En base los polimorfismos del CYP3A4 y A5, los pacientes se agruparon en metabolizadores rápidos (portadores del CYP3A5*1 y CYP34A *1/*1), intermedios (CYP3A5*3/3 y CYP3A4*1/*1) y lentos (CYP3A5 *3/*3 y portadores del CYP3A4*22).
ResultadosAl comparar los pacientes de cada grupo metabolizador según los dos criterios coincidieron el 47% (65/139) de los metabolizadores rápidos, el 85% (125/146) de los intermedios y solo el 12% (17/140) de los lentos. Se observaron concentraciones de Tac estadísticamente menores en los metabolizadores rápidos y concentraciones mayores en los lentos, comparándolos con el grupo intermedio según el cociente C/D o según polimorfismos. Los metabolizadores rápidos requirieron alrededor del 60% más de dosis de Tac que los intermedios a lo largo del seguimiento, mientras que los lentos aproximadamente un 20% menos de dosis que los intermedios. Los metabolizadores rápidos clasificados por ambos criterios presentan un porcentaje mayor de veces con valores de concentración de Tac en sangre infra-terapéuticos.
ConclusiónLa determinación del fenotipo metabolizador según los polimorfismos del CYP o bien cociente C/D permite distinguir los pacientes según su exposición al Tac. Probablemente la combinación de ambos criterios de clasificación sería una buena herramienta en el manejo de la dosificación de Tac para los pacientes trasplantados.
Tacrolimus (Tac), a calcineurin inhibitor, is the cornerstone of immunosuppressive therapy in solid organ transplantation. This drug is very effective in preventing acute rejection, but clinical dose adjustment remains difficult due to its narrow therapeutic window and high intra- and inter-patient pharmacokinetic (PK) and pharmacodynamic (PD) variability.1,2 Perhaps the greatest challenge is to find a therapy that adapts to the individual characteristics of the patient achieving a good balance between efficacy and toxicity.3 For thirty years, dose adjustment of Tac in clinical practice has been done empirically according to the drug's summary of product characteristics. The calculation of the initial dose of Tac after solid organ transplantation is based on the patient's body weight. Subsequent doses are adjusted based on the pre-dose morning concentration (C0) of Tac for therapeutic drug monitoring (TDM) at the discretion of each centre.3
Tac metabolism and PK profiles are becoming increasingly important. The individual's rate of Tac metabolism has been linked to outcomes after transplantation, further exacerbating the problem of inter-individual differences in dose-response relationships.2 Exposure to Tac has been evaluated based on genetic polymorphisms of cytochrome P450 (CYP3A4 and CYP3A5), which modifies the metabolism of Tac.4–10 In order to define the population based on the pharmacogenetic characteristics of the cluster and the differences in the metabolisation of Tac, three phenotypes have been described; fast, intermediate and slow metabolisers. Fast metabolisers have low levels of Tac, requiring at least twice the dose of slow metabolisers.6,9,11
The concentration/dose approach (C/D) has been analysed as a simple tool to estimate the metabolism of Tac.12–18 In these studies, a low C/D ratio (C/D < 1.05 (ng/mL)/mg in kidney transplant recipients; <1.09 (ng/mL)/mg in liver transplant recipients) indicates rapid metabolism of Tac and it is associated with a decreased renal function, a higher rate of biopsy-proven nephrotoxicity and more frequent switching to an alternative immunosuppressive regimen than patients with a higher C/D ratio.12,14–16,19–22
Both strategies, the study of polymorphisms and the C/D ratio, focus on Tac metabolism and are suggested as additional tools for personalising the dose of Tac in transplant patients. The goal is to personalise Tac treatment and limit the time that transplant recipients are under- or over-exposed to Tac, in order to minimise the risks of rejection and toxicity, respectively. This study evaluated both strategies to identify whether the stratification of patients according to the PK of C/D corresponds to their classification according to the metaboliser profile of the cluster CYP3A4/5, and whether there is any association between either classification and under- or over-exposure to Tac, intra-individual variability or the outcome of the transplanted organ.
Patients and methodsThe study included a total of 425 patients who received a kidney transplant from 2013 to 2020 (including both years) (Fig. 1). The study was carried out in accordance with the Declaration of Helsinki and with the approval of the local ethics committee of the Hospital Universitario de Bellvitge, Spain.

Patients included were taking a formulation of Tac every 12 h and had a DNA sample available-*. Those who were switched to other 24-h formulations of Tac were excluded. Patients who died or suffered graft loss in the first month after kidney transplantation and those who had incomplete biochemical data for measuring the concentration/dose ratio (C/D) during follow-up were also excluded. The usual immunosuppressive therapy they received consisted of antithymocyte globulins (ATG) or basiliximab as induction therapy, followed by Tac and mycophenolate mofetil (MMF) and steroids as maintenance immunosuppression. Tac concentration and dose was monitored on days 7 and 15, and at one, three, six and twelve months post-transplant.
Demographic data on the donor and recipient, type and number of transplants, aetiology of kidney disease, panel reactive anti-HLA antibodies (PRA) and histocompatibility in HLA A, B and DR antigens, were collected. Serum creatinine (μmol/l) levels were collected at day five, seven and 15, and at one, three, six and 1twelve months after transplantation. The presence of delayed graft function and biopsy-proven acute rejection was assessed following histological classification according to the Banff Classification (2018).23 Delayed graft function was defined as the need for dialysis sessions during the first postoperative week. Graft loss was defined as return to dialysis or re-transplantation.
Determination of blood tacrolimus concentrationTac concentration in whole blood was measured using ultrahigh-performance-liquid chromatography mass spectrometry (UHPLC-MS/MS; Acquity®-TQD® mass spectrometer, Waters, MA, USA) using methods previously validated by Rigo-Bonnin et al.24
Metabolism of tacrolimus according to the C/D ratioFollowing the guidelines described in the article by Thölking et al.,12 the Tac metabolism rate was determined at months one, three and six after kidney transplantation by dividing the blood Tac concentration by the corresponding daily dose of Tac (D).
The mean of the C/D ratio for months one, three and six was used to categorise the three patient groups according to their Tac metabolism rate (fast, intermediate and slow). Patients were evenly distributed into three groups. Intermediate metabolisers were grouped around the median of the C/D ratio (1.33–2.156). Patients with a C/D ratio <1.33 (ng/mL)/mg were defined as fast metabolisers and ≥2.156 (ng/mL)/mg as slow metabolisers (Fig. 2).
/mg values at 1, 3 and 6 months post-transplant. Patients with C/D < 1.33 (ng/mL)/mg (percentile 33.3%) were considered fast metabolisers, C/D ≥ 2.156 (ng/mL)/mg (percentile 66.7%) slow metabolisers and C/D 1.33-2.156, intermediate metabolisers.")
Histogram of the distribution of the variable mean of the Tac C/D (ng/mL)/mg values at 1, 3 and 6 months post-transplant. Patients with C/D < 1.33 (ng/mL)/mg (percentile 33.3%) were considered fast metabolisers, C/D ≥ 2.156 (ng/mL)/mg (percentile 66.7%) slow metabolisers and C/D 1.33-2.156, intermediate metabolisers.
Tac doses were adjusted according to clinical criteria to maintain blood concentration levels within the established therapeutic range (6−10 ng/mL). The Tac C/D at three, six and 12 months post-transplant were used to calculate intra-patient variability using a formula previously described in the literature (CV [%] = [standard deviation/mean of Tac concentration] × 100).25 Concentration values divided by the total daily dose of Tac were considered to avoid effects on intra-patient variability caused by dose adjustments during patient follow-up during the first year post-transplant.
GenotypingGenomic DNA was extracted from peripheral blood using the Maxwell®RSC Whole Blood DNA Kit or Maxwell®RSC Buffy Coat DNA Kit (Promega Corporation, Sydney, Australia) and stored at −80 °C. For genotyping, allelic discrimination reactions were performed on the 7900 H T Fast Real-Time PCR Systems apparatus (Applied Biosystems, CA, USA) using specific TaqMan probes (C__59013445_10 for CYP3A4*22 rs35599367 and C__26201809_30 for CYP3A5*3 rs776746 [Thermo Fisher Scientific, MA, USA). Genotypes were assigned using Taqman Genotyper software (Thermo Fisher Scientific). According to the functional defect associated with both allelic variants and the data reported in the literature,26 patients were classified into three metaboliser groups: fast (CYP3A5*1 carriers and CYP3A4*1/*1), intermediate (CYP3A5*3/*3 with CYP3A4*1/*1) and slow (CYP3A5*3/*3 with CYP3A4*22 carriers).
Statistical analysisCategorical variables were expressed as frequencies and percentages and continuous variables as median (interquartile range [IQR]; minimum/maximum). The percentages were compared using the χ2 test or Fisher's exact test, and the continuous variables were compared using ANOVA or the Kruskal–Wallis test depending on whether or not they followed a normal distribution, respectively. The Spearman test was used to study correlation. The Hardy–Weinberg equilibrium analysis was performed using the χ2 test on the set of all genotyped individuals. All the statistical analyses were performed with the programs IBM SPSS Statistics v. 25 (IBM Corp., Armonk, NY, USA) and GraphPad for Windows v.6.0 (La Jolla, CA, USA).
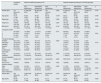
ResultsPatient characteristics and classificationOf the 1,060 kidney transplant recipients from 2013 to 2020, 425 met the requirements for this study. Their demographic characteristics are shown in Table 1; the majority of the patients were male with a median age of 57 years.
Demographic data of the study population.
| All patients studied | Patients classified according to C/D | Patients classified according to CLUSTER genotype | |||||||
|---|---|---|---|---|---|---|---|---|---|
| Fast Metabolisers | Intermediate Metabolisers | Slow Metabolisers | p | Fast Metabolisers | Intermediate Metabolisers | Slow Metabolisers | p | ||
| Gender (M/F) | 277 (65%)/148 (35%) | 81 (58%)/58 (42%) | 90 (62%)/56 (38%) | 106 (76%)/34 (24%) | 0.005 | 51 (62%)/31 (38%) | 207 (67%)/103 (33%) | 19 (58%)/14 (42%) | 0.470 |
| Age (years) | 57 (21; 17−86) | 53 (23; 19−81) | 54 (20; 17−82) | 63 (16; 25−86) | <0.001 | 56 (21; 23−79) | 58 (21; 17−86) | 53 (24; 25−81) | 0.348 |
| Weight (kg) | 71 (21; 43−145) | 71 (20; 43−145) | 68 (23; 43−136) | 73 (21; 44−116) | 0.388 | 70 (23; 43−145) | 72 (21; 43−136) | 66 (27; 48−96) | 0.190 |
| Height (cm) | 166 (49; 143−192) | 165 (48; 144−192) | 165 (47; 145−192) | 167 (13; 143−189) | 0.330 | 165 (12; 144−190) | 166 (14; 143−192) | 166 (19; 148−184) | 0.934 |
| BMI (kg/m2) | 25.8 [6.4; 17.1−42.0) | 25.1 (6.1; 17.9−40.2) | 25.9 (6.9; 17.1−42.0) | 26.3 (6.1; 17.4−39.8) | 0.148 | 25.5 (6.6; 17.9−40.2) | 26.0 (6.4; 17.3−42.0) | 24.6 (7.9; 17.1−33.7) | 0.066 |
| Transplant number: | |||||||||
| 1 | 347 (82%) | 115 (83%) | 117 (81%) | 115 (83%) | 0.701 | 68 (83%) | 252 (82%) | 27 (82%) | |
| 2 | 63 (15%) | 19 (13%) | 24 (16%) | 20 (14%) | 12 (15%) | 45 (15%) | 6 (18%) | 0.941 | |
| 3 | 8 (1.9%) | 4 (3%) | 1 (1%) | 3 (2%) | 1 (1%) | 7 (2%) | 0 (0%) | ||
| 4 | 5 (1.2%) | 1 (1%) | 3 (2%) | 1 (1%) | 1 (1%) | 4 (1%) | 0 (0%) | ||
| Transplant aetiology: | |||||||||
| Diabetes | 49 (11.5%) | 13 (9%) | 16 (11%) | 20 (14%) | 0.209 | 10 (12%) | 38 (12%) | 1 (3%) | |
| Glomerular | 100 (23.5%) | 41 (30%) | 29 (20%) | 30 (21%) | 19 (23%) | 73 (24%) | 8 (24%) | 0.797 | |
| Interstitial | 52 (12.2%) | 20 (14%) | 19 (13%) | 13 (9%) | 9 (11%) | 37 (12%) | 6 (18%) | ||
| Vascular | 42 (9.9%) | 9 (7%) | 18 (12%) | 15 (11%) | 5 (6%) | 34 (11%) | 3 (9%) | ||
| PKD | 65 (15.3%) | 17 (12%) | 29 (20%) | 19 (14%) | 12 (15%) | 47 (15%) | 6 (18%) | ||
| Undetermined | 117 (27.5%) | 39 (28%) | 35 (24%) | 43 (31%) | 27 (33%) | 81 (26%) | 9 (28%) | ||
| Donor type: | |||||||||
| Living | 67 (15.8%) | 21 (15.1%) | 26 (17.8%) | 20 (14.3%) | 0.693 | 11 (13.4%) | 50 (16.1%) | 6 (18.2%) | 0.772 |
| Cadaveric | 358 (84.2%) | 118 (84.9%) | 120 (82.2%) | 120 (85.7%) | 71 (86.6%) | 260 (83.9%) | 27 (81.8%) | ||
| HLA Incompatibility: | |||||||||
| AB (%) 0/1/2/3/4 | 3/5/29/41/22 | 5/6/29/37/23 | 0/4/33/44/19 | 4/4/26/42/24 | 0.283 | 2/8/27/42/21 | 3/4/31/41/21 | 6/3/21/40/30 | 0.545 |
| DR (%) 0/1/2 | 13/65/22 | 13/62/25 | 12/72/16 | 15/61/24 | 0.334 | 12/60/28 | 13/67/20 | 18/64/18 | 0.512 |
| Induction therapy: | |||||||||
| None | 11 (2.6%) | 3 (2.2%) | 3 (2.1%) | 5 (3.6%) | 0.384 | 1 (1.2%) | 10 (3.2%) | 0 (0%) | |
| ATG | 136 (32%) | 49 (35.7%) | 50 (34.5%) | 37 (26.4%) | 25 (30.9%) | 100 (32.5%) | 11 (33.3%) | 0.949 | |
| Basiliximab | 275 (64.7%) | 85 (62.1%) | 92 (63.4%) | 98 (70%) | 55 (67.9%) | 198 (64.3%) | 22 (66.7%) | ||
| Donor information: | |||||||||
| Gender (M/F) | 230 (54%)/192 (46%) | 79 (43%)/59 (57%) | 73 (50%)/73 (50%) | 60 (44%)/78 (56%) | 0.416 | 45 (55%)/37 (45%) | 168 (55%)/140 (45%) | 17 (53%)/15 (47%) | 0.529 |
| Age (years) | 58 (20; 15−88) | 57 (19; 17−86) | 57 (22; 28−88) | 61 (71; 15−86) | 0.376 | 57 (16; 19−84) | 58 (21; 15−88) | 54 (23; 32−83) | 0.082 |
Median data [interquartile range; minimum-maximum] are presented for the continuous variables, and the number of patients along with the percentage they represent for categorical variables.
The patients' C/D ratio was calculated from the Tac concentration and dose data at months one, three and six post-transplant, obtaining a median value of 1.72 (ng/mL)/mg, and the limit values established in the tertiles were used to classify patients according to their metaboliser capacity. Patients with a C/D ratio below 1.33 (ng/mL)/mg were considered fast metabolisers (139 patients; 32.7% of the total); patients with a C/D ratio from 1.33 to 2.16 (ng/mL)/mg were classified as intermediate metabolisers (146 patients; 34.4%); and patients with a C/D ratio greater than 2.156 (ng/mL)/mg, as slow metabolisers (140 patients; 32.9%) (Fig. 2). The demographic characteristics of the three groups of patients were homogeneous, except for age, which was significantly higher in the slow-metaboliser group (Table 1).
Genotyping of the 425 patients revealed that for CYP3A4 there were 389 patients (90.8%) homozygous for CYP3A4 *1/*1 and 39 patients (9.2%) heterozygous for CYP3A4 *1/*22, with none homozygous for CYP3A4 *22/*22. The frequency of the allele *22 was 5%, similar to that described in the literature,6 and the genotypic distribution did not deviate from the Hardy–Weinberg equilibrium (χ2 = 0.982; p = 0.322). In the case of CYP3A5, 10 patients (2.4%) were homozygous for CYP3A5 *1/*1, 72 (16.9%) were heterozygous for CYP3A5 *1/*3 and 343 (80.7%) were homozygous for CYP3A5 *3/*3, giving a frequency of 89% for the allele *3, consistent with our population of mainly Caucasian patients, and with a genotypic distribution that deviates significantly from the Hardy–Weinberg equilibrium (χ2 = 6,368; p = 0.012). Combining the alleles of CYP3A4 and CYP3A5 according to their metaboliser phenotype, patients were classified into three groups: 82 (19.3%) fast metabolisers, 310 (72.9%) intermediate and 33 (7.8%) slow. No significant differences were found in the demographic characteristics of the three groups (Table 1).
When comparing the patients included in each metaboliser group according to the two classification criteria, 47% (65/139) of fast metabolisers according to the C/D ratio were also fast according to the genetic criterion. Meanwhile, 85% (125/146) of intermediate metabolisers according to the C/D ratio were also intermediate according to the genetic criterion, and only 12% (17/140) of slow metabolisers according to the C/D ratio were slow according to the genetic criteria (Fig. 3).

After analysing the classification of the transplanted population according to the two criteria, the role of the age was examined. A slight positive correlation was found considering the age of all patients and the Tac C/D ratio (r = 0.213; p < 0.0001). Once the patients were divided into metaboliser groups according to genetic criteria, no age differences were detected between the groups (Table 1). However, when each group was stratified according to the patients' C/D ratio, patients with the smallest C/D ratio within each metaboliser group were younger (Appendix B, Figure S1 of the Supplementary Material). With the classification criteria according to the C/D ratio, the patients in the three metaboliser groups had a different median age (Table 1). However, within each metaboliser group, no correlation was detected between age and C/D ratio (fast metabolisers r = 0.052, p = 0.540; intermediate r = 0.015, p = 0.857; slow r = −0.015, p = 0.857).
Exposure to tacrolimus according to the two classification criteria studiedThe impact of metaboliser phenotypes on pre-dose blood Tac levels was assessed by comparing the medians of patients grouped according to each classification criteria. In both cases, Tac concentrations were found to be statistically lower in the fast metabolisers and statistically higher in the slow metabolisers when compared to the intermediate metaboliser group. These differences were only detected in the first days post-transplant (Fig. 4A). No significant differences were detected when Tac levels were compared between each metabolisation group: fast according to C/D vs genotype; intermediate according to C/D vs genotype; and slow according to C/D vs genotype.
, Tac doses (B) and the C/D ratio (C) of patients classified according to the C/D criterion (left-hand panels), or according to the genetic criterion (middle panels) and both criteria (right-hand panels). ***p < 0.001, **p < 0.01, *p < 0.05 comparing the groups within each classification system using the Kruskal-Wallis test, or comparing the homonymous metaboliser groups of each classification system using the Mann–Whitney test.")
Patient exposure to Tac over the first year after kidney transplant. The graphs represent the data of the mean ± standard error of blood Tac levels (A), Tac doses (B) and the C/D ratio (C) of patients classified according to the C/D criterion (left-hand panels), or according to the genetic criterion (middle panels) and both criteria (right-hand panels).
***p < 0.001, **p < 0.01, *p < 0.05 comparing the groups within each classification system using the Kruskal-Wallis test, or comparing the homonymous metaboliser groups of each classification system using the Mann–Whitney test.
Patients who were fast metabolisers in both classifications required approximately 60% higher doses of Tac than intermediate metabolisers throughout follow-up, while poor metabolisers required approximately 20% lower doses than intermediate metabolisers (Fig. 4B). At three and six months, slow metabolisers according to genotype received statistically higher doses of Tac than patients considered slow metabolisers by their C/D ratio (Fig. 4B). On the other hand, comparing the starting doses of each group with the doses required throughout the follow-up, a statistically significant decrease in the required dose was found between one week and 12 months post-transplant. Both for fast metabolisers according to C/D and for fast metabolisers according to genotype, patients were receiving a dose 15% lower than the starting dose one year post-transplant (7−8 mg median dose seven days post-transplant vs 6 mg at one year post-transplant). Both classification systems also agreed that patients considered intermediate metabolisers were on a 50% lower dose at the end of follow-up compared to the starting dose (median 6 mg at seven days vs 3 mg at one year), and slow metabolisers a 67% lower dose (median 6 mg after seven days vs 2 mg at one year) (Fig. 4B).
When analysing the C/D ratio during the first year post-transplant, patients grouped according to the C/D ratio had different levels of C/D over the course of the follow-up, as established by the actual classification criterion (Fig. 4C). For the classification according to genotype, fast metabolisers also showed significantly lower C/D ratios than the intermediate metaboliser group at all times studied, while the slow metabolisers had significantly higher C/D ratios (Fig. 4C). Over the course of the follow-up, the C/D ratios of all metaboliser groups increased in response to the decrease in dose, with C/D ratios being higher at one year than at baseline (p < 0.0001).
Patients in therapeutic rangeThe percentage of patients who were in the therapeutic range of Tac (6−10 ng/mL) was analysed. Fast metaboliser patients classified by both criteria had a higher percentage of times with subtherapeutic blood Tac concentrations (44% fast metabolisers according to C/D, 34% intermediate according to C/D, 27% slow according to C/D; p < 0.0001; 47% fast metabolisers according to genotype, 32% intermediate according to genotype, 30% slow according to genotype; p < 0.0001). Meanwhile, slow metabolisers had a higher percentage of times with supratherapeutic values (5% fast metabolisers according to C/D, 11% intermediate, 22% slow; p < 0.0001; 4% fast metabolisers according to genotype, 14% intermediate, 19% slow; p < 0.0001) (Fig. 5).
, underexposed (<6 ng/mL, in white) or overexposed (>10 ng/mL, in black) at a particular time post-transplant.")
Representation of the percentage of patients under- or over-exposed to Tac over the first year after kidney transplant. Each column represents the percentage of the patients in a particular metaboliser group on target with Tac (6-10 ng/mL, in grey), underexposed (<6 ng/mL, in white) or overexposed (>10 ng/mL, in black) at a particular time post-transplant.
The intra-patient variability during the first year was similar among the different metaboliser groups of the classification according to genotype (25.6% for fast metabolisers, 26.7% for intermediate and 23% for slow; p = 0.173) (Fig. 6). However, in the classification according to C/D, slow metabolisers had greater intra-patient variability than fast and intermediate metabolisers (29.8% vs 24.3% and 25.9%, respectively; p = 0.027). There were no differences between the two classification criteria studied except in for the slow metabolisers, with those classified according to C/D having significantly higher intra-patient variabiliy (Fig. 6).

Analysis of the intra-individual variability of patients grouped according to both Tac metabolism classification criteria. Box plots show the percentage of intra-individual variability of each group. The p-values are shown, obtained by comparing the groups of each classification system using the Kruskal–Wallis test, or comparing the homonymous metaboliser groups of each classification system using the Mann–Whitney test.
During the first year of post-transplant follow-up, there were no significant differences in creatinine levels among the different groups of the two classification criteria. No differences were found in the incidence of delayed graft function, acute rejection (Appendix B, Figure S2 of the Supplementary Material), or graft loss between one metaboliser group and another, regardless of the classification system.
DiscussionMaintaining a good immunosuppressive regimen, particularly in the early stages after kidney transplantation, is crucial for ensuring a good long-term prognosis for the graft. The high intra- and inter-patient variability of Tac make correct dosage adjustment challenging. Knowing the metaboliser phenotype of the transplant recipient can be helpful.
In recent years, several studies have proposed calculating the C/D ratio as an estimate of the transplant patient's Tac metabolisation rate.12–22 However, there is no agreed criterion for C/D studies. Thölking et al.12 divided the population into three groups according to the percentiles of their cohort, defining a C/D ratio below 1.05 (ng/mL)/mg for fast metabolisers, from 1.05 to 1.55 (ng/mL)/mg for intermediate metabolisers, and above 1.55 (ng/mL)/mg for slow metabolisers. The value of 1.05 (ng/mL)/mg to define the fast metaboliser population has also been used in other studies, although with variations in the study population.14,19,21 In our cohort, the median of the C/D ratio was higher than that reported by Thölking12 (1.74 and 1.29, respectively). If we had classified our patients according to the values proposed by Thölking et al.,12 the distribution of patients according to their metabolisation would not have been equal (53 fast, 81 intermediate and 191 slow). For that reason, we classified the patients according to the limit values established in the tertiles (C/D < 1.33 [ng/mL]/mg fast metabolisers, C/D 1.33–2.156 [(ng/mL]/mg intermediate metabolisers and C/D ≥ 2.156 [ng/mL]/mg slow metabolisers). Other authors have also used this strategy to establish the interval limit values.17,18 These discrepancies in the median values for C/D obtained in the different studies could be explained both by differences in the ethnicity of the patients included in the studies, and by the different therapeutic ranges established at each hospital.
In an attempt to establish the metaboliser groups, there are C/D studies in the literature that classify patients into two groups (fast and non-fast metabolisers)14,17,18,21,22 and others with three groups (fast, intermediate and slow). Also, and more importantly, there are discrepancies in both the number of C/D measurements to take into consideration for calculating the ratio and when they should be made throughout the post-transplant period.12,14,17,21 In our study, the C/D values increased over time, just as the dose of Tac decreased. Consequently, depending on the strategy used to establish the C/D ratio, the same patient could belong to different metaboliser groups.
By definition, the phenotype represents the result of the interaction between the individual's genotype and their relationship with the environment. To introduce genetic terms into the metabolisation of Tac, the polymorphisms of its metaboliser enzymes have to be taken into account, primarily CYP3A4 and CYP3A5.6,9,26 Following the genetic criterion, the cohort of patients in this study was divided into three groups with an uneven number of patients (82 fast metabolisers, 310 intermediate and 33 slow metabolisers) as a consequence of the low prevalence of the alleles CYP3A4*22 and CYP3A5*1 in the Caucasian population.6,27 In our study, fast metaboliser patients required at least twice the dose of slow metabolisers to maintain blood Tac levels in the therapeutic range, corroborating previously reported results.9,26 The dose differences led to a significantly different C/D ratio among the three groups defined according to fast, intermediate or slow genotype based on the cluster of CYP3A4 and CYP3A5 polymorphisms.
We compared the proportion of patients in each metaboliser group established according to genotype that coincided with the homonymous group defined according to the C/D ratio. The results showed that not all patients considered fast metabolisers according to genotype had low C/D ratios. In turn, the same discordant results were observed when analysing the intermediate population and the slow population with both criteria. To understand this discrepancy, taking into account that the rate of clearance of a drug slows down with age, the age variable was considered as a possible factor to explain these differences. The results showed that the age of the patients in the groups established according to C/D ratio was significantly different, with young patients having lower values and older patients having higher values, as previously reported in the literature.12,14,17 When we analysed the ages within each metaboliser group established according to genotype, we found a clear tendency for older patients to have high C/D ratios and vice versa. In line with other studies,11,28–30 these findings reinforce the idea that, apart from the genetic criteria, other variables (adherence to treatment, diarrhoea, dose of corticosteroids, plasma albumin, haematocrit) should also be taken into consideration for the personalised adjustment of Tac. To integrate all factors that influence Tac exposure, population pharmacokinetics (PopPK) models have been developed that include CYP3A genetic polymorphisms along with other factors that also affect Tac pharmacokinetics (age, plasma albumin, body surface area, co-medication and haematocrit).1,31,32
Periods in which patients are under- or over-exposed to Tac increase the risk of rejection and toxicity, respectively. With the two classification criteria of the metaboliser phenotype of the patients analysed in this study, the fast metaboliser patients showed a higher percentage of underexposure to Tac than the other groups. Patients considered slow metabolisers had a higher percentage of overexposure, which could be explained by their lower rate of total drug clearance. Slow metabolisers according to C/D also had greater intra-individual variability, which could be inherent to the difficulty of adjusting the dose in these patients. This trend was not seen in the case of slow metabolisers according to genotype, possibly because the sample size was smaller and the patients more homogeneous, compared to the slow metabolisers according to C/D, who may have different metaboliser genotypes.
Lastly, we investigated the influence of the metaboliser groups on the outcome of the graft over the first year post-transplant, considering creatinine levels and the incidences of delayed graft function, acute rejection and graft loss. No differences were detected between metaboliser groups regardless of the classification criterion. In previous studies that took genotype into account, no differences were found during the first year after transplantation.9 Studies that analysed longer-term outcomes of patients (two to five years) found that patients who are fast metabolisers may have a higher incidence of nephrotoxicity,19 worse kidney function,12,16,18,22 and poorer graft survival.14 However, there are studies that found no significant differences between metaboliser groups in relation to long-term graft progress,15,17 probably due to their classification system. Bartlett et al.17 divided the population into two groups (fast and non-fast metabolisers) with a cut-off C/D ratio of 2.04 (ng/mL)/mg. This value is higher than that of the rest of the studies, which consider fast metabolisers to be those with a C/D ratio of around 1.05 (ng/mL)/mg. Bartmann et al.15 considered C/D ratios from the immediate post-transplant period when there is more variability. It would be interesting for our study to do a long-term follow-up of the patients in order to analyse whether the incidence of events long-term is the same in the metaboliser groups established according to the two proposed classification criteria.
Knowing the metaboliser group according to genotype gives us the advantage of adapting the Tac dosage according to the transplant patient's metaboliser phenotype from the beginning, improving Tac exposure. Monitoring of the changes in the Tac dose over the course of the post-transplant follow-up period has resulted in the recommendation that fast metabolisers require 60% higher doses than intermediate metabolisers, while slow metabolisers require 20% less than intermediates. In contrast, although simpler, the classification of patients according to the C/D ratio has the limitation of requiring data to be gathered during the course of the patient's post-transplant follow-up and, consequently, it cannot be used as a tool to assist dosing in the immediate period after transplant when dose adjustment most needs to be fine-tuned. However, the C/D classification would help us identify which patients are most at risk in the long term.
In conclusion, in our cohort of patients, the determination of their metaboliser phenotype both according to genotype and according to the C/D ratio made it possible to distinguish between patients according to their exposure to Tac, without finding differences in adverse events for the graft in the first year after kidney transplantation. In fact, the combination of the two classification criteria would probably be a good tool for managing Tac dosage for transplant patients. PopPK modelling of Tac incorporating these parameters could be a step forward towards personalised therapy in organ transplantation, by fine-tuning the adjustment of the Tac maintenance dose.
Key concepts
- 1
The cluster study of the CYP3A4 and CYP3A5 polymorphisms has defined three populations that exhibit differences in Tac clearance. Patients carrying the functional allele *1 require at least twice as many doses as those who are not carriers.
- 2
The study of the C/D ratio divides the population into tertiles to define the metabolism of Tac. It is proposed as an additional tool for monitoring the adjustment of Tac in transplant patients.
- 3
It is important to use new tools to be able to personalise Tac dose adjustment and limit the time in which transplant recipients are under- or over-exposed, in order to minimise the risks of rejection and toxicity, respectively. Population pharmacokinetics (popPK) models that include different factors that may explain Tac variability can help to optimise personalised Tac dose adjustment post-transplant.
This study was funded with a grant from the Instituto de Salud Carlos III [National Institute of Health Carlos III] and the Spanish Ministry of Health and Consumer Affairs (PI18/01740), Sociedad Española de Nefrología [Spanish Society of Nephrology] (17PSJ026), and the European Regional Development Fund (ERDF) co-financed by ERDF funds from the programme "European Regional Development Fund (ERDF), a way of making Europe".
Conflicts of interestThe authors declare that they have no conflicts of interest.
We are grateful for the excellent technical support from B. Barroso, E. Castaño and B. Torrejón of the Centro Científico y Tecnológico de la Universidad de Barcelona (CCiT-UB) [Scientific and Technological Centre of the University of Barcelona].
The following is Supplementary data to this article:


