


In post-dilution online haemodiafiltration (OL-HDF), the only recommendation concerning the dialysate, or dialysis fluid, refers to its purity. No study has yet determined whether using a high dialysate flow (Qd) is useful for increasing Kt or ultrafiltration-infusion volume.
ObjectiveStudy the influence of Qd on Kt and on infusion volume in OL-HDF.
Material and methodsThis was a prospective crossover study. There were 37 patients to whom 6 sessions of OL-HDF were administered at 3 different Qds: 500, 600 and 700mL/min. A 5008® monitor was used for the dialysis in 21 patients, while an AK-200® was used in 17. The dialysers used were: 20 with FX 800® and 17 with Polyflux-210®. The rest of the parameters were kept constant. Monitor data collected were effective blood flow, effective dialysis time, final Kt and infused volume.
ResultsWe found that using a Qd of 600 or 700mL/min increased Kt by 1.7% compared to using a Qd of 500mL/min. Differences in infusion volume were not significant. Increasing Qd from 500mL/min to 600 and 700mL/min increased dialysate consumption by 20% and 40%, respectively.
ConclusionsWith the monitors and dialysers currently used in OL-HDF, a Qd higher than 500mL/min is unhelpful for increasing the efficacy of Kt or infusion volume. Consequently, using a high Qd wastes water, a truly important resource both from the ecological and economic points of view.
En la hemodiafiltración en línea posdilucional (HDFOL) la única recomendación acerca del líquido de diálisis (LD) hace referencia a su pureza. No se ha definido si usar flujos de baño (Qd) elevados tiene alguna utilidad para aumentar el Kt o el volumen de ultrafiltración-infusión (VI).
ObjetivoEstudiar cómo influye el Qd en el Kt y en el VI en la HDFOL.
Material y métodosEstudio cruzado prospectivo. Se incluyó a 37 pacientes a los que se les realizaron 6 sesiones de HDFOL con cada Qd: 500, 600 y 700ml/min. Veintiún pacientes se dializaron en monitor 5008® y 17 con AK-200®. Los dializadores utilizados fueron: 20 con FX800® y 17 con Polyflux-210®. El resto de los parámetros se mantuvieron constantes. Se recogieron del monitor: flujo efectivo de sangre, tiempo efectivo de diálisis, Kt final y VI.
ResultadosEncontramos que usando un Qd=600 o 700ml/min, el Kt aumentó un 1,7% respecto al uso de Qd=500ml/min. Las diferencias de VI no fueron significativas.
Aumentar el Qd de 500ml/min a 600 y 700ml/min aumenta el consumo de LD un 20 y un 40%, respectivamente.
ConclusionesEn la HDFOL con los monitores y dializadores utilizados no son útiles los Qd superiores a 500ml/min para aumentar la eficacia del Kt ni el VI, por lo que su utilización implica un despilfarro de un recurso como el agua, tan importante tanto desde el punto de vista ecológico como económico.
Post-dilutional online haemodiafiltration (OL-HDF) is a technique of replacement therapy with some advantages as compared to haemodialysis (HD), including: improved haemodynamic stability, better responses to erythropoiesis-stimulating agents and to the growth hormone in children, higher clearance of phosphates and β2-microglobulin, decreased incidence of dialysis related amyloidosis and reduction of markers/mediators of chronic inflammation, improved nutritional status and better preservation residual renal function (RRF), improvement response of liver encephalopathy, and a higher survival rate as shown in recent studies.1 This technique utilises dialysis fluid (ultrapure) for reposition and, even though it may be cost-effective,2 the use of this technique is limited by the need for a large volume of dialysate.
Kt/V or Kt are used in HD to control the dialysis dose based on minimum levels below which mortality is increased. Clinical guidelines recommend a minimum Kt/V of 1.2 or a urea reduction ratio of 65%, but different HD monitors have non-invasive built-in biosensors to measure effective ionic dialysance, which is equivalent to the clearance of urea (K). These sensors calculate the dose of dialysis with no additional analytical determinations or additional costs; it also avoids the bias associated to the inclusion of V (volume of distribution of urea) and provides a real measurement of the dose of dialysis in each session dialysis given in each session. In 1999 Lowrie et al. suggested that Kt was a marker of the dialysis dose and mortality and recommended that the minimal Kt should be 40–45L for women and 45–50 for men.3 In a study of 3009 patients, a high Kt was associated with increased survival; it was recommended to adjust Kt for the body surface area (BSA), which is a demanding strategy.4 It si not clear if the dose of dialysis is the same in OL-HDF as in other replacement therapies. However the dialysis targets should be the same for patients on OL-HDF and HD patients unless other evidence becomes available. In addition, several studies have shown that the amount of convective volume seems to be critical for improvement of survival. Convective volumes were: 15L/session in the European Dialysis Outcomes and Practice Pattern Study (DOPPS),5 17.4L/session in the Turkish study,6 21.9L in the Convective Transport Study (CONTRAST),7 and 23.1L in the Online Haemodiafiltration Survival Study (ESHOL).8 These studies documented the necessity to achieve high convective volumes to reduce mortality. Therefore we set a target volume above 24L, to comply with the highest quality standard.
The dialysis dose (or Kt) depends on the dialyser KoA, flow rate conditions (blood [Qb], dialysis fluid [Qd], and ultrafiltration), and dialysis time. Studies conducted in the 1990s found that KoA and clearance may be enhanced by increasing Qd.9,10 Results from these studies led to the increase in Qd to 700–800mL/min in an attempt to improve clearance. However, during the last years, the performance of dialysers has been improved after application of changes in the design (fibre crossing with a certain angle, fibre undulations, changes in fibre packing density and different flow distributors at the entrance and exit of dialysate compartments).11–13 Therefore, recent papers have shown that when using these new dialysers an increase of Qd has virtually no effect in HD efficacy.14–18 However it is not known whether these observations can be extrapolated to OL-HDF. We have not found studies dedicated to evaluate the effect of different Qds on OL-HDF, and therefore it is not known which is an optimal Qd in OL-HDF as assessed by its effects on Kt or VI. An elevated Qd results in high consumption of water and dialysate concentrates. High Qd should be used only if Kt or VI are improved. Water conservation is part of the overall plan for protection of natural resources, an issue that cannot be ignored by our society. Water is a dwindling commodity in many places throughout the world, and even though HD facilities should be careful of its consumption, large volumes of water are often wasted.19 Several alternatives for improvement have been proposed including recycling the rejected water, but preventing the misuse of water is certainly the first and basic step. Determining the optimal Qd in OL-HDF becomes an elementary target for more rational water consumption. In this study our aim is to examine the effect of Qd on Kt and VI in OL-HDF.
Objectives- 1.
To assess the effect of Qd (500, 600, and 700mL/min) in Kt and VI in OL-HDF.
- 2.
To quantify the amount of water that can be saved.
This is a prospective cross-over study conducted in a single dialysis facility. Subjects had to be older than 18 years and on OL-HDF for more than 3 months.
Demographics data included: sex, age, time in HD, and aetiology of renal disease. The Kt objective (Ktobj) was individually adjusted for BSA.
Thirty-seven patients were enrolled (16 women and 21 men). Monitors and dialysers were the same throughout the study. A total of 16 patients were dialysed with AK 200® and 21 with Fresenius 5008®. The membranes used were distributed as follows: 20 FX800® and 17 Polyflux 210H®. All patients underwent OL-HDF as shown below:
- -
6 sessions at Qd of 500mL/min.
- -
6 sessions at Qd of 600mL/min.
- -
6 sessions at Qd of 700mL/min.
Dialysis time, anticoagulation, and blood flow rate were unchanged throughout the entire study period. Ultrafiltration volumes were adjusted according to individual clinical requirements. When recirculation is measured by 5008®, there is a temporal increase of Qd to 800mL/min.; recirculation was routinely measured once in the session.
The following parameters were directly recorded from the monitor display: effective blood flow rate (Qbe), Qd, effective time in dialysis, final Kt (Ktf), and final VI.
Based on the collected data the following parameters were calculated:
- 1.
Mean individual values of Qbe, effective time in dialysis, VI, and Ktf at each Qd.
- 2.
Kt differences: Ktobj−Ktf.
- 3.
VI differences (target=24L): VIobj−final VI.
Qualitative variables are expressed as percentages and quantitative variables as means (standard deviation) or medians (minimum−maximum). Quantitative variables were compared by Paired t tests and ANOVA while. Chi-square tests were used to compare qualitative variables. A p value below 0.05 was considered statistically significant.
Analyses were conducted using the software SPSS version 15.0.
ResultsThe median age of the 37 patients enrolled was 67.4 years (36–92). The aetiology of CKD was: diabetes mellitus in 13, glomerular disease in 7, unknown in 6, vascular origin in 5, interstitial disease in 4, and polycystic kidney disease in 2. Dialysis was administered 3 times a week in 36 patients and twice a week in one patient because this patient had good residual renal function: mean 24h urea and creatinine clearance, greater that 5mL/min. Dialysis duration was programmed at 240min in 7 patients, 255min in 25 patients, 270min in 4 patients and 300min in one patient. A fistula was used for dialysis in thirty patients, while the remaining patients used a tunnelled catheter.
Data from a total of 565 sessions were collected: 192 at 500mL/min, 194 at 600mL/min and 179 at 700mL/min. Sessions with a deviation in prescribed treatment time, Qb or sessions with no measurements of K available due to technical problems were excluded. All patients had undergone at least 3 sessions with each Qd.
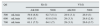
Efficacy of dialysisResults of Kt vs. VI are summarised in Table 1. Kt was slightly higher if Qd was more elevated. The opposed was observed with VI. Kt increased by 1.7% from Qd 500 vs. 600 or 700mL/min). No differences were observed in Qbe between the different Qds used, although effective time was one minute less with a Qd of 700mL/min.
OL-HDF results with different Qd.
| Qd | Effective time (min) | Effective Qb (mL/min) | Kt (L) | DiffKtobj (L) | VI (L) |
|---|---|---|---|---|---|
| 500mL/min | 246.7 (9.6) | 390 (33.6) | 61.4 (5.9) | 12.4 (6) | 27.7 (3.1)**** |
| 600mL/min | 246.3 (10) | 388.8 (34.7) | 62.5 (6.5)** | 13.4 (6.4) | 27.7 (3.2)***** |
| 700mL/min | 245 (10)* | 387.96 (37.0) | 62.9 (7.2)*** | 13.3 (8) | 27.1 (3.4) |
DiffKtobj: difference between target Kt and final Kt with different Qbs. *p<0.01 for effective time between 700 and 500–600mLmin; **p<0.01 between Kt at 500 and 600mL/min; ***p<0.005 between Kt at 500 and 700mL/min; ****p<0.009 between VI 700 and 500mL/min; *****p<0.012 between VI at 700 and 600mL/min.
Mean Ktobj was 49 (4.2)L (36–56.7L). The comparison between the achieved Kt and the target Kt is summarised in Table 1. Kt was much higher than the BSA-adjusted Ktobj for all Qd. Only one patient did not achieve the Ktobj with any of the Qds because of vascular access problems.
The 24L were not achieved in: 2 patients at 500mL/min (mean VI: 23.7L), 2 patients at 600mL/min (mean VI: 23.8L), and in 5 patients at 700mL/min (VI 23.2L). Only one patient had a “low” mean VI (20L). This was a patient with a bilateral supracondylar amputation and tunnelled central venous catheter who had trouble achieving a Qb above 350mL/min. No statistically significant differences were found between patients achieving and not achieving VI at a Qd=700mL/min (the largest group) nor Kt or effective time, although Qbe tended to be lower at 376.5 (39.3) vs. 393 (35.2)mL/min. All patients underwent dialysis using a 5008® monitor.
Differences between monitorsResults were stratified by monitor based on the various methods used to control convective volume as listed in Table 2. The trend towards a higher Kt with an elevated Qd was seen with both monitors. However, in VI, while VIs are similar at any Qd with Fresenius®, they were slightly lower with Gambro® if a higher Qd was used.
Dialysate consumptionThe calculated consumption of acid and dialysate in a session of 255min is shown in Table 3. Like this 20% and 40% more dialysate is required for 600mL/min and 700mL/min, respectively, compared to 500mL/min.
Dialysis fluid used with different dialysate flows.
| Qd | Consumed dialysate (l) session | Consumed acid (l)/session | Annual excess of dialysate/patient (L) | Annual excess in 75 patients (L) | Saved euros with Gambro 75 patients/year | Saved euros with Fresenius 75 patients/year |
|---|---|---|---|---|---|---|
| 500mL/min | 127.5 | 2.8 | – | |||
| 600mL/min | 153 | 3.4 | 4.056 | 304,200 | 9126 | 6084 |
| 700mL/min | 178.5 | 3.9 | 7956 | 596,700 | 17,901 | 11,934 |
Annual excess/patient: theoretical consumption of water when using 600 or 700 vs. 500mL/min in litres.
Excessive consumption derived from using 600 or 700 vs. 500mL/min is depicted in Table 3, not only by patient but also considering an entire facility like ours with 75 patients. It should be noted that this consumption refers to dialysate and not to global water use, which would almost double, as in order to reach a litre of ultrapure dialysate, between 0.5 and 1L of water are thrown away during pretreatment.
We have partially calculated the cost of a litre of dialysate (water+acid) to estimate the cost-saving potential. Consequently, the local cost of a litre of dialysate is 0.03 euros with Fresenius and 0.02 with Gambro. The potential cost saving of decreasing Qd per patient/year is shown in Table 3.
DiscussionThe main finding of our study is the slight improvement in Kt when increasing Qd in OL-HDF, with practically no effect in VI. Even though this difference is statistically significant, the clinical relevance of these differences is questionable, even more when considering that amount of water consumption that is necessary to achieve this modest result.
There is almost no information available on the use of a specific Qd in OL-HDF. A Qd of 700mL/min is used in most facilities for increasing the efficacy of diffusive transport, but there is no rationale for its use. In fact, only one publication has addressed the effect of Qd in OL-HDF, comparing HD to OL-HDF by using AutoFlow (AF), a built-in system in the 5008® monitors where Qd is adjusted to Qb. The authors conclude that OL-HDF may obtain a higher Kt/V using less dialysate than in HD.20 But we have not found reports comparing the effect of the various Qds on efficacy or VI in OL-HDF, which makes our study original, and practical. Just as in HD, our results prove that increasing Qd has a minimal effect on the efficacy of HD, which is even more relevant considering that it is not based on Kt/V calculated from pre- and post-dialysis urea levels or the V entered to the monitor. Our measure of dialysis adecuacy is based on the BSA-adjusted Kt, which is a rigorous assesssement.21 The target was achieved in all except one patient. In this patient which had vascular access problem the increase in Qd may not seem to be a useful strategy for improvement of dialysis adecuacy. This result shows that classical indications of elevated Qd in OL-HDF to increase efficacy should be disregarded, even more considering that decreased mortality resulting from this technique is associated with the amount of convective volume administered. It could be argued that the effective time was lower with a Qb=700mL/min, and the achieved Kt would be greater. As extending time is known to be associated with improved survival irrespective of dialysis dose,22 the effect of time loss potentially due to internal machine controls vs. improved Kt should be balanced, as both differences are not significant and possibly irrelevant, and that is why we believe that using a Qd above 500mL/min is not an effective strategy.
As far as VI, Qd has almost no effect as would have been anticipated. Automated OL-HDF techniques currently look for a high-performance convective transport, but each monitor has different control systems and dissimilar results. In fact, VI is “regulated” based on methods that nephrologists may often be unaware of. In any case, elevated Qd has clearly no effect or utility to change VI in OL-HDF. After evaluation of the predetermined objectives it was observed that only one patient was far from reaching the target 24L (achieving 20L) because of problem a poor Qb when undergoing dialysis using a tunnelled catheter. Interestingly, this patient had a bilateral supracondylar amputation. At present no BSA-adjusted VI can be prescribed as in Kt. There is a need to determine what is the VI target for each patient and to develop a fully individualised OL-HDF. For patients who were close but did not achieve the target, this was not dependant of the Qd used. These were patients whose VI was very close to 24L, and therefore the target could possibly be achieved irrespective of Qd by increasing Qb or time, or if other methods were used for enhanced performance. Lastly, many papers include VI and ultrafiltration volume in convective volume. We have not used the ultrafiltration volume, which would have helped achieve the target of 24L.
We did not compare Kt or VI resulting from the use of different monitors, as this was not the purpose of our study and it was not designed for this. We believe that the differences listed in Table 2 in terms of Kt are consistent with the results reported by Maduell et al., who showed that ionic dyalisance calculated by Fresenius monitors was higher as compared to the AK200® monitor.23 Yet, the higher VI achieved by the Ultracontrol® method is consistent with our results previously published.24
Drinking water for human use is not suitable for production of dialysate it has to be purified. For OL-HDF, the water and the dialysate have to be ultrapure independently of the amount required. Treating a patient for several hours 3 times a week requires large amounts of water plus consumption of energy and the generate undesired throwaway medical products. Mean environmental balance per HD session is estimated at 400–500L of water, 10kW/h of electricity, and up to 3kg of clinical disposables.25 As a result, in terms of dialysate manufacturing ultrapure dialysate results in economical and ecological problems. We have addressed the impact of large amounts of dialysate; but, particular attention should be paid to the fact that in order to produce 1L of dialysate another litre was lost in the treatment process; i.e., 2L of water are required for the generation of 1L of DF by reverse osmosis, thereby the consumption is double. Water is essential for life and its management is completely necessary as part of good use of natural resources; awareness of environmental issues should be raised among personnel in dialysis facilities. In a 255min session, decreasing the Qd from 700 to 500mL/min and saving 51L of dialysate in each patient may appear irrelevant however more than 500,000L of dialysate are required during one year in a dialysis facility with 75 patients or, as explained before, this equal to 1,000,000L of drinking water. In addition, by maintaining the Qd there is a significant amount of acid is saved with the consequent financial and ecological advantage. IN the present study we have analysed the cost, of 1L of dialysate including water and acid, ignoring bicarbonate and assuming that one cartridge is used per session with independently of the Qd used Even though the cost of one litre seems unimportant at first glance, we stress the relevance of n: annual consumption. Also, in our calculations water used for preparation or disinfestation has not been included in our calculations (this is why savings could be increased with optimal use), or other maintenance expenses from the water treatment plant, which may partially be affected by increased water consumption.
Our study's main limitation is that the sample size is small, but the number of dialysis sessions is enough and the cross-over design allows for comparing each patient with themselves, which increases the power of results. Our study had been conducted in a single dialysis facility, but our results may be extrapolated to all facilities working under similar conditions.
ConclusionsOur data show that increasing Qd above 500mL/min in OL-HDF provides a limited advantage. Improving the efficacy of dialysis by saving water is necessary for our environment and to meet the current and future human demand for water, thereby achieving a much more effective dialysis. Further studies should be conducted to determine whether or not using lower Qds is feasible.
Conflicts of interestDr Pérez García, Dr de Sequera, and Dr M. Albalate have been involved in meetings with Fresenius and Gambro.
This research was possible thanks to the collaboration of the nursing staff in the Haemodialysis Unit.
Please cite this article as: Albalate Ramón M, de Sequera Ortiz P, Pérez-García R, Corchete Prats E, Alcázar Arroyo R, Ortega Díaz M, et al. ¿Cuál es el flujo de baño óptimo en la hemodiafiltración on-line posdilucional?. Nefrologia. 2015;35:533–538.


