


Diabetic kidney disease (DKD), is the major microvascular complication of diabetes, affecting on 40% of type 2 diabetic patients, is the leading cause of end-stage renal failure. Microalbuminuria has limited diagnostic role in early-stage diabetic kidney disease, because renal damage usually occurs before proteinuria. Therefore, more sensitive and specific biomarkers are needed for early detection of DKD.
AimsThe aim of this study was to determine the levels of monocyte chemoattractant protein-1 (MCP-1) and Wnt inducible signaling pathway protein 1 (WISP1) in type 2 diabetic patients and using them as a better diagnostic biomarker in the early phase of DKD.
Materials and methodsA case–control study involved 180 participants aged 40≥60 years, 60 individuals are healthy, 120 person with type 2 diabetes mellitus (T2DM), they were divided in three groups by using urinary albumin/creatinine ratio (UACR): Group 1: 40 patients with normoalbuminuria (ACR<30mg/g creatinine). Group 2: 40 patients with microalbuminuria (ACR 30–300mg/g creatinine). Group 3: 40 patients with proteinuria (ACR>300mg/g creatinine). Both serum MCP-1 and WISP1 levels were measured by an enzyme-linked immunosorbent assay (ELISA) the sandwich method. The patients were also assessed for duration of disease, fasting blood glucose, glycated hemoglobin, serum creatinine and blood urea. Urine albumin/creatinine ratio was determined by measurements of albumin and creatinine in morning urine sample.
ResultsThere was a significant elevation for all parameters in diabetic patients compared to control when estimated glomerular filtration rate (eGFR) decreased. The prevalence of DKD was found higher in male than in female and the majority of patients were older than ≥60 years. A significant difference with regards to age, body mass index (BMI) and duration of DM was found p≤0.001. The mean of MCP-1 and WISP1 levels were higher in T2DM patients as compared with control group. MCP-1 was (152.85±129.78), (137.24±93.3), (70.93±24.34) and (20.43±6.04pg/mL) in proteinuria, microalbuminuria, normoalbuminuria and control groups respectively. WISP1 was (125.83±41.4), (94.58±26.9), (59.44±21.28) and (24.64±7.6pg/mL) in proteinuria, microalbuminuria, normoalbuminuria and control groups respectively. MCP-1 had a strong association with blood urea, serum creatinine and an inverse association with eGFR. There was significant positive correlation between the WISP1 and urea. In contrast there was positive correlations with creatinine only in microalbuminuria and proteinuria groups, while no correlation was found with eGFR. For early diagnosis and detection of DKD revealed that the cut-off value of serum MCP-1 was >34.9pg/mL, with 97.5% sensitivity and 100% specificity in normoalbuminuria; >41.8pg/mL, with 97% sensitivity and 100% specificity in microalbuminuria; and >49.25pg/mL with both 100% sensitivity and specificity in proteinuria. Whereas, WISP1 was >25pg/mL with 80% sensitivity and 51% specificity in normoalbuminuria; >34.3pg/mL with 50% sensitivity and 96% specificity in microalbuminuria; and >60pg/mL with 97% sensitivity and 83% specificity in proteinuria.
ConclusionThese findings proposed that MCP-1 may considered as potential predictor and prognostic biomarkers for the DKD while WISP1 may be considered as potential prognostic biomarkers for the DKD.
Diabetes mellitus (DM) is a common disease that includes a complex and heterogenous group of chronic metabolic complication characterized by hyperglycemia as a result of defects in insulin secretion, insulin action, or both. Chronic hyperglycemia is associated with long-term damage, dysfunction, and failure of multiple organs, especially kidneys, nerves and blood vessels.1 Type1 diabetes is a chronic disease that occurs when the pancreas does not produce enough insulin to control blood sugar.2 Type 2 diabetes, is a metabolic disease characterized by high blood sugar due to insulin resistance in target tissues and pancreatic cell dysfunction. Type 2 is the common form of diabetes, accounting for 90–95% of all diabetes cases.3 Diabetes remains the main form and the cause for the renal disease.4 Mortality and morbidity in diabetes are associated with chronic vascular and non-vascular complications. Diabetic kidney disease (DKD), is characterized by increased in urinary albumin excretion (microalbuminuria) and/or a decreased glomerular filtration rate (GFR) or both, which is the most important microvascular complications and the common cause of end-stage renal disease (ESRD).5 The molecular pathophysiology of DKD includes a complex interactions between hyperglycemia-induced metabolic, hemodynamic and inflammatory factors. These factors change the function and morphology of the walls of blood vessel and interact with adjacent cells causing the renal endothelial dysfunction, which plays a major role in the DKD development. Early changes in DKD, that is form of glomerular involvement in DM induce elevated in volume of glomerulae and glomerular filtration rate, followed by the accumulation of glomerular extracellular matrix, elevated excretion of albumin in urine, glomerular sclerosis and tubular fibrosis.6 Urea and creatinine are compounds that indicate normal kidney function, urea and creatinine are elevated in diabetic patients associated with the degree of renal failure.7 DKD is diagnosed by clinical biomarkers such as creatinine, urea, eGFR, and albuminuria and they are important signs of kidney dysfunction.8 New markers are essential for the early prediction of DKD. As it is hard to identify podocytes in urine, most studies have focused on the involvement of podocyte-specific proteins as markers of tubular damage.9
Human Monocyte Chemotactic Protein-1 (MCP-1) and also Chemokine Ligand 2 (CCL2) interact with different CC chemokine receptors.10 MCP-1, is a chemokin generated by mesangial cells, podocytes, tubular epithelial cell and monocytes in response to different pro inflammatory stimuli that are associated to renal inflammation, glomerular injury, tubular atrophy, and fibrosis. In the inflammation, MCP-1 promote recruitment of inflammatory cells like monocytes/macrophages into the kidney through the interaction with its receptor. MCP-1, plays an important role in the renal inflammatory disease progression, which recruits and activates inflammatory cells and macrophages to secrete factors such as TGF-β.11
Wnt/beta catenin, are a large family of secreted glycoproteins that play a central role in embryonic development, differentiation, cell motility, and cell proliferation.12 Wnt signaling pathways work in a combination with other pathways, including the fibroblast growth factor and transforming growth factor-β pathways. Alterations in Wnt/β-catenin signaling is involved in congenital defects of the kidney and urinary tract, renal carcinoma, obstructive nephropathy, chronic allograft nephropathy, and diabetic nephropathy.13 Activation of the Wnt/β-catenin signaling pathway has been shown to correlate with progression of renal injury.14
Materials and methodsStudy design and populationA case–control research involved 180 participants (120 individuals with T2DM of both gender (40≥60 years, 68 male and 52 female). For the purpose of comparisons, 60 control subjects comparable to diabetes mellitus patients were selected among subjects who were healthy in terms of non-diabetic, nonhypertensive, no other endocrine disorders or metabolic kidney diseases and were free of acute illness or infection at time of sampling. Samples collected during the period between April 2024 and July 2024, the permission for the research obtained from the out patients by the unit of diabetes consultation from Medical City, Baghdad Teaching Hospital/Baghdad, carried out accordance to ethical standard set forth for the Helsinki declaration. All patients provided written informed consent. The study was approved by the local ethics committee in our institution (MEC-56).
The study groupsOne hindered and eighty patients were included in the study. They were 120 type 2 DM patients with DM duration of <5 years to more than 10 years of the diagnosis of diabetes. These patients were divided into groups according to the UACR as following: Group I: a healthy control (N=60 with ACR<30mg/g creatinine). Group II: normoalbuminuric patients (N=40 with ACR<30mg/g creatinine). Group III: microalbuminuric patients (N=40 with ACR 30–300mg/g creatinine). Group IV: proteinuric patients (N=40 with ACR>300mg/g creatinine).
Sample collectionBlood samples: About 5–10mL of blood samples were taken from healthy persons and T2DM patients after overnight fasting. The first part of whole blood retained in Ethylenediaminetetraacetic acid (EDTA) tubes for measuring HbA1c by Tosoh automated G8 HPLC analyzer. The second part of the blood leave for 30min at room temperature allow to clot in plain tube. After coagulation, serum were separated by centrifugation at 3000×g for 10min. Serum were aspirated and divided into two Eppendorf tubes for immediate measurements of serum creatinine, urea, fasting blood glucose, the assay was applied by automated method by using Selectra Pro xl. The rest were stored at −35°C or less until assayed for serum MCP-1 and WISP1 was measured using sandwich enzyme-linked immunosorbent assay (ELISA) test using commercially available kits (SUNLONG, China). The absorbances were read in a microplate reader (HumaReader HS. Germany). The eGFR was calculated by applying the formula of modification of diet renal disease (MDRD) and expressed per 1.73m2 per minute. BMI was calculated in all subjects according to ratio depend on weight and height obtained by applying a mathematical equation, in which the weight in kilogram was divided by the square height in meter.
Urine sample: The first morning void urine samples were collected by giving each subject a befittingly disposable container. The sample collected was centrifuged to remove particulate matter, and used for the measurement of ACR by using the device FUS-3000 urinalysis.
Inclusion criteria- -
All diabetic patients age 40≥60 years for both gender were diagnosed by physicians and measurement the fasting blood glucose level and HbA1c, according to the WHO criteria.
- -
All diabetic patients were newly diagnosis with kidney disease due to diabetes mellitus.
- -
Patients with gestational diabetes; lactating women; and patients on hypolipidemic drugs, such as statins were excluded from this study.
- -
In addition, chronic obstructive pulmonary disease, cancer, HIV, treatment with immunosuppressive drugs, chemotherapy or radiotherapy, patients take antioxidant will effect on level of cytokines.
The data were analyzed by SPSS version 26 software. Descriptive statistics were tabulated as mean and standard deviation (SD). ANOVA test was used to estimate the difference in level of numeric data, Chi square was used to estimate the association between qualitative variables. The regression coefficient (r) using Linear regression analysis. Pearson test is used as appropriate for parametric analysis used to evaluate correlation between numeric data. Scattered dot diagram was used to estimate association between the variables. p value was<0.05 was considered statistically significant. Cut off point determined by ROC curve, each point on ROC curve corresponds to cut-off value and is associated with sensitivity and specificity. The equation J=Sensitivity+Specificity−1, which is applied for each point of the ROC curve. The maximum J is often used as a cut-point.
ResultsBaseline characteristics180 individuals were divided into four groups according to ACR. The patients and controls were separated into three age categories, 40–49 years old, 50–59 years old, and 60 or more years old, as shown in Fig. 1. No significant differences was observed between the diabetic patients and the control groups regarding the gender, as presented in Fig. 2.


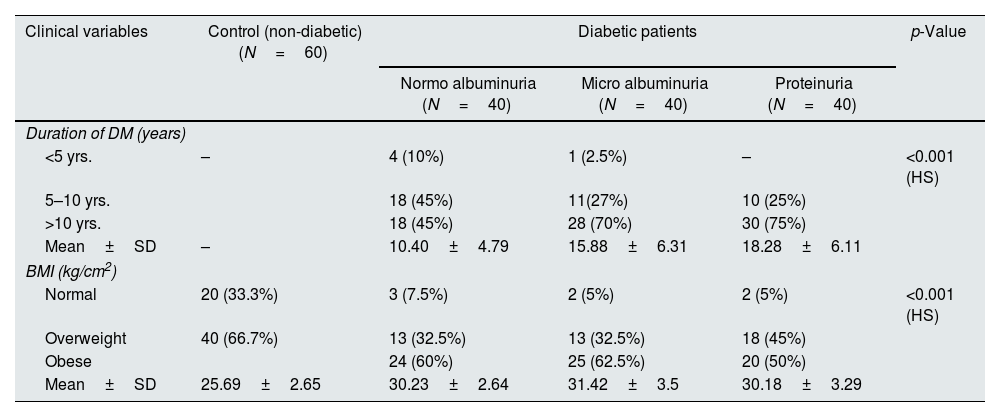
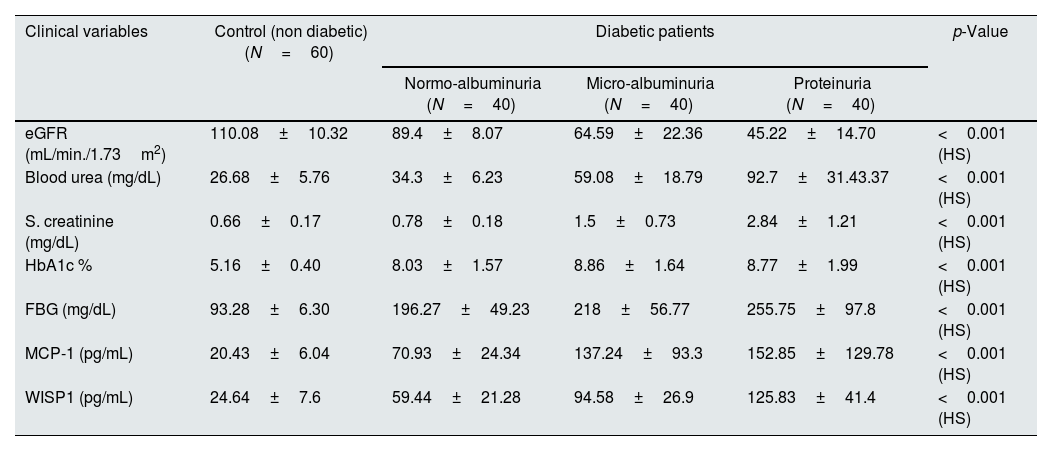
The clinical characteristics parameters of the patients and controls showed a significant differences, as observed in Table 1. There were high significant differences in levels of urea and creatinine, fasting blood glucose, eGFR, and HbA1c was (<0.001) between the diabetic patients and control groups. The proteinuria group showed a significant higher mean±SD of serum MCP-1 and WISP1(152.85±129.78) (125.83±41.44pg/mL) in comparison to microalbuminuria (137.24±93.3) (94.58±26.9pg/mL) and normoalbuminuria (70.93±24.34) (59.34±21.3pg/mL), also normoalbuminuria group had higher mean±SD in compare to control (20.43±6.04) (24.64±7.6pg pg/mL) respectively, p-value<0.001 as presented in Table 2.
The clinical characteristic of all studied groups.
| Clinical variables | Control (non-diabetic) (N=60) | Diabetic patients | p-Value | ||
|---|---|---|---|---|---|
| Normo albuminuria (N=40) | Micro albuminuria (N=40) | Proteinuria (N=40) | |||
| Duration of DM (years) | |||||
| <5 yrs. | – | 4 (10%) | 1 (2.5%) | – | <0.001 (HS) |
| 5–10 yrs. | 18 (45%) | 11(27%) | 10 (25%) | ||
| >10 yrs. | 18 (45%) | 28 (70%) | 30 (75%) | ||
| Mean±SD | – | 10.40±4.79 | 15.88±6.31 | 18.28±6.11 | |
| BMI (kg/cm2) | |||||
| Normal | 20 (33.3%) | 3 (7.5%) | 2 (5%) | 2 (5%) | <0.001 (HS) |
| Overweight | 40 (66.7%) | 13 (32.5%) | 13 (32.5%) | 18 (45%) | |
| Obese | 24 (60%) | 25 (62.5%) | 20 (50%) | ||
| Mean±SD | 25.69±2.65 | 30.23±2.64 | 31.42±3.5 | 30.18±3.29 | |
**p<0.001. HS: highly significant.
Mean±SD of biochemical markers in all studied groups.
| Clinical variables | Control (non diabetic) (N=60) | Diabetic patients | p-Value | ||
|---|---|---|---|---|---|
| Normo-albuminuria (N=40) | Micro-albuminuria (N=40) | Proteinuria (N=40) | |||
| eGFR (mL/min./1.73m2) | 110.08±10.32 | 89.4±8.07 | 64.59±22.36 | 45.22±14.70 | <0.001 (HS) |
| Blood urea (mg/dL) | 26.68±5.76 | 34.3±6.23 | 59.08±18.79 | 92.7±31.43.37 | <0.001 (HS) |
| S. creatinine (mg/dL) | 0.66±0.17 | 0.78±0.18 | 1.5±0.73 | 2.84±1.21 | <0.001 (HS) |
| HbA1c % | 5.16±0.40 | 8.03±1.57 | 8.86±1.64 | 8.77±1.99 | <0.001 (HS) |
| FBG (mg/dL) | 93.28±6.30 | 196.27±49.23 | 218±56.77 | 255.75±97.8 | <0.001 (HS) |
| MCP-1 (pg/mL) | 20.43±6.04 | 70.93±24.34 | 137.24±93.3 | 152.85±129.78 | <0.001 (HS) |
| WISP1 (pg/mL) | 24.64±7.6 | 59.44±21.28 | 94.58±26.9 | 125.83±41.4 | <0.001 (HS) |
**p<0.001. HS: highly significant.
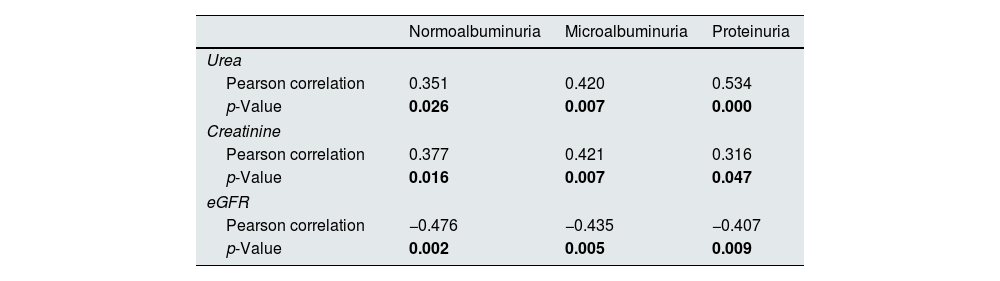
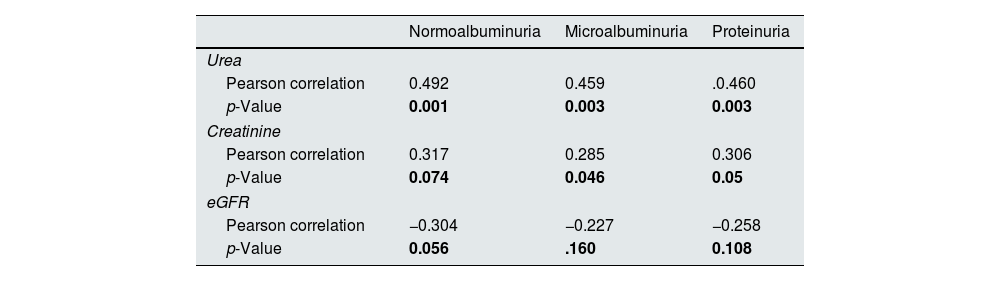
There were significant positive correlations between the MCP-1 with urea and creatinine and no significant with eGFR in three diabetic groups, as presented in Table 3. In normoalbuminuria, microalbuminuria, and proteinuria groups, there were significant positive correlations between the WISP1 and urea in all diabetic groups. In contrast there was significant positive correlations with creatinine only in microalbuminuria and proteinuria groups, while no significant with eGFR, as presented in Table 4.
Correlation between MCP-1 and chemical biomarkers in all diabetic patients groups.
| Normoalbuminuria | Microalbuminuria | Proteinuria | |
|---|---|---|---|
| Urea | |||
| Pearson correlation | 0.351 | 0.420 | 0.534 |
| p-Value | 0.026 | 0.007 | 0.000 |
| Creatinine | |||
| Pearson correlation | 0.377 | 0.421 | 0.316 |
| p-Value | 0.016 | 0.007 | 0.047 |
| eGFR | |||
| Pearson correlation | −0.476 | −0.435 | −0.407 |
| p-Value | 0.002 | 0.005 | 0.009 |
Correlation between WISP1 and chemical biomarkers in the diabetic groups.
| Normoalbuminuria | Microalbuminuria | Proteinuria | |
|---|---|---|---|
| Urea | |||
| Pearson correlation | 0.492 | 0.459 | .0.460 |
| p-Value | 0.001 | 0.003 | 0.003 |
| Creatinine | |||
| Pearson correlation | 0.317 | 0.285 | 0.306 |
| p-Value | 0.074 | 0.046 | 0.05 |
| eGFR | |||
| Pearson correlation | −0.304 | −0.227 | −0.258 |
| p-Value | 0.056 | .160 | 0.108 |
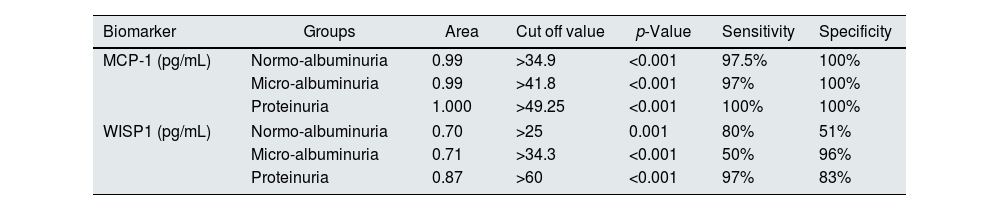
According to the ROC curve, the best cut-off points of MCP-1 were ≥34.9, ≥41.8 and ≥49.25pg/mL in normoalbuminuria, microalbuminuria, and proteinuria respectively. Sensitivity and Specificity of MCP-1 in normo-group were 97.5%, and 100%, in micro-group were 97% and 100%, and in proteinuria both 100%. ROC curve of WISP1 revealed the best cut-off points were >25, >34.3 and >60pg/mL in normoalbuminuria, microalbuminuria, and proteinuria groups respectively. According to these cut-off points the sensitivity and specificity of WISP1 were 80%, 51% in normoalbuminuria, 50%, 96% in microalbuminuria, and 97%, 83% in proteinuria (Table 5, Figs. 3 and 4).
ROC curve analysis of MCP-1 and WISP1 in all diabetic patients groups.
| Biomarker | Groups | Area | Cut off value | p-Value | Sensitivity | Specificity |
|---|---|---|---|---|---|---|
| MCP-1 (pg/mL) | Normo-albuminuria | 0.99 | >34.9 | <0.001 | 97.5% | 100% |
| Micro-albuminuria | 0.99 | >41.8 | <0.001 | 97% | 100% | |
| Proteinuria | 1.000 | >49.25 | <0.001 | 100% | 100% | |
| WISP1 (pg/mL) | Normo-albuminuria | 0.70 | >25 | 0.001 | 80% | 51% |
| Micro-albuminuria | 0.71 | >34.3 | <0.001 | 50% | 96% | |
| Proteinuria | 0.87 | >60 | <0.001 | 97% | 83% | |


In the current study a high significant differences in the age of diabetic patients and the healthy controls and show that people with older ages is more likely to be exposed to T2DM and also found we found that microalbuminuria and proteinuria were more predominant in patients having age more than 60 years, when people get older a lot of body functions is differ and the body unable to control on its metabolism and organs secretion.15 Aging increases the risk of metabolic syndrome, T2DM, and chronic inflammation in an elderly individual leading to insulin resistance (IR).16 Advanced age is a risk factor for the beginning of DKD and development of proteinuria.17 Older age, hypertension, lower eGFR, higher levels of BMI, HbA1c are use as significant risk factors for incident CKD in those with diabetes.18
With regards to the sex, the present study showed no significant differences in all the studied groups and most of patients are males. The incidence of DKD in males higher than that of females, the reason for this may attributed to the daily effort that men are exposed in compare to women.19 Men exhibited a higher prevalence of kidney disease, possibly because they are more exposed to risk factors like diabetes, hypertension as well as lifestyle choices i.e. smoking.20 One of the studies reported that male sex is an independent risk factor for DKD, this can be explained by the absence of hormones estrogen and progesterone, which have a protective effect on kidneys.21
The duration of DM was significantly longer than 10 years in micralbuminuria and proteinuria patients versus normoalbuminuric ones. Microvascular complications affected by the long duration of T2DM and a prolonged duration of T2DM of more than five years was significantly increase the risk of macrovascular complications.22 Diabetes duration is the main risk factor for various complications in patients with T2DM, especially the primary risk factor for renal complications. If the duration of diabetes is more than 5 years, microalbuminuria can occur. Without active intervention, it can progress to DKD.23 In 20–40% of T2DM patients, microalbuminuria starts within 10–15 years of onset of DM, which in another 5 years would result in proteinuria.24
The level of BMI was (<0.001) between diabetic patients and control groups, and high proportion of T2DM patients are classified as obese which confirms the strong relationship between BMI and glucose homeostasis in T2DM patients, and obesity plays an important role in the development of T2DM.25 High BMI has been shown to aggravate renal damage i.e. glomerular hyperfiltration, increased renal workload, and the promotion of IR and inflammation.20 Increases in urine albumin excretion strongly correlate with increases in body weight and other markers of obesity, like BMI.26 Increased BMI level is established as a risk factor for the development of albuminuria and linked to deterioration of renal function and increased risk of ESRD.27 Due to increased BMI, glomerular barrier becomes more vulnerable as a result of decreased secretion of adiponectin, which maintains the integrity of podocytes by binding to its receptor, resulting in podocyte reduction and proteinuria.26
Our study observed an elevation of urea and creatinine levels and decreased eGFR level in T2DM patients groups when compared with the controls, this predict a significant impairment of kidney function. The eGFR rate decreased in diabetic patients with increasing the degree of albuminuria, low eGFR in diabetic patients is linked to a higher risk of renal failure.28 The decrease in eGFR in T2DM patients is because the glomeruli become damaged, impairing the kidneys’ ability to filter waste products from the blood. eGFR, is a primary parameter to check the kidney function.17 GFR starts to decline due to diabetic glomerulopathy and is known to occur in type 2 diabetic patients.29 An increase in urea level is occurred when there is damage to the kidney or the kidney is not functioning properly.30 Serum creatinine remains unaltered and increased only when 40–50% of the kidney parenchyma damage has taken place. Urea will only be increased above the standard level when more than 60% of renal cells are no longer working, and there was decline in eGFR; Thus, inferred that urea and eGFR are not biomarkers of early stages of DKD but can be used in conjunction with albuminuria.24,31
The levels of fasting blood glucose (FBG) and HbA1c were a significant differences between the diabetic patients and controls, this results suggests hyperglycemia is the driving force behind the development of DKD. An increase in FBG and HbA1c levels was associated with an increase in urine ACR. Prolonged exposure to hyperglycemia causes renal endothelial cells to malfunction making hyperglycemia the primary factor in the development of DKD.28 Elevated blood glucose levels make the blood vessel walls more brittle, leading to blockages in small blood vessels, resulting in microvascular complications.32 The cellular mechanisms that contribute to hyperglycemia-mediated renal damage include accelerated generation of advanced glycation end products (AGEs) and activation of their receptor (RAGEs), induces increases in protein kinase C, nuclear factor-kappa B, and TGF-β. ROS may attacked the body cells particularly beta cells in the pancreas, cause low insulin production or lack of its secretion when cells damage completely.6 Chronic hyperglycaemia increased glycosylated hemoglobin production, decrease glucose uptake by liver and muscle, hyperfiltration and glomerular hypertrophy in diabetic individuals.33 Several factors contributed to increase blood glucose and HbA1c in DKD patients. One possible explanation is IR, which reduces the ability of cells to respond to insulin, leading to elevated blood glucose.34
In our study, the serum MCP-1 levels were elevated in diabetic patients with proteinuria compared with microalbuminuria and normoalbuminuria, also normoalbuminuria group had higher level compared with the healthy controls, this findings suggested that some changes would have occurred early in the pathogenesis of DKD and MCP-1 may play an important role in the progression and development of DKD.35 Inflammation is the process involving the migration of immune cells toward the site of external stimuli, which is aided and coordinated by cytokines, chemokines, and acute-phase proteins, and chronic inflammation are key factors in the onset as well as the progression of DKD.36 Kidney cells produce MCP-1 in response to a different pro-inflammatory stimuli, and its expression has been identified in DKD.37 Increased MCP-1 levels with the progression of DKD indicating the extent of renal tubular and glomerular damage.38 Increased excretion of MCP-1 in the patients with established DKD is probably due to production of MCP-1 in renal tubules, which induced by excessive exposure to plasma protein filtered from the damaged glomeruli.39 A rise of MCP-1 beside stimulated and recruited monocytes/macrophages are related to damage of the kidneys in DKD.40
The current study observed a significant increases in the level of Wnt in T2DM patients groups compared with its level in healthy group. This result was consistent with the findings of other results that reported there was increased in the Wnt protein level in patients with diabetes as compared to control s, and the higher plasma concentration of Wnt protein is associated with IR, which impairs insulin signaling in muscle cells and hepatocytes.41 Activation of the Wnt/β-catenin signaling pathway has been shown to correlate with progression of renal injury. Wnt protein has been shown to be increased in progressive kidney disease, in association with development of renal fibrosis.14 Wnt/β-catenin signaling pathway proteins were elevated in DKD.42 Other study also demonstrated increase level of Wnt protein in T2DM patients when compared to controls, it may be a pivotal biomarker in the linking the pathogenesis of obesity and T2DM.43 Wnt also leads to IR by impairing insulin signaling in hepatocytes and primary human skeletal muscle cells.44 Elevated expression of Wnt/β-catenin transcripts and proteins has been observed in the podocytes of DKD patients.45 Serum concentration of wnt protein was higher in the advanced stages of kidney disease, particularly during third stage.46 Wnt/β-catenin signaling directly interferes with podocyte function. In addition, upregulation of Wnt was detected in patients with DKD, and Wnt directly induced podocyte dysfunction.47
MCP-1 was positively correlated with levels of blood urea and serum creatinine and no significant with the eGFR in all diabetic groups. These findings are in agreement with other studies that demonstrated that MCP-1 was no significant with the eGFR, and high MCP-1 levels acts as a predictor of rapid GFR loss in DKD patients.48 Additionally, another study also revealed the association of MCP-1and renal injury in diabetic patients, which reported a significantly positive correlated with blood urea and serum creatinine, and inversely correlated with the eGFR confirm its use as a marker that reflects the degree of renal damage.39
The study shows a positive correlation between Wnt with urea in all diabetic groups, and positive correlation with creatinine only in micro- and proteinuria groups, while there were no significant with e GFR was found. Wnt is an extracellular matrix protein associated with fibrogenesis in the kidney and was elevated in patients with DKD.49 Other study also found that serum Wnt level was positive correlated with serum creatinine.50 Wnt can affect the proliferation and differentiation of kidney cells, which can lead to kidney disease and can be increased in renal injury, which may promote the development of renal fibrosis and accelerate the process of CKD.51
The current study presented that the serum MCP-1 had AUC of 1.0 in the proteinuria group, and 0.99 in microalbuminuria and normoalbuminuria groups. This value has very good diagnostic accuracy. We established the cutoff points were 49.2, 41.8, and 34.9 in the three diabetic groups respectively, if MCP-1 value was greater than these points, there was a risk.36 MCP-1 is a risk factor for the development of T2DKD, and it has predictive and prognostic values for T2DKD development.52 MCP-1 may both serve as a non-invasive prognostic biomarker of early DKD and used to assess the degree of renal injury.53
In our study, the serum level of Wnt had an AUC of 0.87 in proteinuria, and 0.71 in micro-, 0.70 in normoalbuminuria groups. After that we estimated the cut off point 60, 34.3, 25 in three diabetic groups. The Wnt canonical signaling is being activated during kidney injury while it is relatively inactive in normal adult kidney and has been implicated as a dominant regulator in the development of DKD.12 Wnt/B-catenin signaling is reactivated in a wide range of chronic kidney diseases, such as DKD and its activation is one of the most relevant mechanisms of cellular senescence in DKD.54
Therefore, the identification of novel protein biomarkers of DKD represents an important step in advancing our understanding of the physiologic perturbations that lead to ESRD and also, may elucidate the mechanisms and pathways that underlie the pathogenesis of DKD, thus facilitating the design of effective therapeutic agents.
The study limitation includes, (1) This is a single center study. (2) The design of this study did not allow for longitudinal follow up to assess the changes in this biomarker with changes in kidney disease. (3) In keeping with standard clinical practice, we did not perform kidney biopsies routinely in patients with DKD in the absence of clinical features suggestive of other kidney diseases.
ConclusionIn conclusion, the study showed that serum MCP-1 and WISP1 levels were increased in the early stages of DKD in type 2 diabetic patients. Moreover, serum levels of MCP-1 and WISP1 showed more elevation with the progression of DKD and were significantly associated with the other risk factors of DKD. Optimal cut-off points and diagnostic accuracy of serum MCP-1 and serum WISP1 for early detection of DKD were assessed. The results of this study suggest that MCP-1 and WISP1 may be considered as non-invasive diagnostic biomarkers for early detection of DKD.
Authors’ contributionStudy concept and design: A.K., H.F., H.A.
Data collection: A.K. and H.F.
Data analysis and interpretation: A.K. and H.F.
Draft of the manuscript: All authors.
Review and approval of the final version: All authors.
FundingThe authors declare no financial support for the project.
Conflict of interestThe authors declare no competing financial interest in relation to the publication of this article.
The authors would like to thank the participants who took part in the study and enabled this research to be possible. We express our gratitude to the Department of Medical laboratories at the College of Health and Medical Technologies.


