


Increased central (aortic) arterial stiffness has hemodynamic repercussions that affect the incidence of cardiovascular and renal disease. In chronic kidney disease (CKD) there may be an increase in aortic stiffness secondary to multiple metabolic alterations including calcification of the vascular wall (VC).
The objective of this study was to analyze the association of central aortic pressures and aortic stiffness with the presence of VC in abdominal aorta (AAC) and coronary arteries(CAC).
Materials and methodsWe included 87 pacientes with CKD stage 3 and 4. Using applanation tonometry, central aortic pressures and aortic stiffness were studied. We investigated the association of aortic pulse wave velocity (Pvc-f) and Pvc-f adjusted for age, blood pressure, sex and heart rate (Pvc-f index) with AAC obtained on lumbar lateral radiography and CAC assessed by multidetector computed tomography. AAC and CAC were scored according to Kauppila and Agatston methods, respecti-vely. For the study of the association between Pvc-f index, Kauppila score, Agatston score, central aortic pressures, clinical parameters and laboratory data, multiple and logistic regression were used. We investigated the diagnosis performance of the Pvc-f index for prediction of VC using receiver-operating characteristic (ROC).
ResultsPvc-f and Pvc-f index were 11.3 ± 2.6 and 10.6 m/s, respectively. The Pvc-f index was higher when CKD coexisted with diabetes mellitus (DM). AAC and CAC were detected in 77% and 87%, respectively.
Albuminuria (β = 0.13, p = 0.005) and Kauppila score (β = 0.36, p = 0.001) were independently associated with Pvc-f index. In turn, Pvc-f index (β = 0.39, p = 0.001), DM (β = 0.46, p = 0.01), and smoking (β = 0.53; p = 0.006) were associated with Kauppila score, but only Pvc-f index predicted AAC [OR: 3.33 (95% CI: 1.6−6.9; p = 0.001)].
The Kauppila score was independently associated with the Agatston score (β = 1.53, p = 0.001). The presence of AAC identified patients with CAC with a sensitivity of 73%, a specificity of 100%, a positive predictive value of 100% and a negative predictive value of 38%.
The Vpc-f index predicted the presence of CAC [OR: 3.35 (95% CI: 1.04−10.2, p = 0.04)]. In the ROC curves, using the Vpc-f index, the AUC for AAC and CAC was 0.82 (95%CI: 0.71−0.93, p = 0.001) and 0.81 (95% CI: 0.67–0.96, p = 0.02), respectively.
ConclusionsWhen stage 3–4 CKD coexists with DM there is an increase in aortic stiffness determined by the Vpc-f index. In stage 3–4 CKD, AAC and CAC are very prevalent and both often coexist. The Vpc-f index is independently associated with AAC and CAC and may be useful in identifying patients with VC in these territories.
El aumento de la rigidez arterial central (aórtica) tiene repercusiones hemodinámicas con efectos nocivos cardiovasculares y renales. En la enfermedad renal crónica (ERC) puede existir un aumento de la rigidez aórtica secundaria a múltiples alteraciones metabólicas entre ellas la calcificación de la pared vascular (CV).
El objetivo de este estudio fue analizar la asociación de la rigidez aórtica y de la hemodinámica central con la presencia de CV en dos territorios, aorta abdominal (CAA) y arterias coronarias (CC).
Material y métodosSe incluyeron 87 pacientes con ERC estadio 3 y 4. Usando tonometría de aplanamiento se estudiaron la hemodinámica central y la rigidez aórtica. Esta se determinó mediante la velocidad de pulso carótida-femoral (Vpc-f). A partir de la Vpc-f se calculó el índice de la VPc-f (iVpc-f) que considera otras variables que influyen en la Vpc-f como edad, presión arterial, sexo y frecuencia cardiaca.
La presencia de CAA se valoró mediante radiográfía lateral de columna lumbar calculándose el índice de Kauppila (iKauppila) y las CC mediante tomografía computarizada multidetección por el método de Agatston calculándose su índice (iAgatston).
Para el estudio de la asociación entre iVpc-f, iKauppila, iAgatston, presión aórtica central, parámetros clínicos y datos de laboratorio se usaron la regresión múltiple y la regresión logística. La capacidad discrimitativa del iVpc–f para evaluar la presencia de CAA y CC se determinó mediante el área bajo la curva (ABC) de ROC (receiver-operating characteristic).
ResultadosLa Vpc-f y el iVpc-f fueron 11,3 ± 2,6 y 10,6 m/s, respectivamente. El iVpc-f fue mayor cuando la ERC coexistía con diabetes mellitus (DM). Se detectaron CAA y CC en 77% y 87%, respectivamente.
La albuminuria (β = 0,13, p = 0,005) y el iKauppila (β = 0,36, p = 0,001) se asociaron de forma independiente con la magnitud del iVpc-f. A su vez, el iVpc-f (β = 0,39, p = 0,001), la DM (β = 0,46, p = 0,01) y el tabaquismo (β = 0,53; p = 0,006) se asociaron con la intensidad del iKauppila, pero solo el iVpc-f predijo la existencia de CAA [(OR: 3,33 (IC 95%: 1,6-6,9; p = 0,001)].
El iKauppila se asoció de forma independiente con el iAgatston (β = 1,53, p = 0,001). La presencia de CAA identificó pacientes con CC con una sensibilidad del 73%, una especificidaddel 100%, un valor predictivo positivo del 100% y un valor predictivo negativo del 38%.
El iVpc-f predecía la presencia de CC [OR: 3,35 (IC 95%:1,04-10,2, p = 0,04)]. En las curvasROC, usando el iVpc-f, el ABC para las CAA y CC fue 0,82 (IC 95%: 0,71–0,93, p = 0,001) y 0,81(IC 95%: 0,67-0,96, p = 0,02), respectivamente.
ConclusionesCuando la ERC se asocia con DM hay un aumento de la rigidez aórtica determinada por el iVpc-f. En la ERC estadios 3-4 son muy prevalentes las CAA y CC que, con mucha frecuencia, coexisten. El iVpc-f se asocia de forma independiente con las CAA y CC, y puede ser útil para identificar pacientes con CV en estos territorios.
Patients with chronic kidney disease (CKD) have a high prevalence and incidence of cardiovascular disease (CVD). The presence of traditional risk factors of vascular disease such as arterial hypertension (HTN), diabetes mellitus (DM) and dyslipidemia, which are more frequent in CKD, and other factors with the capacity to produce vascular damage closely related to kidney failure, such as chronic inflammation, oxidative stress and vascular calcifications (VC), among others, contribute to the high cardiovascular morbidity and mortality in CKD.1,2
In CKD, an increase in central (aortic) arterial stiffness can be observed, which summarizes the perpetuation, over time, of all these vasculopathic factors. Increased central arterial stiffness has repercussions on central hemodynamics with effects on cardiac structure and function and on perfusion of organs such as brain and kidney. In fact, in subjects with CKD, increased aortic stiffness has been shown to be a predictor of mortality, cardiovascular events and progression of renal function deterioration.3–5
The VCs observed in CKD extend through different vascular territories and their number and intensity increase with the degree of renal failure.6 Two pathological processes lie beneath the CVs. First, calcification of the intima, which is also frequent in the population without kidney disease, and, second, calcification of the media layer of the vascular wall, which is more frequent in CKD, advanced age and DM. These processes, which frequently coexist, have different impacts on cardiovascular events. Calcification of the intima would be associated with occlusive arterial disease due to atherosclerosis, whereas calcification of the media layer would lead to increased arterial stiffness, and consequently, changes in central hemodynamics with repercussions on cardiac structure and function (cardiac hypertrophy and heart failure) and changes in the perfusion of target organs such as the kidney, among others.7
Although imaging methods are useful in detecting VCs, it is possible that the combined use of imaging techniques, circulating biomarkers8 and arterial function tests such as arterial stiffness may aid in the diagnosis of VCs.
Given the possible impact of CVs, and other factors associated with CKD, on aortic stiffness, the purpose of this study was to analyze, in subjects with stage 3–4 CKD, the degree of association of CVs in two territories, abdominal aorta and coronary arteries, with aortic stiffness as determined by carotid-femoral pulse velocity (Vp)c-f.
Material and methodsPatientsWe studied 87 patients with stable CKD stage 3–4 (estimated glomerular filtration rate (eGFR): 15−60 ml/min/1.73 m2), that were evaluated and followed as out patients in the nephrology clinic of the university hospital. Patients with and without DM were included. Patients had to have stable renal function and no changes in medication (antihypertensive, antidiabetic, phosphorus binders and vitamin D) in the last 3 months. Subjects with atrial fibrillation, immunosuppressive therapy, oncological processes or cardiovascular events in the last 6 months were excluded.
Biochemical parameters including creatinine, lipids, phosphocalcic metabolism parameters [calcium, phosphorus, parathormone (PTH) and 25-hydroxycholecalciferol (25-OHVit.D)], ultrasensitive C-reactive protein (hsCRP), uric acid, hemogram, and, in subjects with DM, glycosylated hemoglobin, were determined in blood. The eGFR was calculated using the CKD-EPI (chronic kidney disease, epidemiology) formula.9 In all patients, the albumin/creatinine ratio was determined in the first morning urine.
It was recorded those cardiovascular events that required hospital admission (ischemic heart disease, stroke, heart failure) and the presence of peripheral artery disease diagnosed by clinical signs and symptoms or an ankle-brachial index of less than 0.9. Smoking was investigated by considering as smokers those who were active or had quit smoking versus those that never smoked.
Aortic arterial stiffness and aortic and coronary calcifications were studied within 21 days after of the determination of laboratory parameters.
All patients gave their consent after being informed and the study met all the ethical criteria of the institution where it was performed.
Study of central hemodynamics and aortic arterial stiffnessAfter the measurement of weight and heigth and resting in the supine position for 15 min, brachial arterial pressure (bBP) was measured (mean of 3 determinations) using an Omron M3 IT (Omron electrónica Iberia, S.A.U., Madrid). The study of central arterial pressure (cBP) and carotid-femoral pulse velocity (Vpc-f) was performed by applanation tonometry using a SphygmoCor device (AtCor Medical, Sydney, Australia) according to the methodology previously described.10 Briefly, from the pulse wave obtained by tonometry over the radial artery and using a generalized transfer function, central systolic arterial pressure (cSAP), central diastolic arterial pressure (cDAP), central mean arterial pressure (cMAP) and central pulse pressure (cPP) were obtained. For the determination of Vpc-f the pulse wave was obtained sequentially over the common carotid artery and the femoral artery, calculating the travel time between the two points from the difference between the R wave of the simultaneous electrocardiographic recording and the onset of the pulse wave at the respective arterial sites.
The Vp indexc-f (iVpc-f), was obtained from the values of Vpc-f including other variables that influence Vpc-f such as age, sex, blood pressure and heart rate.11 The tonometry for the determination of central hemodynamics and Vpc-f was always performed by the same investigator who was unaware of the values of VC.
Following the recommendations of the European Society of Hypertension and the evidence that Vp valuesc–f ≥12 m/s have negative prognostic impact in subjects with advanced CKD,12,13 patients were subdivided into 2 groups: with Vp c–f values ≥12 m/s and <12 m/s.
Study of vascular calcificationsAbdominal aortic calcifications (AAC)A lateral X-ray of the lumbar spine was performed to evaluate AAC. The reading and scoring of the degree of calcification (iKauppila) was always done by the same investigator following the methodology described.14 This investigator was unaware of the laboratory and arterial function data.
Coronary calcifications (CC)Due to the requirement that all the parameters studied (abdominal and coronary calcifications, aortic stiffness and laboratory variables) be performed within a relatively short period of time, only 40 patients had the multislice computed tomography (CT) scan without contrast performed to assess the presence of CC. A 64-detector multidetector CT, General Electric (Boston, Massachusetts, USA), was used. The Agatston method was used to quantify coronary calcium.15 The presence of coronary calcium is defined as an area at the coronary level with a threshold of more than 130 Hounsfield units (HU). A score is calculated for each lesion by multiplying the area by a cofactor that depends on the maximum HU value of each lesion. The final calcification score is obtained by adding the left coronary, anterior descending, circumflex, and right coronary scores and it is expressed as the Agatston index (iAgatston). The investigator who performed the heart CT was unaware of the laboratory results and the data of arterial function.
Given that a value greater than 400UH16 is considered severe calcification with a high predictive capacity for coronary events, this value was adopted as the threshold for establishing 2 categories of CC.
Statistical analysisCategorical variables are expressed as absolute and relative frequencies. Continuous variables are expressed as mean ± standard deviation (x ± SD) if distribution was normal or as median and interquartile range (IQR) if the distribution was not normal. In case that the variable values had a highly skewed distribution, such as iKauppila, iAgatston, and urine albumin/creatinine ratio, they were converted to their natural logarithms.
The Shapiro-Wilk test was used to establish the normality of the distribution of the variables. The comparison of qualitative variables was done using the χ2 test. Normally distributed quantitative variables were compared using Student's t-test and the Mann Whitney test in the case of non-normal distribution.
Since 13% of patients had an iKauppila value of zero, the aortic calcification score was divided into quartiles (≤1; 2–6; 7–11; ≥12); comparison of Vpc-f values between quartiles, was performed using analysis of variance (ANOVA) with Scheffé's test for post hoc multiple comparisons.
The effect of some covariates on VC in certain groups was evaluated by analysis of covariance (ANCOVA).
The relationship between variables was analyzed using Pearson's or Spearman's correlation coefficient depending on their distribution of the values. The independent relationship between variables was investigated using multiple linear regression by selecting potential covariates that previously demonstrated significant correlation. Stepwise logistic regression was used to evaluate the independent effects and predictive value of various variables on the presence of aortic and coronary CV.
ROC (receiver operating characteristic) curves were used to establish the value of iVpc-f with the highest sensitivity and lowest number of false positives (1-specificity) in the prediction of the presence of AAC and CC.
A value of p < 0.05 was considered significant. All statistical analyses were performed with the statistical program IBM SPSS version 25 for Windows.
ResultsWe studied 87 patients, with a median age of 66 (14) years. A 65.5% were men, with CKD stage 3 (56%) and 4 (44%). Forty-six percent of all patients had DM. Considering the whole group, the value of Vpc-f was 11.3 ± 2.6 m/s and that of iVpc-f 10.6 ± 1 m/s.
The study of AAC was performed in 83 patients and that of CC in 40. Two of the latter were excluded from the final analysis due to technical deficiencies of the heart CT. A 77% of patients had AAC and 87% had CC.
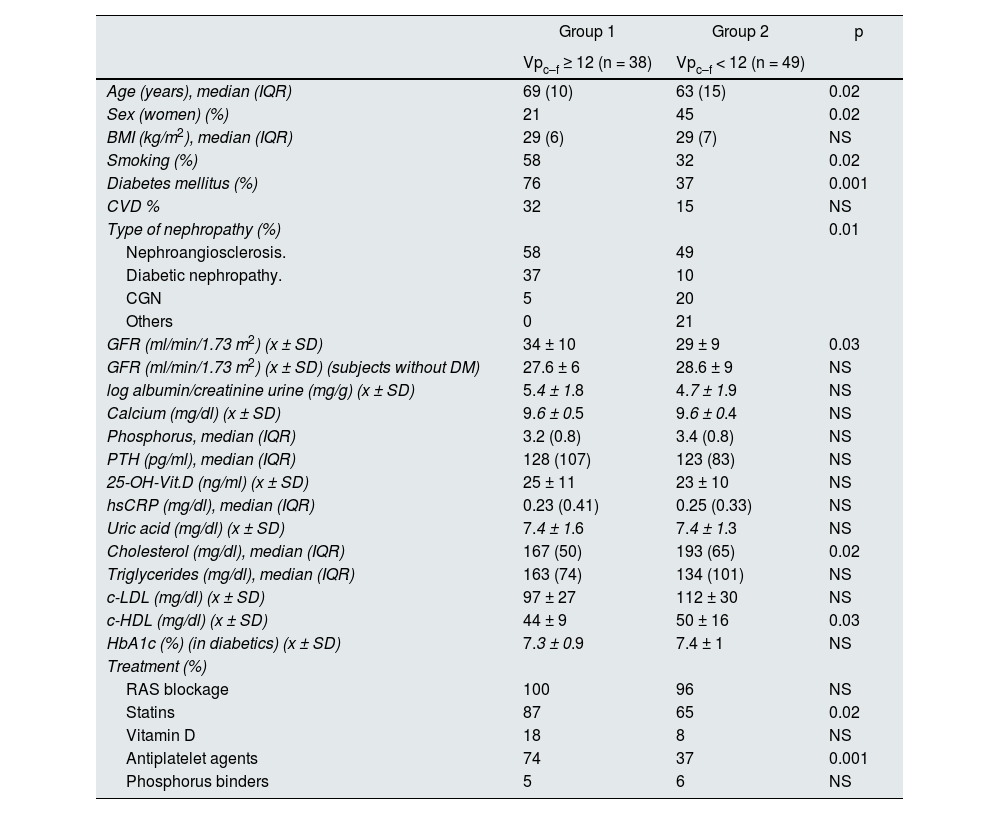
Table 1 shows the clinical and laboratory data in patients with Vpc-f ≥ 12 m/s and with Vpc-f < 12 m/s. In the group with Vpc-f ≥ 12 m/s there were higher number of men, more DM and smoking. Age was significantly higher in this group. The percentage of patients with CVD was quantitatively, but not significantly, higher in the group with Vpc-f ≥ 12 m/s, in which there were also greater numbers of subjects treated with statins and antiaggregants. The eGFR was higher in the group with Vpc-f ≥ 12 [34 ± 10 vs. 29 ± 9 m/s, p = 0.03]. However, when only those without DM were considered or adjustment was made for the presence of DM, the difference in GFR between the groups disappeared.
Clinical data and laboratory parameters in groups classified according to the carotid-femoral pulse velocity (Vpc-f).
| Group 1 | Group 2 | p | |
|---|---|---|---|
| Vpc–f ≥ 12 (n = 38) | Vpc–f < 12 (n = 49) | ||
| Age (years), median (IQR) | 69 (10) | 63 (15) | 0.02 |
| Sex (women) (%) | 21 | 45 | 0.02 |
| BMI (kg/m2), median (IQR) | 29 (6) | 29 (7) | NS |
| Smoking (%) | 58 | 32 | 0.02 |
| Diabetes mellitus (%) | 76 | 37 | 0.001 |
| CVD % | 32 | 15 | NS |
| Type of nephropathy (%) | 0.01 | ||
| Nephroangiosclerosis. | 58 | 49 | |
| Diabetic nephropathy. | 37 | 10 | |
| CGN | 5 | 20 | |
| Others | 0 | 21 | |
| GFR (ml/min/1.73 m2) (x ± SD) | 34 ± 10 | 29 ± 9 | 0.03 |
| GFR (ml/min/1.73 m2) (x ± SD) (subjects without DM) | 27.6 ± 6 | 28.6 ± 9 | NS |
| log albumin/creatinine urine (mg/g) (x ± SD) | 5.4 ± 1.8 | 4.7 ± 1.9 | NS |
| Calcium (mg/dl) (x ± SD) | 9.6 ± 0.5 | 9.6 ± 0.4 | NS |
| Phosphorus, median (IQR) | 3.2 (0.8) | 3.4 (0.8) | NS |
| PTH (pg/ml), median (IQR) | 128 (107) | 123 (83) | NS |
| 25-OH-Vit.D (ng/ml) (x ± SD) | 25 ± 11 | 23 ± 10 | NS |
| hsCRP (mg/dl), median (IQR) | 0.23 (0.41) | 0.25 (0.33) | NS |
| Uric acid (mg/dl) (x ± SD) | 7.4 ± 1.6 | 7.4 ± 1.3 | NS |
| Cholesterol (mg/dl), median (IQR) | 167 (50) | 193 (65) | 0.02 |
| Triglycerides (mg/dl), median (IQR) | 163 (74) | 134 (101) | NS |
| c-LDL (mg/dl) (x ± SD) | 97 ± 27 | 112 ± 30 | NS |
| c-HDL (mg/dl) (x ± SD) | 44 ± 9 | 50 ± 16 | 0.03 |
| HbA1c (%) (in diabetics) (x ± SD) | 7.3 ± 0.9 | 7.4 ± 1 | NS |
| Treatment (%) | |||
| RAS blockage | 100 | 96 | NS |
| Statins | 87 | 65 | 0.02 |
| Vitamin D | 18 | 8 | NS |
| Antiplatelet agents | 74 | 37 | 0.001 |
| Phosphorus binders | 5 | 6 | NS |
c-HDL: high-density lipoprotein; c-LDL: low-density lipoprotein; CVD: cardiovascular disease; GFR: glomerular filtration rate; CGN: chronic glomerulonephritis; HbA1c: glycosylated hemoglobin; BMI: body mass index; NS: not significant; hs-CRP: ultrasensitive C-reactive protein; PTH: parathormone; IQR: interquartile range; RAS: renin-angiotensin system; x ± DE: mean ± standard deviation.
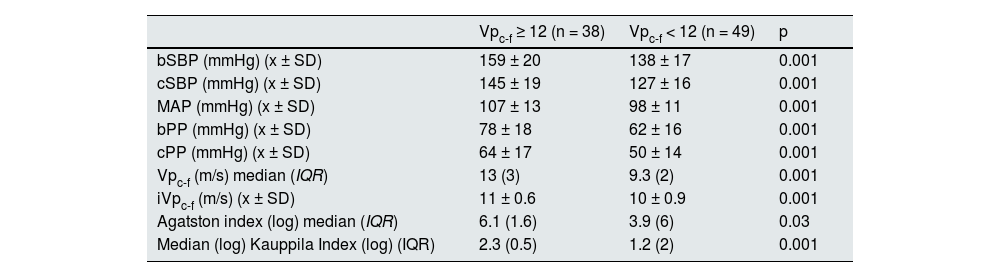
PASb, PASc, PPb and PPc and iVpc-f were significantly higher in the group with Vpc-f ≥ 12 m/s (Table 2).
Hemodynamic parameters, arterial stiffness and vascular calcification in the groups according to carotid-femoral pulse velocity (Vpc-f).
| Vpc-f ≥ 12 (n = 38) | Vpc-f < 12 (n = 49) | p | |
|---|---|---|---|
| bSBP (mmHg) (x ± SD) | 159 ± 20 | 138 ± 17 | 0.001 |
| cSBP (mmHg) (x ± SD) | 145 ± 19 | 127 ± 16 | 0.001 |
| MAP (mmHg) (x ± SD) | 107 ± 13 | 98 ± 11 | 0.001 |
| bPP (mmHg) (x ± SD) | 78 ± 18 | 62 ± 16 | 0.001 |
| cPP (mmHg) (x ± SD) | 64 ± 17 | 50 ± 14 | 0.001 |
| Vpc-f (m/s) median (IQR) | 13 (3) | 9.3 (2) | 0.001 |
| iVpc-f (m/s) (x ± SD) | 11 ± 0.6 | 10 ± 0.9 | 0.001 |
| Agatston index (log) median (IQR) | 6.1 (1.6) | 3.9 (6) | 0.03 |
| Median (log) Kauppila Index (log) (IQR) | 2.3 (0.5) | 1.2 (2) | 0.001 |
iVPc-f: carotid-femoral pulse velocity index; bPAS: brachial systolic blood pressure; cPAS: central systolic blood pressure; MAP: mean arterial pressure; bPP: brachial pulse pressure; cPP: central pulse pressure.
The AAC and CC score was significantly higher in the group with Vpc-f ≥ 12 m/s (Table 2).
The iVpc-f increased progressively with iKauppila quartiles (Fig. 1A). Patients with an iAgatston > 400 UH score had a greater iVpc-f than those with a score ≤ 400 (Fig. 1B).
 according to quartiles of the Kauppila index (iKauppila) (A) and the Agatston index (iAgatston) (B).")
Table 3 shows the correlations between iVpc-f, iKauppila and iAgatston with other variables. There was a significant direct correlation between iVpc–f and iKauppila, iAgatston, smoking, BMI (body mass index), presence of DM and cardiovascular disease, and an inverse correlation with c-HDL. The iKauppila and iAgatston had a direct and significantl correlation, and both correlated directly with arterial pulsatility parameters (PPb and PPc). The degree of AAC (iKauppila) correlated directly with age, smoking, BMI and presence of DM. No significant correlation was observed between iVpc-f and CC with phosphocalcic metabolism parameters, inflammatory parameters or uric acid values.
Correlation between VPc-f, Kauppila and Agatston with other variables.
| DM | BMI | Tobacco | Alb/creat. | iAgatston | iKauppila | c-HDL | ||
|---|---|---|---|---|---|---|---|---|
| iVpc–f | r | 0.380 | 0.392 | 0.231 | 0.377 | 0.375 | 0.480 | −0.422 |
| p | 0.001 | 0.001 | 0.02 | 0.001 | 0.02 | 0.001 | 0.001 |
| Age | DM | BMI | Tobacco | Alb/creat. | iAgatston | bPP | cPP | CVD | ||
|---|---|---|---|---|---|---|---|---|---|---|
| iKauppila | r | 0.508 | 0.365 | 0.262 | 0.357 | 0.221 | 0.622 | 0.430 | 0.393 | 0.285 |
| p | 0.001 | 0.001 | 0.017 | 0.001 | 0.04 | 0.001 | 0.001 | 0.001 | 0.01 |
| iKauppila | bPP | cPP | c-HDL | Alb/creat. | iVpc-f | ||
|---|---|---|---|---|---|---|---|
| iAgatston | r | 0.622 | 0.331 | 0.259 | −0.367 | 0.347 | 0.375 |
| p | 0.001 | 0.04 | 0.05 | 0.05 | 0.02 | 0.02 |
Alb/creat: albumin/creatinine; BMI: body mass index; c-HDL: high-density lipoproteins; DM: diabetes mellitus; CVD: cardiovascular disease; bPP: brachial pulse pressure; cPP: central pulse pressure; Vpc-f: femoral carotid pulse velocity.
Compared to patients without diabetes, those with DM had higher values of iVpc–f [10.8 (1.1) vs. 10.3 (1.5) m/s; p = 0.001] and also greater values of log iKauppila [2 (1) vs. 0.69 (2); p = 0.009]. Since patients with DM were older and had higher BMI, adjustment was made for these variables (ANCOVA) showing that significant differences persisted in iVpc-f and iKauppila. For any value of MAP, subjects with DM had a higher Vpc-f than non-diabetics (Fig. 2).
 and mean arterial pressure (MAP) in patients with and without diabetes mellitus (DM).")
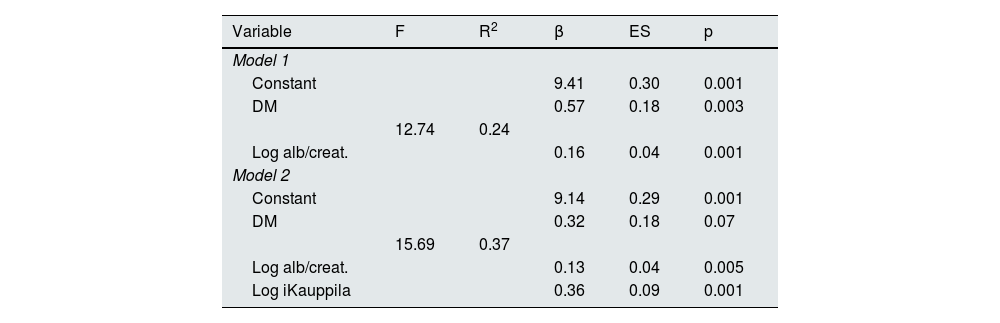
In the multiple regression analysis, the presence of DM and urinary albumin excretion were significantly associated with the value of iVpc-f. When iKauppila was introduced in the model, the participation of DM was attenuated (Table 4).
Regression model of association of variables with the carotid-femoral pulse velocity index (iVpc-f).
| Variable | F | R2 | β | ES | p |
|---|---|---|---|---|---|
| Model 1 | |||||
| Constant | 9.41 | 0.30 | 0.001 | ||
| DM | 0.57 | 0.18 | 0.003 | ||
| 12.74 | 0.24 | ||||
| Log alb/creat. | 0.16 | 0.04 | 0.001 | ||
| Model 2 | |||||
| Constant | 9.14 | 0.29 | 0.001 | ||
| DM | 0.32 | 0.18 | 0.07 | ||
| 15.69 | 0.37 | ||||
| Log alb/creat. | 0.13 | 0.04 | 0.005 | ||
| Log iKauppila | 0.36 | 0.09 | 0.001 | ||
alb/creat: urine albumin/creatinine; DM: diabetes mellitus; iKauppila: Kauppila index; Log, logarithm.
The iVpc-f, the presence of DM and smoking were the only variables significantly associated with the intensity of AAC as determined by iKauppila (Table 5A). When in the logistic regression the existence or not of AAC was considered as a dependent variable, only iVpc-f was illustrative of its presence (Table 5B).
Regression model of association of variables with AAC intensity (A) and OR of factors associated with the presence of AAC (B).
| A) | |||||
|---|---|---|---|---|---|
| Variable | F | R2 | β | ES | p |
| Constant | −3.06 | 1.07 | 0.005 | ||
| iVpc–f | 0.390 | 0.10 | 0.001 | ||
| 15.51 | 0.37 | ||||
| DM | 0.465 | 0.19 | 0.019 | ||
| Smoking | 0.531 | 0.18 | 0.006 | ||
| B) | ||||
|---|---|---|---|---|
| Variable | β | EN | OR (95% CI) | p |
| iVpc-f | 1.59 | 0.41 | 3.33 (1.6−6.9) | 0.001 |
DM: diabetes mellitus; iVpc-f: carotid-femoral pulse velocity index; CAA: abdominal aortic calcification.
The overall prevalence of CC was 87% (77% in the group without DM and 92% in the group with DM). The intensity of CC was also higher in patients with diabetes; a iAgatston > 400 UH was observed in 52% of patients with DM and in only 38% of non-DM.
The magnitude of AAC was the only variable independently associated with the intensity of CC (β = 3.12, p = 0.001) (Table 6A). The presence of CAA identified patients with CC with a sensitivity of 73%, a specificity of 100%, a positive predictive value of 100%, and a negative predictive value of 38% (X2 for CC present/absent vs. CAA present/absent: p = 0.002).
Regression model of the association of variables with CC intensity (Agatston index).
| Variable | F | R2 | β | ES | p |
|---|---|---|---|---|---|
| Model 1 | |||||
| Constant | 2.76 | 0.55 | 0.001 | ||
| 21.87 | 0.39 | ||||
| iKauppila | 1.53 | 0.32 | 0.001 | ||
| B) Estimated OR of the logistic regression model for predicting the presence of coronary calcifications. | ||||
|---|---|---|---|---|
| Variable | β | Es | OR (95% CI) | p |
| iVpc-f | 1.2 | 0.59 | 3.35 (1.04−10.2) | 0.04 |
iKauppila: Kauppila index; iVpc–f: carotid-femoral pulse velocity index; CC: coronary calcifications.
The iVpc-f entered the logistic regression model as a predictor of the presence of CC (OR: 3.35, 95% CI: 1.04–10.2; p = 0.04) (Table 6B).
In the ROC curves, the area under the curve for AAC and CC was 0.82 (95% CI: 0.71–0.93, p = 0.001) and 0.81 (95% CI: 0.67–0.96, p = 0.02), respectively (Fig. 3 A and B). An iVp c-f value ≥ 10.25 m/s predicted the presence of AAC with a sensitivity of 80% and a specificity of 65%. An iVp c-f value ≥ 10,12 m/s predicted the presence of CC with a sensitivity of 76% and a specificity of 80%.
Discussion curve analysis for abdominal aortic (A) and coronary (B) calcifications using the iVpc-f (carotid-femoral pulse velocity index). ABC: area under the curve.")
Our study demonstrates that in subjects with CKD stage 3 and 4 there is an increase in aortic arterial stiffness, independent of the values of BP and age, when associated with the presence of DM, and a high prevalence of AAC and CC that frequently coexist. There is, moreover, a close and reciprocal relationship between aortic stiffness and the presence of VC. AAC is associated with increased central stiffness and, in turn, increased aortic stiffness is related to the presence of both AAC and CC.
Several studies have demonstrated an increase in aortic stiffness assessed by Vpc-f in CKD, evoking the participation of traditional vascular risk factors, which are more frequent in CKD, and risk factors characteristic of CKD.3,4,17 However, few publications, have analyzed the Vpc-f in CKD after adjustment for factors that can modify it. It is especially important to consider BP, since the relationship between BP and arterial stiffness is exponential. As BP increases, the load supported by the vascular wall is transferred from the elastic fibers to the stiffer collagen fibers.18 In our work we investigated the value of Vpc-f adjusted for BP, age, sex and heart rate (iVpc-f).
It has been described a significant negative association between renal function and aortic stiffness.19 In our work there was no such correlation and, in addition, we observed an unexpected GFR value, quantitatively unimportant, but significantly higher in the group with Vpc-f > 12 m/s. It is possible that these findings are attributable to the narrow range of GFR of the population studied and to the effect of DM in which hyperfiltration may obscure the association between FG and arterial stiffness. In fact, the difference in GFR between the two groups classified according to Vpc-f disappeared when the presence of DM was considered.
Arterial wall stiffness is determined by several mechanisms that affect the intimal, medial and adventitial layers of the vascular wall and include endothelial dysfunction, a decrease in the elastin/collagen ratio, reactive oxygen species-induced inflammation, vascular smooth muscle cell stiffness and calcification. There are phenotypic changes of vascular smooth muscle cells (VSMCs) related to mechanotransduction (interaction between extracellular matrix and VSMCs), oxidative stress and metabolic and epigenetic factors.20 There is a multicellular interaction, mediated by various molecules, of endothelial cells, inflammatory cells, fibroblasts, pericytes and progenitor cells with VSMCs. All these mechanisms participate in the increased aortic stiffness that accompanies normal arterial aging and the vascular aging that occurs early in CKD and DM.3,18 As expected and as we also show in our study, the increase in arterial stiffness is greater when both conditions coexist.21 In fact, although we found a significant correlation between iVpc-f and other vascular risk factors and markers, only DM, albuminuria and CAA show an independent association with iVpc-f.
Potential mechanisms for increased aortic stiffness in DM include the accumulation of advanced glycation products in vascular wall collagen making it resistant to enzymatic degradation22 and the alterations in nitric oxide (NO) synthesis, superoxide production and endothelial dysfunction observed in insulin resistance.23
In our study the association of DM and iVpc-f was attenuated when AAC iKauppila was introduced into the model. It is possible that the independent effect of DM on aortic stiffness is obscured to some extent by the known association of DM with CV,24 calcification involving inflammatory mechanisms, and alterations in the concentration of calcification promoter and inhibitor proteins that are of greater intensity when DM and CKD coexist.25,26
The association between albuminuria and the magnitude of aortic stiffness has been previously described.10,27 A stiff aorta prevents attenuation of arterial pulsatility allowing its transmission to organs of low resistance such as the kidney, promoting albuminuria. The presence of albuminuria in the high-normal range has been described as an early marker of increased aortic stiffness.27
The presence of VCs are frequent in multiple territories in CKD, their prevalence increases with the stage of CKD. In our study, the prevalence of AAC detected by radiology in subjects with stage 3–4 CKD was 77%. This prevalence is similar to that found in other works using computed tomography such as that of Sørensen et al. (77.3% in stage 3 and 82.3% in stage 4)6 and in the IMPROVE-CKD study (81% in stages 3b and 4).28
The only previous publication on the association between arterial calcifications and aortic stiffness that included subjects with stage 3–4 CKD29 found that as observed in our study the intensity of AAC was independently associated with aortic stiffness. It has been shown in experimental animals that degradation of the elastic fibers of the arterial wall (as observed in aging, HTN, DM and CKD) facilitates calcium deposits in the tunica media.30 In turn, calcification of the tunica media induces additional destruction of elastin31 causing further stiffness of the arteries.
Our study shows that in addition to DM and iVpc-f, smoking was also independently associated with iKauppila values. Smoking generates vascular structural and functional damage. It causes endothelial damage, increased superoxide production and decreased availability of NO, among others.32 In both active smokers and ex-smokers, it is observed an increase in the rates of atherosclerosis.33 In a population-based study in which Vpc-f was associated with thoracoabdominal aortic calcification, the degree of the latter was positively linked to age, BP, DM and degree of smoking.34 In addition to its effects on atherogenesis, smoking may promote VC by other mechanisms. Smoking was one of the independent determinants of reduced fetuin-A values in subjects with renal transplantation and VC.35 In addition, in vitro studies have shown that nicotine induces VSMC calcification by promoting the expression of osteogenic genes (Runt-related transcription factor 2 (Runx2), osterix (Osx), osteopontin (OPN)) an effect that is due to increased Nox5 (nicotinamide dinucleotide phosphate oxidase) activity.36
The close relationship between AAC and aortic stiffness is reinforced by the finding in our study of a reciprocal relationship between them. The amount of AAC was linked to increased aortic stiffness and, in turn, the magnitude of aortic stiffness adjusted for age, BP, and gender was independently associated with the degree of AAC and was the only predictor variable for the presence of AAC. In fact, on the ROC curve the iVpc-f (≥10,15 m/s) had a high positive predictive value. Two studies that included subjects with CKD at various stages29 and patients with CKD on hemodialysis37 have also proven an independent association between Vpc-f and AAC.
In our study, 87% of patients presented some degree of CC. A recent meta analysis reported a prevalence of CC in CKD predialysis and dialysis patients of 60% (24–90%).38 In two other publications that, like ours, included patients with stage 3–4 CKD, the prevalence of CC was 60–68% (74% in the subgroup with DM).39,40 In these studies the age of patients was lower than in our patients and in one of the studies subjects with coronary artery disease were excluded. These two facts may explain the lower prevalence of CC in these studies.
In autopsy studies in subjects with CKD and coronary artery disease, compared to subjects without CKD, there is a predominance of intimal calcification in the coronary arteries. In renal patients there is a higher percentage with calcification of the intima, which is also of greater intensity. In CKD, stages 4 and 5, only 18% of subjects had calcification of the media of the coronary arteries in segments with and without calcification of the intima.41 However, in other vascular territories such as the aorta, it has been shown that in early stages of CKD, compared to subjects without CKD, there is calcification of the media (which is associated with increased aortic stiffness) and in more advanced stages, there is an additional increase of thickness and calcification of the intima.42
Calcification of the intima is an entity distinct from calcification of the media but, nevertheless, it shares pathogenic mechanisms. Intima calcification is a phenomenon secondary to inflammation associated with atherosclerosis. Microcalcification of the atheroma plaque occurs following the release of matrix vesicles, apoptotic bodies, and necrotic debris derived from macrophages and VSMCs, which serve as a nucleus for calcification. In contrast to calcification of the media layer, in the intima calcification the osteochondrogenic transformation of VSMCs is a secondary phenomenon to the primary inflammatory process occurring in the atheroma plaque.43
Although it has been shown that in CKD the distribution of calcification in the intima versus the media is not the same in the different vascular territories (e.g, in coronary arteries and elastic arteries the calcification of atherosclerotic plaques of the intima is more prominent than in the muscular arteries of the upper extremity in which calcification of the media predominates with relative resistance to atherosclerosis), in CKD the coexistence of calcifications of the intima and media in the same or different vascular territories is common. This fact may be based on the existence of various types of cells, in addition to VSMC, which under different stimuli have the capacity for osteoblastic transformation (endothelial cells, pericytes, myofibroblasts, progenitor cells), cells that communicate with each other through exosomes and various molecular signals [(BMP (bone morphogenetic protein), OPG/RANK/RANKL (osteoprotegerin/nuclear factor kB receptor activator/ RANK ligand), Wnt/β catenin and AGE (advanced glycation products) systems], generating an effective CV development network.44
In our study, the magnitude of AAC (iKauppila) was the only variable independently associated with the intensity of CC (iAgatston) and, in addition, the presence of radiology-demonstrated AACs evidenced a high specificity for the presence of CC. It is possible that the calcifications observed in the abdominal aorta represent joint calcification of the media and intima (atherosclerosis and atherosclerosis) of the vascular wall with increased arterial stiffness and it is also associated coronary intima calcification (atherosclerosis). In one study performed in subjects with stage 3 CKD (eGFR 50 ml/ min/1.73 m2) and DM, the prevalence of AAC and CC (detected by CT) was higher than that observed in subjects with DM without CKD. Although the association between calcification of both vascular territories was not evaluated, it was concluded that both types could represent atherosclerosis.45 In another publication that included subjects with stage 3–4 CKD, the degree of CAA detected by CT was independently associated with an iAgatston greater than 400 UH, and the C statistic for predicting the presence of severe CHD increased significantly when the abdominal aortic calcification index was added to other traditional vascular risk factors.46
In the present study, the iVpc-f predicted the presence of CC. To our knowledge, only 3 studies have evaluated the relationship between aortic stiffness and CC in subjects with CKD. In two of them, performed in hemodialysis patients, a direct correlation was observed between Vpc-f and CC,37,47 whereas in another study which also included subjects with less advanced stages of CKD, the association between Vpc-f and CC disappeared when age, MAP, DM and AAC, which were associated with Vpc-f,29 were incorporated in the multivariate analysis. The iVpc-f used in our study incorporated age, sex and MAP and predicted the presence of CC, and the ROC curve showed that an iVpc-f value equal to or greater than 10.12 m/s provided acceptable values for discriminating the presence of CC. It is possible that this association is attributable to the repercussions of increased aortic stiffness and secondary hemodynamic alterations (increased pulsatility, among others) on the coronary circulation. Clinical and experimental evidence demonstrates an important role of biomechanical forces in the genesis of coronary atherosclerosis.48,49
In advanced CKD patients it has been demonstrated that an elevated value of dephosphorylated and non-carboxylated matrix Gla protein (dp-ucMGP) (i.e., without capacity to inhibit calcification) is an independent predictor of increased VC and correlates with the intensity of CC and the degree of calcification of the media in other arteries.50 In addition, in CKD patients, elevated values of dp-ucMPG51 and calciprotein particles containing phosphorylated fetuin A, the expression of a procalcifying medium,52 are associated with icreased aortic stiffness. In subjects with CKD stage 3–4, an increase in calcification propensity quantified as the transformation time from primary calciprotein particles to secondary calciprotein particles was independently associated with baseline Vpc-f and with its progressive increase during 30 months.53 All these data, together with our findings, make it plausible that a parameter of arterial function such as aortic stiffness associated with a biomarker of vascular calcification allows early identification of VC in patients with CKD.
Our study has limitations. It is a cross-sectional study, so we are not able to determine whether aortic stiffness progresses in parallel with VC; likewise we can not assess the prognostic impact of this marker of arterial function on cardiovascular and renal events. However we can affirm that in CKD stage 3–4, the greater the degree of vascular calcification, the greater the aortic stiffness. Another limitation is that the determination of CC was performed in a smaller number of patients than that of aortic calcification and the latter was assessed by radiographic methods. Despite this limitation, our results are statistically consistent. Furthermore, there are observational studies demonstrating that VC assessed by radiology method is a valid parameter for prognosis of cardiovascular events that is more reliable than many of the traditional risk factors, and that there is a significant correlation between iKauppila and AAC detected by CT.54,55
The strengths of our study are the inclusion of patients with similar renal function (CKD stages 3 and 4), the analysis of the relationship between aortic stiffness (adjusted for age, sex and blood pressure) and AAC and CC using the technique considered gold standard for the determination of aortic stiffness, and the short time interval between the determination of Vpc-f and the evaluation of VC.
In summary, in patients with CKD stage 3 and 4 there is an increase in aortic stiffness measured by iVpc-f when DM is added to CKD, and it frequently coexist with a high prevalence of AAC and CC. This increased aortic stiffness is independently associated with VC in both the abdominal aorta and coronary arteries and it may be a useful marker of the presence of VC.
The Spanish Society of Nephrology, in the document updating and adapting the KDIGO (Kidney Disease Initiative Global Outcomes) guidelines on alterations in bone-mineral metabolism in CKD, recommends for the detection of VC in stage 3–4 CKD the performance of a lateral radiograph of the lumbar spine at baseline and every 2–3 years during the follow-up.56 Given the association demonstrated in the present study between aortic stiffness and CAA and CC, it seems reasonable to propose the inclusion of Vpc-f as an additional method for the study of VC. It would be interesting in future prospective studies to analyze whether the evaluation of aortic stiffness associated with a circulating biomarker of vascular calcification, with or without imaging markers, allows the diagnosis (or an earlier diagnosis) of CV in CKD.
Ethical considerationsAll patients gave informed consent for the execution of the present study, which met all the ethical criteria of the institution where it was performed.
FinancingThere has not been any type of financing from any institution.
Conflict of interestNone.


