


Preeclampsia (PE) is a hypertensive disorder of pregnancy associated with high maternal and fetal morbidity and mortality and increased future risk of cardiovascular complications.
ObjectiveTo analyze whether women who have had PE with severe features in their pregnancy have higher arterial stiffness (AS) parameters than those whose PE course was without signs of severity.
MethodsSixty-five women who developed PE during their gestation were evaluated, divided into two groups: PE group without severe features or non-severe PE (n=30) and PE group with severe features or severe PE (n=35). Carotid-femoral pulse wave velocity (cfPWV), central augmentation index corrected to a heart rate of 75 beats per minute (AIxc75) and central augmentation pressure (cAP) were determined one month and six months postpartum. Comparison of proportions was carried out using the chi-square test, comparison of means between groups using the Student’s t-test or the Mann–Whitney test, and comparison of means of the same group at different evolutionary moments, using the t-test or the Wilcoxon test. Correlation, with and between hemodynamic parameters, was carried out with Spearman’s correlation coefficient and the association between demographic variables, personal history and hemodynamic parameters, and altered arterial stiffness parameters was carried out using linear and logistic regression models.
ResultsWomen with severe PE presented, both at 1 and 6 months postpartum, higher values of blood pressure, both central and peripheral, as well as AR and pulse amplification parameters, than those women whose PE was not severe. Central augmentation index (cAIx) values at 1 month and 6 months postpartum were higher, although not significantly, in the severe PE group compared to the non-severe PE group (24.0 (16.5–34.3) vs. 19.0% (14–29) and 24.0 (14.0–30.0) vs. 20.0% (12.3–26.8), respectively). Carotid-femoral pulse wave velocity (cfPWV) was significantly higher at both 1 and 6 months postpartum in the severe PE group compared to the non-severe PE group (10.2 (8.8−10.7) vs. 8.8m/s (8.3−9.6) and 10.0 (8.8−10.6) vs. 8.8m/s (8.3−9.3), respectively). Central systolic pressure and central pulse pressure amplification were also higher, although not significantly, in the severe PE group in comparison with the non-severe PE group.
ConclusionsWomen who have had severe PE have more pronounced arterial stiffness parameters than those in whom PE was not particularly severe. The determination of cAIx and cfPWV, as a strategy for the assessment of cardiovascular risk, should be evaluated among women who have had PE.
La preeclampsia (PE) es un trastorno hipertensivo del embarazo asociado a una elevada morbimortalidad materna y fetal, y un mayor riesgo futuro de complicaciones cardiovasculares.
ObjetivoAnalizar si las mujeres que han tenido PE grave en su embarazo presentan parámetros de rigidez arterial (RA) superiores a las de aquellas cuya PE cursó sin signos de gravedad.
MétodosSe evaluaron 65 mujeres que habían desarrollado PE durante su gestación, divididas en 2 grupos: grupo de PE sin criterios de gravedad o PE no grave (n=30) y grupo de PE con criterios de gravedad o PE grave (n=35). Se determinó la velocidad de onda de pulso carótida-femoral (VOPcf), el índice de aumento central normalizado a 75 latidos por minuto (IAc75) y presión de aumento central (PAc) al mes y a los 6 meses posparto. La comparación de proporciones se llevó a cabo mediante la prueba de Chi-cuadrado, la comparación de medias entre grupos se utilizaron la prueba t de Student o la prueba de Mann-Whitney, y la comparación de medias de un mismo grupo en momentos evolutivos diferentes, la prueba t para o el test de Wilcoxon. La correlación, con y entre parámetros hemodinámicos, se llevó a cabo con el coeficiente de correlación de Spearman y la asociación entre variables demográficas, antecedentes personales y parámetros hemodinámicos, y valores alterados de RA se llevó a cabo mediante modelos de regresión lineal y logística.
ResultadosLas mujeres con PE grave presentaban, al mes y a los 6 meses posparto, valores de presión arterial, tanto central como periférica, así como parámetros de RA y amplificación de pulso, superiores a aquellas mujeres cuya PE no revistió gravedad. Los valores del índice de aumento central (IAc) al mes y a los 6 meses posparto fueron superiores, aunque no de forma significativa, en el grupo de PE grave respecto al grupo de PE no grave (24,0 [16,5–34,3] vs. 19,0% [14–29] y 24,0 [14,0–30,0] vs. 20,0% [12,3–26,8], respectivamente). La velocidad onda de pulso carótida-femoral (VOPcf) fue superior de forma significativa, tanto al mes como a los 6 meses posparto en el grupo de PE grave respecto al grupo de PE no grave (10,2 [8,8–10,7] vs. 8,8m/s [8,3–9,6] y 10,0 [8,8–10,6] vs. 8,8m/s [8,3–9,3], respectivamente). La amplificación de la presión sistólica central y de la presión de pulso central fueron también superiores, aunque no de forma significativa, en el grupo de PE grave respecto al de PE no grave.
ConclusiónLas mujeres que han tenido PE grave presentan parámetros de RA más acusados que los de aquellas en las que la PE no revistió especial gravedad. Debiera evaluarse la conveniencia de incluir de forma rutinaria entre las mujeres que han tenido PE la determinación del IAc y especialmente la VOPcf, como estrategia de evaluación del riesgo cardiovascular.
Preeclampsia (PE) is a hypertensive disorder of pregnancy associated with high maternal and fetal morbidity and mortality. It has a multifactorial etiology, placental factors associated with decreased placental perfusion, maternal clinical risk factors such as hypertension (HTN), age, obesity, diabetes mellitus (DM) or thrombophilia.1,2 The link between relative placental hypoxia and the clinical syndrome includes a cascade of secondary mechanisms including an imbalance between pro-angiogenic and anti-angiogenic factors, maternal oxidative stress and endothelial and immune dysfunction, which would be responsible for generalized endothelial dysfunction leading to arterial stiffness (AS), and whose development is associated with cardiovascular (CV) damage.3
In recent years, new non-invasive techniques have been developed to assess endothelial function in peripheral vessels, including pulse wave velocity (PWV) as a marker of AS and clinical assessment of endothelial function.4
AS is an independent predictor of morbidity and mortality, and its increase, mainly associated with age, gender, and blood pressure (BP), is associated with the development of cardiovascular disease (CVD) and all-cause mortality, regardless of the presence of other cardiovascular risk factors (CVR).5 Therefore, early detection of BP can play an important role in the prevention of this type of disease.
The BP is conventionally measured over the brachial artery, and constitutes the reference standard for the diagnosis and management of hypertension. Its parameters are powerful predictors of CV structural damage, morbidity and mortality. However, the phenomena of amplification and reflection of the pulse wave that occur along the arterial tree, determine that the central BP (cAP), more representative of the load exerted on major organs such as the heart, brain and kidneys, differs substantially from the peripheral arterial pressure (pAP)6 and, although current European guidelines for the management of HTN question the prognostic value of cAP measurement in clinical practice,7 several studies point to the relevance and superiority of cAP over pAP in risk assessment, prediction of target organ damage, adverse CV events, and mortality.8–11 On the other hand, it has been suggested that the assessment of cAP can improve therapeutic decisions since certain antihypertensive drugs can have substantially different effects on cAP despite having similar effects on pAP.6
Several hemodynamic parameters are associated with AS. Among them, the most studied are the augmentation index (AI) and PWV. The value of AI depends on AS and it is influenced by wave reflections along the arterial tree, and although it is technically easier to measure than PWV and is related to CVR factors, coronary artery disease and death due to CVD,12 its dependence on age13 and the possibility of being affected by certain antihypertensive treatments,6 means that it is considered an indirect marker of AS, not interchangeable with PWV.14 The measurement of PWV is a noninvasive, innocuous, short-duration procedure and simple to perform in health care practice. Given its reliability and the large amount of evidence demonstrating its association with CVD, regardless of existing risk factors, carotid-femoral PWV (cfPWV) is the gold standard for the quantification of AS, and it is considered one of the markers of organ damage with the highest predictive CV value, greater reproducibility and acceptable cost-effectiveness ratio.7,15
Normal values of pAP are well defined7 and, although there are studies that propose normal values and reference ranges for various parameters of cAP, AS and pulse wave amplification,13,16–20 the heterogeneity of the populations analyzed and the absence of a standardized methodology for their evaluation generally make it difficult to implement their use in clinical practice.
Our objective is to analyze whether women who have had severe PE during pregnancy have higher AS parameters than those whose PE had no signs of severity.
Material and methodsStudy populationThis is a prospective study carried out on 65 consecutive women with development of PE during pregnancy that were referred from the Gynecology and Obstetrics Department Gravidic Pathology Unit to the Nephrology Department of the Marqués de Valdecilla University Hospital between 01/01/2021 and 30/06/2021.
According to the severity of PE, the cohort was divided into 2 groups, PE group without severity criteria or “non-severe PE” (n=30) and PE group with presence of with criteria of severity or “severe PE” (n=35). The diagnosis and classification of PE according to severity was established according to The American College of Obstetricians and Gynecologists (ACOG) criteria.21 Early-onset PE was defined as a diagnosis of PE before 34 weeks of gestation.22 Demographic parameters, CVR factors, obstetric history and gestational data were collected by personal interview with the patient that was cross-checked with her medical history. The study was conducted following the rules of the Declaration of Helsinki and approved by the Clinical Research Ethics Committee of our institution (reference number: 2018.170). All participants gave their informed consent.
Analytical determinationsSerum creatinine and proteinuria values at the time of PE diagnosis were collected from the patient’s clinical history.
Hemodynamic determinationsPeripheral and central hemodynamic parameters were determined by the same trained observer, noninvasively, using an automated SphygmoCor® XCEL device (AtCor Medical Pty. Ltd., Sydney Australia). Peripheral systolic blood pressure (SBPp) and peripheral diastolic blood pressure (DBPp), were recorded using an appropriately sized brachial cuff, placed on the dominant arm, with the patient seated and with the back and arm resting on a rigid surface after a rest period of at least 5min. Three measurements were made, the first one was discarded and the last 2 averaged. Peripheral pulse pressure (PPp) was defined as (pPP=pSBP−pDBP). For the determination of peripheral mean arterial pressure (pMBP), the following approximation was applied23: pMBP=pDBP+0.4×pPP.
The SphygmoCor® XCEL system derives the central aortic pressure waveform from the pulses recorded by the cuff placed on the brachial artery, using a generalized transfer function integrated into the device software (version 1.3). The aortic waveform analysis provides key parameters including central systolic arterial pressure (cSBP), central diastolic arterial pressure (cDBP) and central pulse pressure (cPP), calculated as cPP=cSBP−cDBP, central mean arterial pressure (c MBP), and AS indices such as central augmentation pressure (AG), defined as the difference between the second and first systolic peak, and central augmentation index (AIx), defined as cAP expressed as a percentage of PPc, as well as its value standardized to a standard heart rate (HR) of 75 beats per minute (IAc75). Three measurements were made, the first one being discarded and the last 2 valid determinations of the central hemodynamic parameters were averaged. Systolic arterial pressure amplification (aSBP), was expressed as the difference of pSBP and cSBP (aSBP=pSBP−cSBP) and pulse pressure amplification (aPP), was quantified in 3 ways: (a) as the difference between pPP and cPP (aPP=pPP−cPP), (b) as percentage increase between pPP and cPP (aPP=[pPP−cPP]/cPP×100) and (c) by the ratio of pPP and cPP (aPP=pPP/cPP).24
Determination of PWVcf was performed from carotid and femoral arterial pulses measured noninvasively. Carotid pulse waves were measured by applanation tonometry and femoral pulse waves were obtained simultaneously using a partially inflated cuff over the femoral artery in the leg midway between the hip and knee. The PWVcf was determined by calculating the ratio of the corrected distance between pulse measurement sites to the time delay between carotid and femoral pulse waves. The subtraction method was used to calculate the distance, whereby the path length was calculated by subtracting from the distance between the suprasternal notch and the top of the thigh cuff, the distance between the suprasternal notch and the carotid site and the distance from the femoral artery at the inguinal ligament to the proximal edge of the thigh cuff. Two valid measurements of PWVcf were averaged.
Abnormal PWVcf values were considered to be those that exceeded the median value, for the corresponding age group, assigned to the reference population by “The Reference Values for Arterial Stiffness Collaboration”.16 Abnormal values of SBPc and aPSc were considered to be those that exceeded the median value for the corresponding age group assigned to the reference population in the study by Herbert et al.17
Statistical analysisContinuous variables are presented as mean and standard deviation (SD) or median and interquartile range (IQR). Comparison of proportions was performed using the Chi-square test. Comparison of means between different groups was performed using Student’s t-test for independent samples or the Mann–Whitney test, and the t-test for related samples or the Wilcoxon test in the case of comparison of means of the same group at different evolutionary moments. Correlation with and between hemodynamic parameters was carried out using Spearman’s correlation coefficient. Linear and logistic regression models were used to evaluate the association between known CVR factors and the main AS parameters. In all hypothesis contrasts, the null hypothesis was rejected with a type I error or α error <0.05. Analyses were performed with SPSS software® version 22 (SPSS, Chicago, IL, USA).
ResultsBaseline dataWe evaluated 30 women with non-severe PE and 35 women with severe PE, whose baseline data are shown in Table 1. There were no significant differences in age, CV risk factors or obstetric history between the two groups. As compared with PE without severity criteria, Women with severe PE had their delivery earlier (35.7±4.1 weeks in severe PE vs., 38.1±2.3 weeks in non-severe PE; p=0.006) and used cesarean section more often as a form of gestational termination (51.4% in severe PE vs. 26.7% in PE without severity criteria; p=0.042). In relation to the time of the initiation of PE, early PE was observed in 22.9% of severe PE cases and in 13.3% of non-severe PE cases. Twenty percent of severe PE cases did not have proteinuria. Newborns from mothers with severe PE had a lower birth weight than those from mothers with non-severe PE, although the differences did not reach statistical significance.
General description of the population.
| Non-severe PE (n=30) | Severe PE (n=35) | p Value | |
|---|---|---|---|
| Age | 33.6±6.5 | 35.0±6.1 | 0.393 |
| Age range. n (%) | |||
| <30 years | 6 (20.0) | 6 (17.1) | 0.459 |
| From 30 to 39 years old | 20 (66.7) | 22 (62.9) | 0.705 |
| >39 years | 4 (13.3) | 7 (20.0) | 0.248 |
| Cardiovascular risk factors. n (%) | |||
| Pre-pregnancy hypertension | – | – | – |
| DM | 2 (6.7) | 2 (5.7) | 0.873 |
| Dislipemia | – | – | – |
| Smoking | 1 (3.3) | – | – |
| Persistence HTA 6 month postpartum. | – | 2 (5.7) | – |
| Obstetric history. n (%) | |||
| Number of previous pregnancies | 0.313 | ||
| None | 20 (66.7) | 18 (51.4) | |
| One or more | 10 (33.3) | 17 (48.6) | |
| Pre-abortions | 3 (10.0) | 7 (20.0) | 0.319 |
| PE previous | 5 (16.7) | 4 (11.4) | 0.542 |
| Current gestational data | |||
| Multiple pregnancy. n (%) | 4 (13.3) | 2 (5.7) | 0.403 |
| Assisted reproductive techniques. n (%) | 8 (26.7) | 4 (11.4) | 0.208 |
| Cesarean delivery. n (%) | 8 (26.7) | 18 (51.4) | 0.042 |
| Weeks of labor. mean±DE | 38.1±2.3 | 35.7±4.1 | 0.006 |
| HELLP. n (%) | – | 6 (17.1%) | – |
| Eclampsia. n (%) | – | – | – |
| PE classification according to time of onset. n (%) | 0.324 | ||
| Early | 4 (13.3) | 8 (22.9) | |
| Late | 26 (86.7) | 27 (77.1) | |
| Maternal complications | |||
| Membrane rupture prematurely n (%) | 1 (3.3) | 1 (2.9) | 0.912 |
| Bleeding n (%) | 1 (3.3) | 3 (8.6) | 0.381 |
| Epigastralgia n (%) | – | 9 (25.7) | – |
| Headache n (%) | – | 15 (42.9) | – |
| Pulmonary edema n (%) | – | – | – |
| Visual alterations n (%) | – | 2 (5.7) | – |
| Analytical alterations n (%) | |||
| Proteinuria n (%) | 30 (100) | 28 (80.0) | 0.010 |
| Proteinuria (mg/24h). Me (RIC) | 851.5 (566.0–1.520.3) | 561.0 (359.3–799.0) | 0.018 |
| Kidney function impairment n (%) | – | 2 (5.7) | – |
| Creatinine (mg/dl). Me (RIC) | 0.69 (0.61–0.87) | 0.64 (0.56–0.78) | 0.426h |
| Thrombocytopenia n (%) | – | 6 (17.1) | – |
| Alteration liver function tests n (%) | – | 6 (17.1) | – |
| PAS≥160 and/or PAD≥110mmHg. n (%). | – | 25 (71.4) | – |
| BP at diagnosis (mmHg). mean±DE. | |||
| SBP | 150.9±7.5 | 165.9±20.4 | <0.001 |
| DBP | 91.3±7.5 | 98.1±12.4 | 0.010 |
| Newborn data | |||
| Birth weight (mg) mean±DE | 3.076.3±446.3 | 3.015.1±326.2 | 0.744 |
| IUGR n (%) | 1 (3.3) | 3 (8.6) | 0.381 |
BP, blood pressure; DBP, diastolic blood pressure; SBP, systolic blood pressure; IUGR, intrauterine growth retardation; PE, preeclampsia.
In the analysis of renal function at the time of PE diagnosis, the non-severe PE group had significantly higher proteinuria values than the severe PE group (851.5 [566.0−1520.3] vs. 561.0mg/24 [359.3−799.0]; p=0.018). Values of serum creatinine values were not significantly different in the two groups.
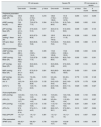
Vascular parametersTable 2 shows the vascular parameters obtained with the SphygmoCor® XCEL system at 1 and 6 months after delivery. The analysis of pAP and cAP did not show substantial differences within each group between the two evolutionary moments. However, the comparison between the two groups showed that women with severe PE compared to non-severe PE, had statistically significant higher values of SBP (up to 11mmHg at the peripheral level and 12mmHg at the central level), DBP (8mmHg at the peripheral level and 10mmHg at the central level) and MBP (9mmHg at the peripheral level and up to 12mmHg at the central level).
Vascular parameters as a function of preeclampsia severity.
| PE not severe | Severe PE | PE non-severe vs. severe | ||||||
|---|---|---|---|---|---|---|---|---|
| One month | 6 months | p Value | One month | 6 months | p Value | One month | 6 Months | |
| Peripheral parameters | ||||||||
| pSBP (mmHg), mean (IR) | 120.0 (110–127.3) | 120.0 (115.8–127.8) | 0,316 | 129,0 (116,0–136,0) | 131,0 (119,0–147,0) | 0,065 | 0,012 | 0,003 |
| pDBP (mmHg), me (IR) | 73.0 (68.0–80.5) | 73.0 (67.0–77.3) | 0.304 | 81.0 (75.0–86.0) | 81.0 (74.0–89.0) | 0.893 | 0.002 | 0.001 |
| pPP (mmHg). Mean (IR) | 45.0 (41.5–50.0) | 47.5 (44.0–51.3) | 0.017 | 46.0 (41.0–51.0) | 51.0 (45.0–56.0) | 0.009 | 0.425 | 0.104 |
| pMBP (mmHg)a. Mean (IR) | 91.2 (85.3–98.7) | 92.5 (87.3–96.8) | 0.991 | 100.0 (91.4–104.2) | 99.4 (91.6–111.6) | 0.326 | 0.003 | 0.000 |
| HR (lpm). Mean (IR) | 70.0 (65.0–75.0) | 68.0 (60.8–72.8) | 0.416 | 70.5 (64.0–76.3) | 70.0 (64.0–77.0) | 0.555 | 0.668 | 0.179 |
| Central parameters | ||||||||
| cSBP (mmHg), mean (IR) | 107.0 (98.5–114.0) | 108 (102.5–116.3) | 0.305 | 119.0 (109.5–125.8) | 119.0 (108.0–135.5) | 0.586 | 0.000 | 0.004 |
| cDBP (mmHg). Mean (IR) | 72.0 (68.0–79.0) | 73.5 (67.8–77.5) | 0.000 | 82.0 (76.0–88.0) | 82.5 (74.0–92.5) | 0.000 | 0.001 | 0.001 |
| cPP (mmHg). Mean (IR) | 32.0 (29.0–36.0) | 35.0 (32.0–39.0) | 0.118 | 35.5 (29.8–43.8) | 37.0 (32.5–43.3) | 0.587 | 0.104 | 0.435 |
| MBP (mmHg). Mean (IR) | 87.0 (81.5–94.5) | 87.5 (81.0–92.0) | 0.891 | 99.0 (89.5–102.3) | 96.0 (89.0–108.0) | 0.450 | 0.001 | 0.000 |
| cAP (mmHg). Mean (IR) | 6.0 (4.3–9.8) | 7.0 (3.8–9.0) | 0.310 | 9.0 (4.8–13.0) | 9.0 (6.0–11.0) | 0.776 | 0.109 | 0.126 |
| cAI. % | 19.0 (14–29) | 20.0 (12.3–26.8) | 0.135 | 24.0 (16.5–34.3) | 24.0 (14.0–30.0) | 0.379 | 0.178 | 0.228 |
| cAI75. % | 16.0 (11.5–27.5) | 14.0 (7.0–23.0) | 0.045 | 22.0 (16.8–30.8) | 23.0 (11.0–29.0) | 0.629 | 0.095 | 0.027 |
| Pulse amplification | ||||||||
| cSPa (mmHg) | 12.0 (9.0–14.0) | 13.0 (11.0–14.3) | 0.162 | 10.5 (8.0–12.3) | 13.0 (10.8–15.0) | 0.000 | 0.153 | 0.584 |
| cSPa (%) | 11.3 (8.4–13.7) | 11.5 (8.8–14.3) | 0.469 | 9.5 (6.4–10.9) | 11.2 (9.2–13.4) | 0.001 | 0.010 | 0.527 |
| cPPa (mmHg) | 11.0 (9.5–14.0) | 13.0 (11.0–15.0) | 0.155 | 11.0 (7.0–13.0) | 14.0 (10.8–16.3) | 0.001 | 0.364 | 0.351 |
| cPPa (%) | 37.9 (29.0–41.4) | 37.4 (31.1–44.3) | 0.381 | 28.9 (16.7–38.1) | 37.0 (29.1–45.2) | 0.013 | 0.057 | 0.824 |
| Ratio pPP/cPP | 1.4 (1.3–1.4) | 1.4 (1.3–1.4) | 0.381 | 1.3 (1.2–1.4) | 1.4 (1.3–1.5) | 0.013 | 0.057 | 0.824 |
| Other parameters | ||||||||
| cfPWV (m/s) | 8.8 (8.3–9.6) | 8.8 (8.3–9.3) | 0.738 | 10.2 (8.8–10.7) | 10 (8.8–10.6) | 0.575 | 0.003 | 0.006 |
pSBP: peripheral systolic arterial pressure; pDBP: peripheral diastolic arterial pressure; pPP: peripheral pulse pressure; pMBPa: peripheral mean arterial pressure; HR: heart rate; cSBP: central systolic arterial pressure; cDBP: central diastolic arterial pressure; cPP: central pulse pressure; cMBP: central mean arterial pressure; cAP : central augmentation pressure; cAI: central augmentation index; cAI75: central augmentation index normalized to 75lpm; cSPa: central systolic pressure amplification; cPPa: central pulse pressure amplification; cfPWV: carotid-femoral pulse wave velocity.
Among the main central AS parameters (cAP, and cAI), no significant differences were observed in intragroup comparisons. However, the comparison between both groups reflected that women with severe PE had higher values of cAP (up to 3mmHg) and cAI (5% and 9% in IAc75), than women with non-severe PE, although the differences did not reach statistical significance. Regarding pulse wave amplification, in women with non-severe PE, no differences were observed, between the two evolutionary periods, in both acSP and acPP, whereas in severe PE there were significant increases, between month 1 and month 6 postpartum, of the order of 2mmHg in acSBP (10.5 [8.0−12.3] vs. 13.0mmHg [10.8−15.0]); p<0.001 (approximately 1.7%) and of 3mmHg in acPP 11.0 (7.0−13.0) vs. 14.0mmHg (10.8−16.3); p=0.001 (approximately 8%). The comparison between the two groups showed that, neither acSBP nor acPP were significant different at any of the time points analyzed.
Regarding cfPWV, the intra-group comparison did not show significant variations between the two evolutionary moments. However, the comparison cfPWV between the two groups did reflect significant differences, both at one month postpartum, 8.8 (8.3−9.6) in the non-severe PE group vs. 10.2m/s (8.8−10.7) in the severe PE group, p=0.003, and at 6 months postpartum 8.8 (8.3−9.3)m/s in the non-severe PE group vs. 10.0 (8.8−10.6)m/s in the severe PE group; p=0.006.
Fig. 1 shows the comparisons between the non-severe PE and severe PE groups for the main parameters analyzed by age range (<30, and ≥40 years).
Modification of arterial stiffness parametersChange of cfPWV
One month postpartum, 90 and 94.3% of women of the non-severe PE and severe PE groups, respectively, had altered cfPWV values, and in a total of 19 women (3 in the non-severe PE group and 15 in the severe PE group), cfPWV was greater than 10m/s. At 6 months postpartum, 100% of women in both groups had altered cfPWV values, and 1 woman in the non-severe PE group and 10 in the severe PE group had a cfPWV ≥10m/s.
Changes cSBPOne month postpartum, 34.5% of the women from non-severe PE group and 70.6% in the severe PE group had altered SBP values. Six months after delivery, the alteration was observed in 50 and 73.5% of women, respectively.
Alteration of pulse amplificationIn the non-severe PE group, 79.3% and 86.7% of the women had median acSBP values higher than those established for their reference age group at 1 and 6 months postpartum, respectively. In the severe PE group, the alteration was observed in 76.5% and 91.2%, respectively.
Correlation and associationCorrelation analysis of the main AS parameters reflected that, in the non-severe PE group, cfPWV correlated 1 month postpartum with pSBP (rho=0.462) and at 6 months postpartum it correlated with age and with pSBP (rho=0.416 and 0.603), respectively. In the severe PE group, one month postpartum it correlated with pSBP (rho=0.308) and at 6 months postpartum with age and cAI (rho=0.607 and 0.448), respectively.
In addition, in the non-severe PE group, 1 month postpartum cAI correlated with cfPW, cPP and with cAP (rho=0.443, 0.591 and 0,973 respectively), and at 6 months postpartum with age, pSBP, cfPWV and with cAP (rho=0.423, 0.464, 0.448 and 0.965, respectively). In the severe PE group, one month postpartum cAI correlated with age, pSBP, cPP and cAP (rho=0.448, 0.473, 0.668 and 0.955 respectively), and at 6 months postpartum with age, cfPWV, cPP and cAP (rho=0.351, 0.550, 0.578 and 0.928 respectively).
In linear regression models, we found no association between AS parameters with height, body mass index (BMI), or the prevalence of CV risk factors such as dyslipidemia, smoking, obesity, and DM. In the logistic regression models, we also found no association between these factors and altered values of the main AS parameters.
DiscussionThe main finding of the present study was that women with severe PE have higher values, both at 1 and 6 months postpartum, of cAP and pAP, as well as AS and pulse amplification parameters, than women with non-severe PE.
In preeclamptic women, even after normalization of BP after delivery, it has been observed persistence, even up to several years, of altered AS indices,25–28 which may provide a potential explanation for the increased CV risk in these women.29–32 However, studies assessing endothelial dysfunction and AS several years after preeclamptic pregnancy have been inconclusive.33–35 To our knowledge, this is the first study to consistently analyze AS and pulse wave amplification as a function of PE severity. Previous studies such as the published by Khalil et al.31 observed that both cAP and cAI75, were significantly higher in severe PE than in non-severe PE (p<0.001). However, pulse wave analysis to assess AS was performed 24/48h prior to initiation of antihypertensive therapy, so they were unable to ascertain whether AS returned to normal after delivery and, if so, how long did it take. In another study, Avni et al.,36 found that women who developed severe PE had higher AS parameters (cAP, cAI and cAI75) than those with non-severe PE. However, the severe PE group only included 5 women, and the determination of central vascular and AS parameters were obtained throughout the pregnancy without establishing temporal uniformity in the time of their determination. In our study, we have analyzed the evolution of AS parameters uniformly at 1 and 6 month after delivery, and it was observed that women with severe PE have more marked sustained AS parameters and pulse wave amplification than those with non-severe PE.
A close association between age and BP with AS has been found. However, the association with other CV risk factors, other than BP, such as dyslipidemia, smoking, obesity, sex, HR, and DM is inconsistent.37–41 In absolute terms, the cAP represents the increase in aortic pressure caused by the reflection of the pulse wave through the arterial tree, and a linear increase in this parameter with age has been reported. Likewise, there is a close association between age and cAI, more marked in young individuals (younger than 50 years), and cfPWV, more sensitive in those older than 50 years, which, indicates that these 2 parameters are not interchangeable when determining AS, furthermore it suggests that cAI could be a more sensitive marker of arterial aging in younger individuals and PWV more sensitive in those older than 50 years.13 In our study, we only observed a consistent significant correlation in both evolutionary periods between age and cAI in the severe PE group, but not with cAP or cfPWV, a circumstance that we justify by the homogeneity of the population analyzed and the low variability in the age of the patients. As for the other CV risk factors, in our study we did not observe significant differences between the two groups of women in height, BMI, or prevalence of factors such as dyslipidemia, smoking, obesity, sex, HR and DM, nor did we find a linear correlation or association between these variables and the main AS parameters (cAP, cAI and cfPWV). Similarly, studies such as that of Wilkinson et al.,42 point to an inverse linear relationship between heart rate and cAI and a positive correlation with the pPP/cPP ratio, however these correlations were not observed in our study. Also, higher rates AS have been reported in early-onset PE patients than in late-onset.31,43 However, we, as in the systematic review by Kirollos et al.,28 did not found significant differences depending on the time of onset of PE.
Pulse amplification is determined by reflection phenomena and shows great variability between different subjects and even within the same subject in the presence of certain pathophysiological changes, and with the administration of drugs that affect HR.44,45 A study by McEniery et al.46 found that, in addition to age, HR, sex and height, all CV risk factors and the presence of CV disease were independently associated with the pPP/cPP ratio and the difference pSP–cSP. In our work we found no association between these pulse amplification parameters with age, height, HR, or other CV risk factors, probably because while the aforementioned study analyzed a population with age range from ≤20 years to ≥80 years, most of them without CV risk factors, or at most with only one risk factor; by contrast the women in our study had low age variability and a low prevalence of additional CV risk factors. The specific causes of these differences in AS according to the severity of PE are not clear to us, although it is very likely that its etiology, as in PE, is multifactorial. It is possible that immunological factors play an important role in the greater stiffness observed in these patients diagnosed with severe PE, as we have observed in a previous study carried out by our team, in which we found that AS, assessed three months after delivery by analysis of cfPWV, was strongly related to the presence of IgM-antiphosphatidylserine/prothrombin antibodies, and was more intense among women with severe PE than in women whose PE was not severe.47
Although several studies have shown the superiority of cAP over pAP in the prediction of target organ damage and CV riks,6,11,48 in clinical practice, HTN and CV risk are diagnosed and stratified almost exclusively on the basis of brachial BP. In fact, patients who are ascribed a certain degree of CV risk, based on a diagnosis of HTN, according to brachial BP values, could have a different CV risk if cAP values, AS parameters and pulse wave amplification were taken into consideration.11 In our study, one month postpartum, 19 women (3 in the non-severe PE and 16 in the severe PE group), had a cfPWV greater than 10m/s and 6 months postpartum, 11 women (only one in the non-severe PE group), exceeded this threshold, which according to current criteria7 is considered a conservative estimate of significant alterations in aortic function in middle-aged patients.
The AS promotes internal remodeling of small arteries, which increases resistance, blood pressure and, in turn, central artery stiffness, thus creating an insidious feedback loop. On the other hand, several studies find that AS is not only a powerful predictor of CV risk, but also a marker associated with the development of chronic kidney disease. AS worsens as renal function declines, is associated with proteinuria, bone and mineral disorders, and predicts death and progression of CKD to end-stage CKD.49 Therefore, it is possible that new long-term therapeutic strategies should be considered for women who have had PE during pregnancy, especially if the pregnancy was severe, focused on the prevention or reduction of AS, combining non-pharmacological measures such as loss of body weight, reduction of salt intake and physical exercise, and if necessary, with antihypertensive pharmacological treatments and lipid-lowering and antidiabetic drugs.
The main strength of our study lies in its prospective nature and, to our knowledge, in being the first to analyze, in a consistent manner, at 1 and 6 months postpartum, AS and pulse wave amplification as a function of PE severity. The main weaknesses are the failure to extend the analysis of AS indices beyond 6 months postpartum, and the lack of information on other parameters associated with endothelial dysfunction, such as the overexpression of antiangiogenic factors like soluble factor tyrosine kinase 1fms-like (sFlt1) and soluble endoglin (sEng), or the low amount of proangiogenic factors such as placental growth factor (PlGF) and vascular endothelial growth factor (VEGF), in order to check whether the AS observed, especially in severe PE, is maintained or attenuates over time.
In conclusion, women who have had severe PE during pregnancy have more pronounced AS parameters than those in whom PE did not show signs of severity, which indicates a higher CV risk in these patients. Thus, we consider that women who have had PE during pregnancy, should be evaluated whether measurements of cAI and especially cfPWV, that are feasible, noninvasive and replicable methods, should be routinely included in the strategies of CV risk assessment of these women.
FinancingThis research has not received specific support from public sector agencies, commercial sector or non-profit entities.
Conflict of interestThe authors declare that they have no conflicts of interest.


