
INTRODUCTION
The concept of generic chronic kidney disease (CKD) has been the «big idea» in nephrology in the last decade. It stimulated a surge of investigation and publications. It was a timely response to the concerns of both nephrologists and public health physicians that the demand for renal replacement therapy (RRT) for end-stage renal disease (ESRD) was increasing inexorably, contributing disproportionately to the inflation of health care spending; 2% of the UK NHS budget is spent on dialysis and transplantation for 0.01% of the population. Insufficient attention appeared to have been paid to the reservoir of patients feeding this pool. The description of this group of patients was moreover untidy and included the terms pre-dialysis, chronic renal failure, chronic renal insufficiency, chronic renal impairment, pre-uraemia and even Bright’s disease before renal biopsy. Primary care physicians were largely uninformed about renal disease and naïve in their interpretation of serum creatinine measurements so they left the problem to the small number of specialists in renal units. Because renal disease is relatively silent in its early stages, diagnosis was often delayed and potential opportunities to prevent end-stage renal failure and treat its complications were lost. The Kidney Disease Outcomes Quality Initiative (KDOQI) produced its seminal work in 2002 describing a definition and a staging system (table 1) using a metric, estimated GFR (eGFR)1. This metric was first described in 19992, but used for several prior decades in another form, estimated creatinine clearance (eCcr)3. Both estimates relied on equations using serum creatinine concentrations.
This transformation was warmly welcomed and widely adopted. It promoted awareness, research and policy initiatives designed to contain the problem of CKD. All this was laudable but the «big idea» has passed a «tipping point» and needs to be re-evaluated and refined4. It has become a «brand» with slogans and references to frightening (but non-existent) epidemics and tsunamis, competing for prominence with many other health issues such as cancer, obesity, depression and diabetes all stridently demanding attention and funding because 1 in 10 or 1 in 5 or 1 in 3 of our citizens was or was destined to suffer from a condition which was avoidable or treatable. Nephrology opened its bidding at 1 in 10 and has raised it to 1 in 7 US citizens having CKD5,6. It has been exploited commercially and medicalised large numbers of older citizens who have nothing to fear from a reduced eGFR. It is now time to pause, examine the relevant facts beyond the «hype» and give nephrology and public health more precise and useful tools. It is a «given» that good system design should solve problems without creating new ones.
THE COMMON MISCONCEPTIONS
There is an epidemic of CKD
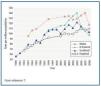
The number of patients on RRT is indeed rising but there are good reasons for this other than an increased incidence of pre-RRT CKD in the population. Indeed the annual incidence of new RRT patients is plateauing in the developed world, for example the United Kingdom (figure 1)7.
Demographics are changing
The proportion of older people is increasing. In 1971 16% of the British population was over 65 years old; in 2004 the proportion had increased to over 18%. As ESRD is largely a disease of old age, the ageing population brings with it an increase in the number of people with ESRD.
Access to RRT is improving
When RRT (specifically dialysis) was first introduced the selection criteria were strict and it was essentially «rationed». Over the past few decades previous «contraindications» to RRT (e.g. diabetes or older age) have been abolished in high-income countries and consequently more people are eligible for RRT. One consequence of this is an increase in the burden of co-morbidity in the RRT population8.
Outcomes for RRT patients are improving
There has been a steady improvement in the survival of patients in high-income countries on RRT9-11. This has been in excess of the improvement in life expectancy in the general population, although the reason for such improvement is undoubtedly multifactorial12. This increased survival increases the size of the prevalent RRT population.
Dialysis is being started earlier
In the UK the mean eGFR at start has increased from ~ 6 mL/min/1.73m2 to 8.5 mL/min/1.73m2 over the last ten years7. Increased availability of RRT and increasing comorbidity of the RRT population have both contributed to this trend, as has a desire to avoid uraemic complications.
The proportion of CKD patients who progress to treated ESRD is extremely small
In the UK the ratio of prevalent CKD:treated ESRD is 1:100 and to incident treated ESRD is 1:1,000. It is worth noting that the prevalence of CKD using the current definitions is similar in diverse populations but the incidence of treated ESRD is not. This implies that there are populations in whom the risk of progressing is much higher. The USA is a good example: the incidence of treated ESRD is 2-2.5 times that of most European countries which report a similar prevalence of «CKD». The problem of CKD as defined is therefore not primarily about ESRD. There has to be a better way of identifying subjects at risk of needing treatment for ESRD: trawling by eGFR is using too fine a net.
There is nevertheless no room for complacency. ESRD limits length and quality of life and its treatment is expensive so attempts to delay or prevent it should be made. There may well be a major problem in the future if the prevalence of diabetes continues to rise (in combination with the ageing population) and renal complications are not prevented, but this has not yet been observed.
The construct will reduce late referral of ESRD patients
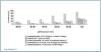
Late referral of patients to renal services for RRT is defined as contact less than 90 days before RRT is needed. These patients have worse outcomes13. They cannot consider and choose their modality, are usually started on haemodialysis via a central catheter, take longer to establish on treatment, spend longer in hospital and have more advanced complications of renal failure. They have a higher mortality than those referred earlier but are more often in high risk groups with much co-morbidity. The commonly quoted estimates are that around one quarter of new starters are «late referrals». Recently Udayaraj et al. audited this in Oxford14. It emerged that only 4% of new starters were avoidable late referrals (figure 2). The remainder had acute presentations of unpredictable disorders that cause irreversible renal failure or were migrants or refugees who were not in the NHS system previously. Moreover the true late referrals should have been identified from their abnormal serum creatinine and known diagnoses.
The construct identifies patients with treatable complications
Moranne et al. have surveyed the prevalence of complications of CKD15 (figure 3). It is apparent that complications (which are quite sensitively defined) are infrequent in the early stages of CKD and only become obvious when the GFR is <30 mL/min. Such patients are just as easily identified by their abnormal serum creatinine interpreted in context as by eGFR.
The CKD construct identifies a separate group of patients at risk of cardiovascular disease requiring treatment
The commonest cause of death in patients with CKD is cardiovascular disease and the risk of cardiovascular events in inversely proportional to the GFR such that a 20 mL/min/1.73m2 lower eGFR is associated with a 50% increased risk of a cardiovascular event (and a 40% increased risk of mortality)16 (a finding recently confirmed by a collaborative meta-analysis)17. Many traditional cardiovascular risk factors (e.g. blood pressure and LDL cholesterol) have a continuous association with risk even within the «normal» range. It would be surprising if a condition which increased blood pressure (and to a lesser extent produced dyslipidaemia) were not associated with an increased risk of cardiovascular disease18. However, because eGFR may be a risk marker does not make lower values a «disease»19.
Additionally, most patients with CKD will already have established cardiovascular risk factors (e.g. age, hypertension, diabetes) and therefore have an indication for appropriate preventative treatments (e.g. blood pressure- and lipid-lowering therapy), so the presence of CKD does not alter management. Furthermore, as high blood pressure is one of the major contributors to the progression of CKD, CKD is an indication for strict blood pressure control regardless of the cardiovascular risk association.
An additional complication is that patients with advanced CKD develop an atypical form of vascular disease, more akin to the heart failure population than the general population in which atherosclerotic disease dominates. There is considerable uncertainty about which treatments can effectively (and safely) reduce cardiovascular risk in these patients. The Study of Heart and Renal Protection (SHARP) will provide some clarity about the role of LDL cholesterol reduction when it reports in late 201020. Until then, the presence of CKD does not alter management due to the lack of therapeutic options. For CKD to be a useful concept, it requires more than an unsurprising association with cardiovascular disease.
THE FLAWS IN THE CONCEPT
CKD is not homogeneous
CKD is presented as an homogeneous syndrome of progressive renal injury and functional impairment causing an increase risk of premature death, adverse cardiovascular events, complications of kidney failure and end-stage renal failure all in proportion to the GFR. Curiously for a continuum, the stages are divided by «bins» of GFR: >90; 60-89; 30-59; 15-29 and <15. These subdivisions are arbitrary and are not predictive of consequences.
It ignores the context of the kidney functional impairment, mixing subjects with a kidney disease with those with chronic disease that impinges on kidney function. Thus the majority of those held to have CKD have no identifiable kidney disease. This distinction is important because those with primary kidney disease behave differently from those that have secondary kidney dysfunction. A patient with congestive heart failure with an eGFR of 25 mL/min/1.73m2 is in a different prognostic group from one with polycystic kidney disease and a similar eGFR.
This conflation of the two problems in the same schema explains why the prevalence of so-called CKD is so different from bona fide kidney disease. This has led El Nahas to propose the concept of C-K-D especially in the elderly as being «Cardio-Kidney-Damage» reflecting the interaction of atherosclerosis, cardiovascular disease, kidney damage and dysfunction21. To describe such patients as having chronic kidney disease is to put all the emphasis on one organ. It is no surprise that these patients die of their vascular disease and not of kidney failure for they are more likely to be diabetic, hypertensive, suffer heart failure and have had strokes and myocardial infarcts22.
The purpose of the system
It claims to stage kidney disease but it only divides GFRs into «bins». It is used clinically in individual patients and in populations as a risk stratification tool. Disease staging and risk stratification should be separated, have different end points and different purposes. For example23 a subject with an eGFR of 45 mL/min/1.73m2 is at double the risk of acute kidney injury after major surgery than one with a GFR of >60 mL/min/1.7 3m2. The absolute risk –though greater– is still very small. This is not a justification for labelling the subject at risk as having a disease19. The staging system is being used to predict risk of a wide variety of illnesses including pneumonia, hospitalisation and fractures and the relationship being used to justify the label «disease». Subjects with co-morbidity are at risk of adverse events and have lower eGFRs and therefore worse stages of CKD. These associations are therefore a result of «reverse causality» rather than CKD directly causing the poor outcome. In contrast, staging of a disease is about the prognosis of that disease and is usually ordinal and multi-dimensional and determines subsequent treatment.
The design of the system
It is strange that the staging system makes no reference to the cause of CKD. Cancer staging systems are specific to the tumour site and the implications of the different stages have very different implications based on the type of cancer concerned (e.g. some metastatic cancers are treatable whereas others currently have no therapeutic options). In this manner, the CKD «staging» system is more akin to the grade of a tumour (i.e. a measure of its degree of dysplasia) which is only one piece of useful information about a tumour (whereas the CKD staging system is being used as a single defining description of the kidney problem).
The underlying diagnosis is obviously critical to the subsequent management of the kidney problem. Although some treatments are universal (e.g. strict blood pressure control), others (e.g. immunosuppression) are only useful patients with specific disorders diagnosed by renal biopsy e.g. membranous nephropathy or systemic lupus erythematosus.
The normal range of GFR is wrong
For a schema that is so rigidly dependent on GFR it is extraordinary that the normal range is held to be >90 mL/min/1.73m2 across all age ranges and 60-89 mL/min/1.73m2 is considered «reduced». This conflicts with measured GFRs in kidney donors and ignores the observed reduction in GFR with age24. The rigidity also ignores the biological variation between individuals and the fact that GFR is not constant in an individual. The change in GFR after a high protein meal, in pregnancy and after kidney donation demonstrate clearly that humans have reserve and gear their GFR to their needs.
The problem has been aggravated by the imprecision and bias of eGFR at the upper ranges and has caused confusion especially when it was realised, after eGFR was rolled out, that the method of creatinine measurement was rather important. Quite small differences had huge effects on eGFRs and therefore on estimates of the prevalence of CKD. We are now being offered the CKD-EPI equation which reduces the bias of the estimates but does not improve precision very much compared to the eGFR (MDRD) equation25. We may yet move on to combine the creatinine-based equations (CKD-EPI and MDRD) with cystatin C to improve specificity, but cystatin C may not be much superior to creatinine26. It is not surprising that colleagues in primary care are confused and irritated. Having informed patients they have CKD they now have to say that a different method of evaluating the same blood test reveals the original diagnosis to have been wrong.
It does not include proteinuria in stages 3-5
The importance of proteinuria, especially macro-proteinuria (overt proteinuria), in informing prognosis has emerged strongly from recent studies22. Indeed proteinuria is a worse prognostic factor than reduced GFR alone and there is synergy between them. Proteinuria (albuminuria) has a continuous positive association with risk, while eGFR in non-linearly related to risk of adverse outcomes. It will therefore be impossible to stage kidney disease 1-5 in a unidimensional manner with two different variables. This problem is neatly illustrated in the PREVEND Study which showed that normo-albuminuric CKD stage 3 had a better prognosis than stage 1 with micro-albuminuria27. A worse stage should not have a better prognosis.
It is not calibrated for age
Using an absolute threshold level of eGFR (i.e. <60 mL/min/1.73m2) alone to diagnose CKD (stage 3) without any modification for the effects of normal aging cannot, in our estimation, be justified28. This is the main reason why «CKD» is so common in the elderly. Cross-sectional studies of eGFR with aging have uniformly and consistently shown a systematic decline in eGFR (and measured GFR) with aging (averaging about 7-10 mL/min/1.73m2 per decade, beginning after age 30-40 years)24. Longitudinal studies in the same subjects over extended periods of time are sparse and suggested that such declines in eGFR are the general rule29. Any evidence that such a modest decline in eGFR associated with normal aging in the absence of any structural disease or proteinuria confers any survival disadvantage has not yet appeared. No prospective trials designed to curtail the age-associated decline in eGFR in order to determine an effect on outcome have been conducted. The decline in eGFR with aging is not connected to elevation in blood pressure nor to underlying renal morphology.30,31 To arbitrarily select a single absolute threshold of eGFR (one that is 50% of a level in a 20 year old adult) to define CKD is simply inappropriate and incorrect. For example an eGFR of 50 mL/min/1.73m2 has radically different implications in a 25 year old man (unequivocally abnormal for age) and a 75 year old female (within the normal range for age), leading some to call for age- (and gender-) specific eGFR values32.
Micro-albuminuria alone is diagnostic of CKD
It is noteworthy that the prevalence of Stage 1 and 2 CKD is largely determined by the presence of microalbuminuria (urinary albumin to creatinine ratio of 3 – 30 mg/mmol). In fact, according to the often quoted NHANES study, over 90% of subjects with stages 1 and 2 CKD respectively had only microalbuminuria as the diagnostic criterion6. Microalbuminuria is well known to by a very dynamic condition influenced by non-specific events such as fever, exercise, obesity, ageing, medications, remote infection and inflammation. This was elegantly demonstrated in a subsample of the NHANES dataset in which only 50% of people with eGFR >90 mL/min/1.73m2 and microalbuminuria at their first visit had persistent microalbuminuria at a follow-up visit about two weeks later5. Elevated urinary excretion rates of albumin are strongly associated with cardiovascular disease perhaps because atheromatous plaques engender an inflammatory state or because of systemic endothelial dysfunction33. One might question whether microalbuminuria alone without any other manifestation of kidney damage should qualify as a diagnostic criterion for CKD. Microalbuminuria may not even be a very reliable predictor of progression of kidney disease in diabetes34.
PROPOSALS FOR REDESIGN OF THE CONCEPT
Nephrologists and others have responded to these defects and proposed alternatives.
UK National Institute for Clinical Excellence (NICE)
The key changes in the NICE construct from KDOQI are the requirement for macroproteinuria (overt proteinuria) in CKD stages 1 and 2 (microalbuminuria is disqualified as a sole indicator of CKD), the splitting of CKD stage 3 into an A and B substage at an eGFR of 45 mL/min/1.73m2, and the addition of the suffix P + or P – to indicate the presence or absence of overt proteinuria. This is a significant advance but still a faulty compromise. It ignores the fact that eGFR cannot accurately predict true GFR in the range 60 – 120 mL/min/1.73m2 and so there is no real purpose in subdividing patients regarded as having normal renal function (which many do not) who have other evidence of CKD into two separate stages. CKD stages 1 and 2 are in reality inseparable. The CKD stage 3 A and B distinction in part acknowledges that older subjects with eGFRs of 45 – 59 mL/min/1.73m2 (especially if they have no abnormal proteinuria) are not at excess risk of renal failure, complications or cardiovascular events27. However, this leaves subjects without any disease with a label of CKD stage 3A (half way to the end-point stage 5) which is a very unsatisfactory situation from a patients perspective. Sadly, even these sensible modifications have not been widely adopted in clinical practice or in community screening proposals.
Kaiser Permanente
Rutkowski et al. “departed” from the KDOQI system by requiring macroproteinuria for stages 1, 2 and 3 and adjusting GFR for those falling into stage 3 by adding half of the subject’s age (up to 85 years) to the GFR35. Using these stiffer requirements for diagnosing CKD they found the prevalence of CKD in the population for which this HMO was responsible of 0.1%, 0.2%, 1.7%, 0.5% and 0.01% (for stages 1 to 5 [not on RRT] respectively). These are credible estimates for nephrologists and are one-fifth the values quoted by NHANES using the KDOQI criteria6 .
The CARI Guidelines
The Caring for Australians with Renal Impairment (CARI) guidelines (currently under final development) diagnose CKD by the presence of either kidney damage (proteinuria, haematuria or structural abnormalities) or an eGFR <60 mL/min/1.73m2 and suggest that an underlying cause is then sought. They recommend that kidney disease is staged by eGFR (with stage 3 split into 3A and 3B as NICE above) and albuminuria (normal, micro- and macro-albuminuria) simultaneously. However, these guidelines acknowledge that in people aged over 70 years with a stable eGFR >45 mL/min/1.73m2 and albuminuria in the normal range, the reduced eGFR may be consistent with physiological age-related GFR decline.
Winearls and Glassock
We have proposed a system that requires that the subject have specific persisting, irreversible pathology of the kidneys (inferred from abnormal urine deposit, macro-proteinuria, abnormal kidney imaging or histology) and that the GFR be referenced to percentiles for age, gender and ethnicity4. Additionally the suffix P+ or P- should be used denoting whether the renal function is deteriorating (e.g. at >3 mL/min /1.73m2/year). If the same system was to be used for renal transplant recipients the suffix T could be used.
- Stage 1 CKD: the presence of kidney injury but an eGFR within the upper 95% of the age-specific range.
- Stage 2 CKD: the presence of kidney injury with an eGFR below the 5th centile for age but >30 mL/min/1.73m2 and no evidence of complications of reduced kidney function (i.e. anaemia attributable to CKD or mineral-bone disorder).
- Stage 3 CKD: an eGFR below 5th centile for age with complications or an eGFR <30 mL/min/1.73m2 which is unequivocally abnormal in all age groups. Kidney injury could be inferred.
- Stage 4 CKD: an eGFR of <15 mL/min/1.73m2 which is generally accepted as the point at which there is a significant risk to the health and life of the patient.
- Stage 5 CKD: patients receiving renal replacement treatment by dialysis.
Patients with an eGFR >30 mL/min/1.73m2 but less than the 5th centile for age without any evidence of structural renal disease or complications could be described as having isolated “reduced (kidney) function of uncertain significance” or ReFUS. Like patients with monoclonal gammopathy of uncertain significant (MGUS) who are followed to ensure timely diagnosis of myeloma, such patients should be followed (in primary care) to ensure they do not subsequently develop “true” CKD.
KDIGO (2009)
At the Kidney Disease: Improving Global Outcomes (KDIGO) Controversies Conference held in London in October 2009 an extensive meta-analysis of numerous studies examining prognosis of CKD recognised the importance of proteinuria, and the underlying diagnosis as well as GFR. The “grey area” remained CKD stage 3 especially the upper half of its range (45 – 59 mL/min/1.73m2). There did not appear to be a clear disadvantage for older subjects (>65 years) in being in this category if there was no proteinuria. A descriptive system was proposed; patients would be classified by:
1. Diagnosis (if known);
2. eGFR stages 1 – 5 with stage 3 being subdivided at the 45 mL/min/1.73m2 point into stages 3A and 3B (similar to NICE and CARI, above);
3. Albuminuria: A0 (none), A1 (microalbuminuria) and A2 (macroalbuminuria) using the spot first morning void urinary albumin to creatinine ratio as the standard of reference
The issue of age calibration of GFR was unresolved and no decision was reached as to what to do with stage 3A in older subjects was reached. This will be essential as they comprise most of CKD in the elderly. The issue of whether isolated (persistent) microalbuminuria is indicative of chronic kidney disease was hotly debated without any satisfactory consensus.
CONCLUSIONS
The nephrology community needs to insist that the architects of a new system for classifying CKD develop it in a transparent manner, accommodate legitimate criticism and provide an accurate, useful approach to the diagnosis, classification, staging and risk stratification of CKD. The stratification of risk of adverse events (death, ESRD, acute kidney injury and CV disease) should be separate from the requirements for diagnosis.
The application and pitfalls of the new system at the “bedside” should be clearly articulated. The needs of public health authorities and epidemiologists to identify CKD in terms of incidence and prevalence should be considered but not relegate the need for a clinical tool to identity bona fide CKD and its attendant risks to inferior status. Increasing awareness of CKD is a logical by-product of a classification system but mislabelling large segments of a relatively healthy population as diseased based on innocuous laboratory findings combined with an overly rigid diagnosis and staging system should be avoided.

Table 1. Stages of chronic kidney disease

Figure 1. RRT incidence rates in the countries of the United Kingdom 1990-2008

Figure 2. Referrals to the Oxford Kidney Unit between 2000 and 2008 according to the time between presentation to the unit and start date of RRT. Only 4% of referrals were avoidable late referrals

Figure 3. Prevalence of metabolic complications according to GFR