
Diet composition has long been known to influence acid–base balance by providing acid or base precursors. In general, foods rich in protein, such as meat, cheese, eggs, and others, increase the production of acid in the body, whereas fruit and vegetables increase alkalis. The capacity of acid or base production of any food is called potential renal acid load (PRAL). Diets high in PRAL induce a low-grade metabolic acidosis state, which is associated with the development of metabolic alterations such as insulin resistance, diabetes, hypertension, chronic kidney disease, bone disorders, low muscle mass and other complications. The aim of this paper is to review the available evidence which evaluates the association of the PRAL of the diet with the incidence of chronic diseases and metabolic disorders, as well as related mechanisms involved in their development.
En la actualidad se ha evidenciado el rol de la composición dietética en el equilibrio ácido-base, al proveer precursores ácidos y álcalis. De manera general, los alimentos altos en proteína, como la carne, los quesos, huevo, entre otros, incrementan la producción de ácidos en el organismo, mientras que las frutas y los vegetales incrementan los álcalis. La capacidad que tiene un alimento para producir precursores ácidos o bases se denomina carga ácida potencial renal (PRAL). Dietas con PRAL elevados ocasionan un estado de acidosis metabólica de bajo grado, el cual se ha asociado con el desarrollo de alteraciones metabólicas como resistencia a la insulina, diabetes, hipertensión, enfermedad renal crónica, alteraciones óseas y baja musculatura, entre otras complicaciones. El objetivo del presente trabajo es realizar una revisión de la evidencia disponible a la fecha que evalúa la asociación entre el PRAL de la dieta con la incidencia de enfermedades crónicas y alteraciones metabólicas, mencionando los mecanismos involucrados en su desarrollo.
Currently, chronic noncommunicable diseases (CNDs) represent a public health problem, accounting for 70% of deaths in developing countries. The main CNDs are cardiovascular disease, cancer, chronic respiratory diseases and diabetes.1 Historically, an association has been reported between the feeding pattern and the development or progression of metabolic disorders and CNDs.2 In recent years one aspect that has received attention is the impact of the micronutrient profile on the maintenance of acid base equilibrium, describing the deleterious impact of metabolic acidosis (MA) on health status. The objective of the present review is to analyze the available evidence of the dietary acid load in different clinical conditions (Fig. 1).
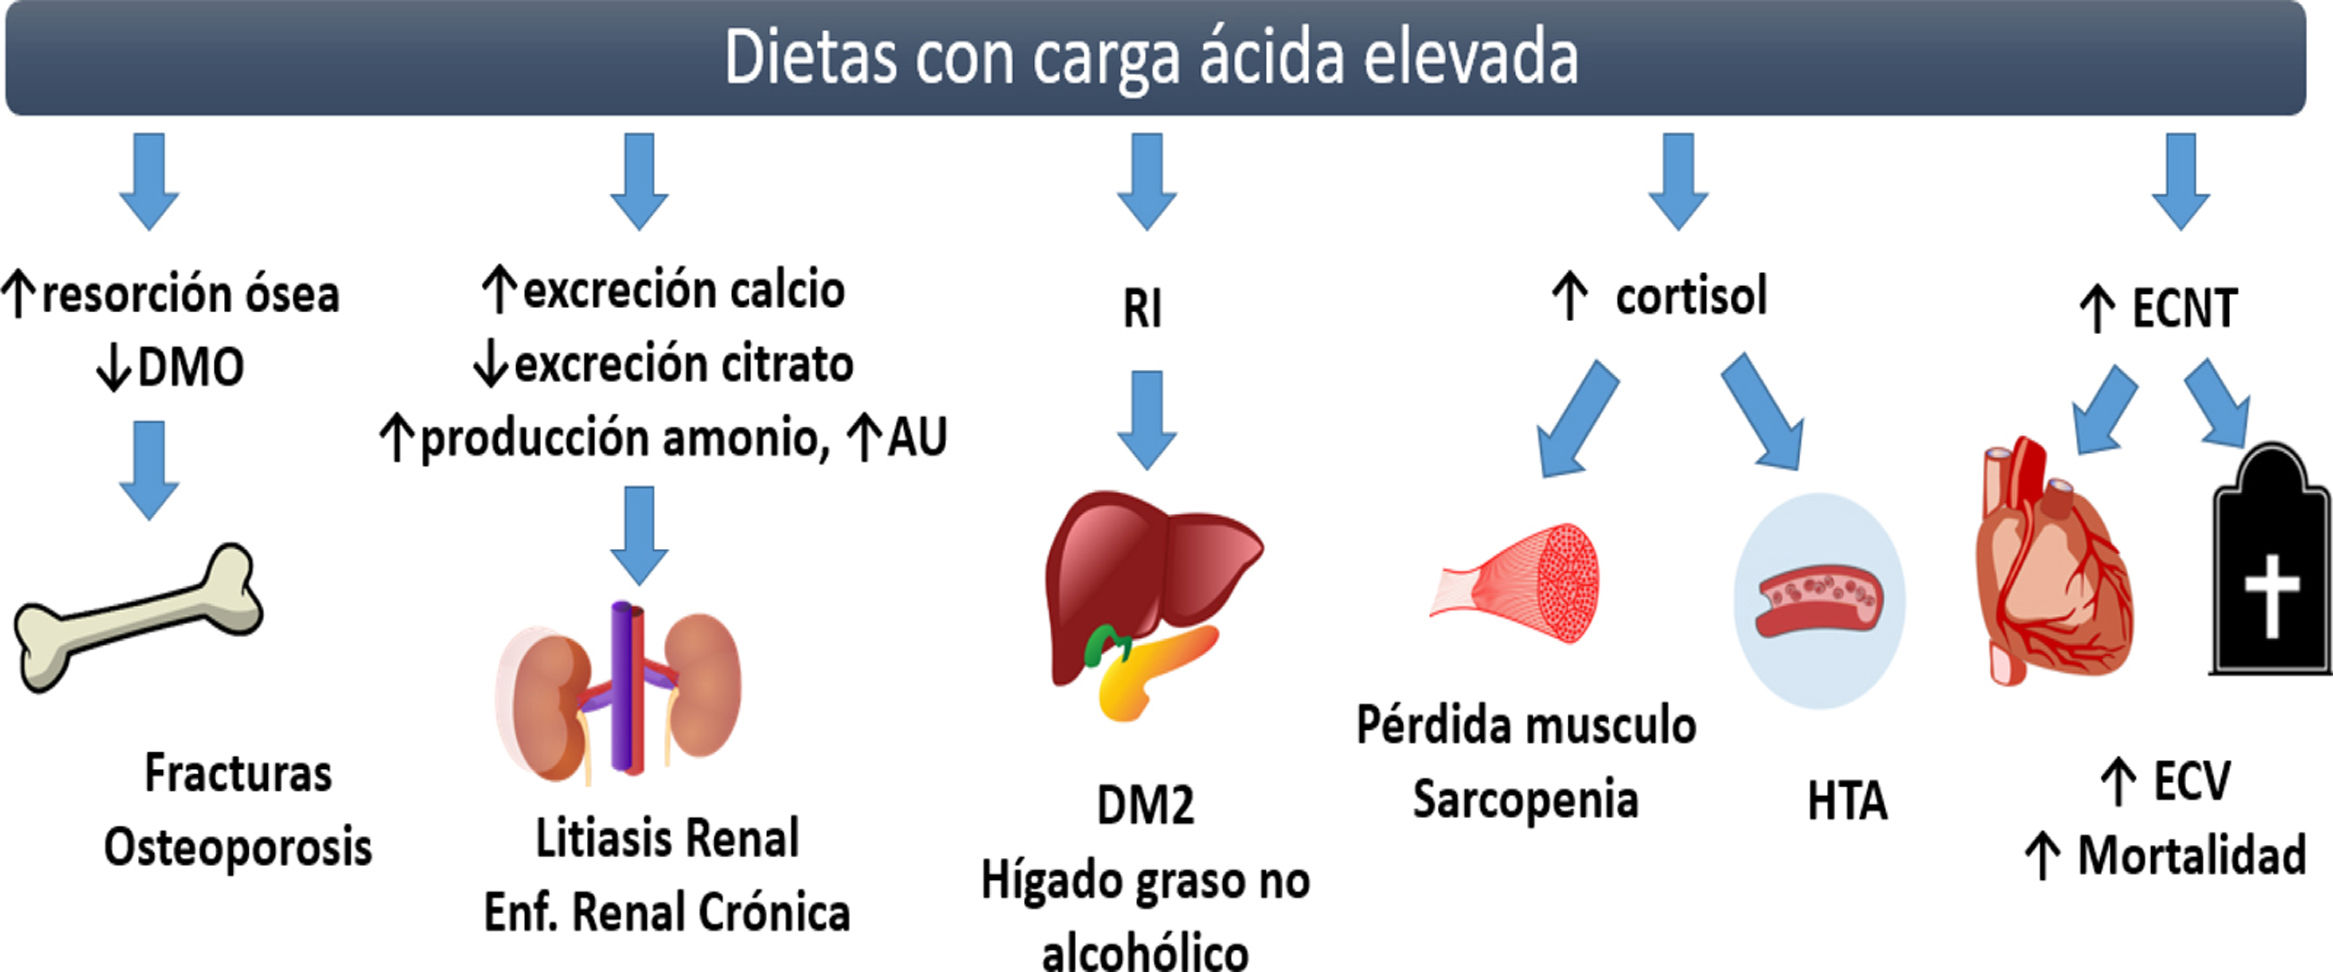
Complications of diets with high acid load. The chronic consumption of diets with high acid load favors the development of low grade AM, which is linked to metabolic abnormalities such as a decrease in bone mineral density and osteoporosis due to the activation of osteoclasts. In kidneys, MA causes an increase in urinary excretion of calcium, an increase in the reabsorption of citrate favoring the development of kidney stones, an increase in ammonium excretion and a decrease in uric acid excretion affecting the development and progression of the chronic kidney disease. Low-grade metabolic acidosis causes hypercortisolism, which decreases insulin sensitivity, with high risk of developing DM2 and nonalcoholic fatty liver. Decreases muscle anabolism and exacerbating the proteolytic state, putting the individual at greater risk of sarcopenia. The increase in Uric acid (UA), hypercortisolism and IR are considered risk factors for the development of hypertension. Independently, the acid load of the diet is associated with an increased cardiovascular risk. BMD: bone mineral density; AU: uric acid; IR: insulin resistance; DM2: diabetes mellitus type 2; HTN: hypertension; CNDs: chronic noncommunicable diseases; CVD: cardiovascular disease; ↑: increase; ↓: decrease.
The organs involved in the maintenance of acid base balance are the lungs and kidneys, as well as a complex system of buffers (buffers). The interaction and proper function of these mentioned elements is required to maintain the arterial pH in optimal ranges (7.35–7.45). The condition where the pH value is less than 7.35 is called acidemia, and a value greater than 7.45 is called alcalemia. The main function of the lungs in acid–base homeostasis is the elimination of carbon dioxide (PaCO2). The kidneys reabsorb the filtered bicarbonate and maintain the production of bicarbonate (HCO3−) with the excretion of titrable and non-titratable acid, through the ammonium system (NH4+) in the urine. Metabolic acidosis (MA) is defined as the presence of an arterial pH<7.35 and/or decreased concentrations of HCO3−.3,4 The condition where the pH is very close to the lower limit (7.35) is called low-grade MA.5
Diet plays an essential role in the maintenance of acid base balance. Once the food is ingested, the stomach wall excretes hydrogen ion and the pancreas secretes alkali into the digestive tract. The gastrointestinal tract affects the acid–base state by absorbing sulfur amino acids and alkali salts, which will be transported as substrates to the liver and to metabolically active tissues. Once oxidized, the sulfur amino acids release protons and the organic acids release alkali, that will impact on the acid base reserve, being finally excreted by the kidneys. Although the intestine does not generate either acids or bases, the characteristics of the diet determine the formation of acids and alkalis once absorbed and metabolized in the liver.6
The dietary components that release acid precursors after metabolism are phosphorus and proteins (mainly the sulfur amino acids, such as cysteine, methionine and taurine, as well as cationic amino acids such as lysine and arginine). The nutrients precursors of alkali are potassium, magnesium and calcium.6
Measurement and estimation of endogenous acids productionThe kidneys eliminate the products from the metabolism of some anions (chlorine, phosphorus, sulphate), organic acids and cations (sodium, potassium, calcium, magnesium). If the amount of anions exceeds that of cations, a mechanism of urinary acid excretion (hydrogen ions H+) is stimulated. The total amount of acid excreted is called net acid production (NEAP) [(anionic+organic acids)−cations], which can be measured in the urine (direct NEAP) with the determination of ((NH4+ titicatable acid)−HCO3), or it can estimated through the dietary composition of the healthy individual (estimated NEAP). The amount of acids and alkalis that are produced according to the nutrient profile of the diet is called potential renal acid load (PRAL), this includes the amount of endogenously synthesized organic acids (estimated OA).7,8 There are 3 different ways to estimate the NEAP; Frassetto et al. proposed two equations to estimate the NEAP, which consider only the consumption of protein and potassium.9 Remer et al. proposed a mathematical model to estimate the PRAL which incorporates the amounts of micronutrients present in the regular diet of the individual, to which, by adding the estimated OA the stimated NEAP it is obtained. This same research group also proposed a model to estimate the PRAL that incorporates the amounts of micronutrients excreted in the urine, which we will called in the present work as urinary PRAL10 (Table 1).
Equations for estimating the Net Acid Production (NEAP).
| Indicator | Equation |
|---|---|
| NEAPest (mEq/day)Frasseto et al.9 | Equation 1=(0.91×protein g/d)−(0.57×Potassium mEq/d)Equation 2=[(54.5×protein g/d)/Potassium mEq/d]−10.2 |
| NEAPest (mEq/day)Remer et al.7 | PRAL+OAestPRAL (mEq/día)=(0.49×protein g/d)+0.037×phosphateo mg/d)−(0.021×potassium mg/d)−(0.026×magnesium mg/d)−(0.013×calcium mg/d)OAest (mEq/day)=(0.007184×height cm 0.725×weight kg 0.425)×41/1.73 |
| PRALurine (medición en orina)Remer et al.10 | =(2xsulfatemmol/d+chloride)+(1.8×phosphatemmol/d)−(2×sodiummmol/d+potassiummmol/d+magnesiummmol/d)+(2×calcium mmol/d). |
NEAP: net acid production; PRAL: potential renal acid load.
The accuracy of the equations for estimating NEAP has not been studied in detail. Parmenter et al. reported a greater accuracy in the NEAP estimation by using the Remer T equations, observing a low accuracy using both equations proposed by Frassetto et al.; however, these calculations are frequently used in the literature.11
Potential renal acid loadThe concept of Potential renal acid load (PRAL) was coined by Remer and Manz in 1994, which reflects an estimate of the rate of intestinal absorption of various nutrients, the ion balance of calcium, magnesium and potassium, and the dissociation of phosphate at a pH of 7.4. The PRAL can be calculated for any food, categorizing them according to their capacity to release acids or bases to the circulation. Also the PRAL of the patient's diet can be studied by evaluating the daily consumption of the nutrients of interest. Diets with positive PRAL increase the production of acid precursors, while diets with negative PRAL increase the production of alkali precursors, that is, if the PRAL value for a type of food is <0, it is considered that such a food increases the alkalinity of the body fluids and, if PRAL>0, the food increases the production of acids in the body, with the corresponding impact on the acid–base state. In general, foods such as meat, eggs, cheese and whole grains have positive PRAL, while fruits and vegetables have negative PRAL. The PRAL of milk is considered neutral, as well as fats and sugars that have a small effect on the acid–base balance.10
Food and potential renal acid loadThe concept of PRAL has physiological bases and takes into account the chemical composition of foods (protein content, chloride, phosphorus, sodium, potassium, calcium and magnesium), the different rates of intestinal absorption of minerals and proteins with sulfur amino acids, as well as the amount of sulfates produced by protein metabolism.
Vegetable proteins have lower biological value as compared with proteins of animal origin. This is due to the proportion of cysteine and methionine, however, it is not considered that the protein of vegetable origin has a lower content of sulfurized amino acids for each gram of protein, so diets high in protein, regardless of type (animal or vegetable origin), tend to increase the PRAL.12
Food with positive PRALThe consumption of industrialized diets with a low content of fruits and vegetables, together with a high consumption of products of animal origin and cereals, are characterized by having a positive PRAL, which may reach 50–100mEq/day. The amount of acid excreted will depend on which amino acids are present in the diet, since some are classified as neutral, others as acids and others as alkaline. The amino acids that increase the production of acids are lysine, arginine and histidine, which generate hydrochloric acid when they are metabolized. Cysteine and methionine, contain sulfur in their composition and produce sulfuric acid. Foods of animal origin, such as meat, fish and cheeses, are rich in these amino acids and are the main determinants of the acid load of the diet.13,14
It is important to note that the quality of the protein should also be taken into consideration in order to quantify the acidity of the diet. Animal proteins tend to have a high amount of phosphorus which increases PRAL, with the exception of milk, whose amount of phosphorus is compensated by the amount of calcium. Vegetable proteins have phosphorus in the form of phytate, which is less bioavailable and does not have the same acidifying effect. In addition to this, vegetable proteins are generally richer in glutamate, which requires the use of hydrogen ions for their metabolism, and may have a neutral effect on the acid load.15
Food with negative PRALFruits and vegetables have a negative PRAL, so they are considered the greatest source of buffer in the diet due to their potassium content, which is involved in acid–base balance by helping electro-neutrality through exchange with hydrogen ions in the distal part of the nephron. The metabolism of the potassium salts found in fruits and vegetables, including citrate and malate, leads to the consumption of hydrogen ions and, consequently, to an alkalizing effect. Considering this, the concentration of potassium in the food reflects the alkalizing capacity of fruits and vegetables, although the potassium content of the food can be affected by the cooking method, being significantly reduced after cooking the food in water.14,16
The presence of oxalate in the food prevents the metabolization of potassium and the subsequent production of alkalis, contributing to the production of acids due to oxalic acid. Some foods rich in oxalate are beets, spinach, Swiss chard, blackberries, cherries, grapes, raspberries, among others. It is important to consider that the composition of micronutrients will determine a negative PRAL, however the publications suggests not to include them in the diet due to the oxalate content.14,16
Clinical implications of diets with high acid loadThe consumption of a diet high in protein and phosphorus, low in potassium, calcium and magnesium, has an impact on long-term health, since these are considered acidogenic diets, that cause low-grade MA.17
One of the complications of low-grade MA is the increase in cortisol secretion and the decrease in its inactivation 18leading to hypercortisolism which increases the risk various metabolic disorders such as sarcopenia, insulin resistance, Type 2 diabetes mellitus and cardiovascular diseases, among others (Fig. 1).19 Epidemiological studies evaluating an association between acid load (PRAL, NEAP estimated or NEAPurinary) and the development of metabolic abnormalities are presented in the supplementary table.
SarcopeniaHypercortisolism decreases the muscle mass by increasing proteolysis and inhibiting protein synthesis.20,21 A reduced muscle reserve or greater muscle loss has been documented in individuals who consume diets with high acid load (positive PRAL).22–24 In the elderly, reduced musculature is associated with an increased risk of frailty; Kataya et al. reported a high prevalence of frailty in Japanese women who consumed diets high in NEAP estimated and PRAL.25
Low bone mineral density/osteoporosisMetabolic Acidosis decreases the activity of osteoblasts and activate osteoclasts, which is mediated by the release of β-glucuronidase. The increased osteoclastic releases calcium and phosphorus from bone which buffers hydrogenions and maintain the serum pH in normal ranges, and of course calciuria increases. If this process is maintained will produce osteodystrophy, osteoporosis and an increased risk of fractures.26,27 Thus, the chronic consumption of acidifying diets may cause a decrease in bone mineralization and an increase in bone fractures.
Different prospective studies in children document that the consumption of diets with high PRAL are associated with a low cortical bone area and low bone density,28,29 increasing the risk of fractures in women but not in men.30 In a sample of 861 men and women older than 70 years, Jia et al. did not observe a relationship between dietary acid load and bone mineral density,31 while Jonge et al. observed an inverse relationship between acid load and the bone microstructure quality evaluated through trabecular bone structure in 4672 adult women above 45 years old.32
Arterial hypertensionMA and diets high in PRAL results in increased blood pressure (BP), due to: (1) the increase in cortisol and its effects on vasoconstriction, (2) the increase in the renal excretion of calcium and magnesium, (3) the decrease in renal excretion of citrate, (4) resistance to insulin and (5) alteration in the secretion of insulin-like growth factor (IGF-1).33 Likewise, a diet high in PRAL is associated with an increase in uric acid (UA) concentrations due to a reduced urate transport in the proximal tubule to the lumen,34 which could explain the effect on the increase in blood pressure through hyperuricaemia a independent risk factor of HTN.35
Zhang et al. published in 2009 one of the first prospective studies, 87,293 women followed for 14 years, reporting an association between acid load and incidence of hypertension.36 Other authors have not observed an association between PRAL estimated through diet and alterations in BP.33 Similar results were published by Engberink et al., who did not observe an association between estimated NEAP and PRAL and BP.37 Akter et al. found a relationship between PRAL and the prevalence of HTN in patients analyzed by tertiles, reporting an OR of 1.31 (95% CI 1.01–1.70, p=0.043).38 Krupp et al. evaluated the PRAL of the diet in 6788 patients from Germany and they found a 45% greater risk of developing hypertension in patients with elevated PRAL.39 Tielemans et al. evaluated the relationship between PRAL and the development of eclampsia in a cohort of pregnant women and they did not observe an association between PRAL nor NEAP estimated with the incidence of eclampsia or HT.40
Insulin resistance/diabetesMA decreases insulin sensitivity by causing alterations in the expression of insulin receptor and decreasing AKT phosphorylation. These abnormalities have been observed in patients with pH<7.2. In patients with low-grade MA, insulin resistance (IR) has been observed due to the increase in hepatic gluconeogenesis and adecrease in muscle uptake of glucose.41 Akter et al. observed in 1732 adults a positive association between PRAL and NEAP estimated with IR.42 In pregnant patients, IR is determinant in the development of gestational diabetes mellitus (GDM), in these patients PRAL is associated with high glucose levels, elevation of total cholesterol and LDL cholesterol, and they have an increased risk of gestational diabetes mellitus (GDM) ((OR 5.25, IC95% 2.99–9.24, p<1.001) adjusted for age and energy consumption).43
Insulin resistance is a risk factor for the development of diabetes. Fagherazzi et al. reported an association between NEAP and PRAL with risk of type 2 diabetes (DM2) in a population of 66,485 women followed for 14 years.44 This association was confirmed by Kiefte-de Jong et al., who evaluated the PRAL and NEAP estimated in 3 different cohorts (Nurses Health Study, Nurses Healthy Study II and Health Professionals Follow-Up Study), which together they make a total of 187,490 patients (19% men).45 These results differ from those reported by Xu et al.,46 who did not observe a relationship between PRAL and NEAP estimated with insulin sensitivity and risk of type 2 DM. Akter et al. did not observe a relationship between PRAL and in NEAP estimated with DM2 in women but an association was observed in men.47 Due to the controversy in the results, in 2017 Jayedi et al. published a meta-analysis in which the four previously mentioned studies were included, observing an increase in the risk of DM2 of 22% in patients with the highest PRAL (RR 1.22, 95% CI 1.09–1.35, p=0.01) and 23% for NEAP estimated (RR 1.23, IC95% 1.10–1.36, p=0.03); performing the analysis by gender, statistical significance was observed only in women.48
In Japanese patients with a diagnosis of DM2, those with high PRAL presented a higher prevalence of metabolic syndrome (OR 2.22, 95% CI 1.04–4.83, p=0.0384); also, patients with high NEAP estimated have increased prevalence of metabolic syndrome (OR 2.61, 95% CI 1.25–5.55, p=0.0098).49
Non-alcoholic fatty liverThe IR associated to acidic diets and the consequent hyperglycemia appear to increase the inflammation and IR in the liver which may cause non-alcoholic fatty liver due to the increase in available free fatty acids.5 Krupp et al. observed an increase in alanine aminotransferase (ALT) concentrations and hepatic steatosis and fatty liver index in adolescent women on high PRAL diets. This association was not observed in men.50 In Asian adults, Chan et al. reported a positive association between estimated NEAP and fatty infiltration in the liver, such association was not observed with PRAL.51
Chronic kidney diseaseDiets with a high acid load estimulate the ammonium production of by tubular cells to neutralize the load of tubular hydrogen ion. This produces tubular hypertrophy and glomerular hyperfiltration, which is an early and reversible stage of chronic kidney disease (CKD). The increase in intratubular concentrations of hydrogen ions is accompanied by an increase in the production of endothelin-1, angiotensin II and aldosterone, substances that stimulate the production of pro-fibrotic factors, causing a decrease in GFR if the ingestion of food producing acid is maintained for a long period of time.16
After evaluation of 123,169 adults in Korea, So et al. reported an increase in GFR (hyperfiltration) associated with the consumption of high PRAL diets,52 In 2014, Banerjee et al. showed in 12,293 Americans patients that high diets in estimated NEAP were associated to an increased incidence of markers of renal damage (a 57% increase in albuminuria and 37% reduction in GFR).53 Recently, the same group of researchers show a higher prevalence of albuminuria and decreased GFR in 3257 African-American individuals on a high PRAL diets.54 Rebholz et al. followed a cohort of 15,055 American adults for 21 years; individuals with highest consumption of PRAL had a 13% increased incidence of CKD and those with highest consumption of NEAP estimated presented a 14% increased in CKD.55 Similar results were obtained by Ko et al. (2017), in a cross-sectional study that evaluated the estimated NEAP and renal function in 1369 Korean adults.56
Once the renal damage has developed, high diets in acid load accelerate the progression of the disease, increasing the risk of end stage renal (ESRD). This was observed by Banerjee et al., who followed for a 14 year period a group of patients with CKD, evaluating the estimated NEAP and the time elapsed until the initiation of renal replacement therapy. A more rapid progression to ESRD (OR 3.04, 95% CI 1.58–5.86, p≤0.05) was observed in patients with diets high in estimated NEAP.57
In CKD patients, diets high in PRAL and estimated NEAP are inversely associated with the serum bicarbonate level and with glycemic control; the systolic blood pressure is increased and the concentrations of triglyceride are elevated, factors that negatively affect clinical outcomes.58,59
NephrolithiasisIn response to MA, the kidney increases the urinary excretion of phosphorus, chloride and sodium, and increases the reabsorption of citrate in the renal tubules (hypocitranuria) with acidification of the urine pH. These changes increase the risk of kidney stone formation.13,60,61 Trincheri et al. evaluated the PRAL and estimated NEAP in a sample of 123 stone-forming individuals and 123 controls, reporting a higher risk of stones in those with higher PRAL and estimated NEAP.62 Similar findings were reported by Ferraro et al., who analyzed the relationship between the estimated NEAP and the incidence of renal lithiasis in three cohorts (Health Professionals Follow-Up Study, Nurses Health Study I and Nurses Health Study II).63
Cardiovascular disease and mortalityComplications associated with MA, such as IR, DM2, HTN and CKD, among others, are considered risk factors for cardiovascular disease. Furthermore, as reported by Han et al., after analyzing the PRAL in 11,601 patients from Korea, diets with high PRAL are independently associated with an increased cardiovascular risk (ASCVD>10% in 10 years or Framingham>20% in the same period of time),64 To date, it is the only epidemiological study that evaluates the association between cardiovascular risk and dietary acid load.
Today, cardiovascular diseases represent the main cause of mortality worldwide.65 Considering the effects of high acid load diets, the possible association of PRAL with mortality has been evaluated in two studies; Huston et al. did not observe association of estimated NEAP with mortality in a total of 16,906 American patients,66 However, Akter et al. observed in a cohort of 92,478 Japanese patients an association between PRAL and estimated NEAP with mortality. They reported an increase of 13% in general mortality and 16% in cardiovascular mortality in individuals with high PRAL; similar increase risk in mortality was found in patients with high estimated NEAP (12% for general mortality and 17% for cardiovascular).67
Clinical applicationsKnowing the clinical implications of low grade MA, it is important to monitor the acid base balance through non-invasive methods. The measurement of urinary pH, obtained from a random sample, has been shown to be a good PRAL marker (β=−0.08, p<0.001). An alkaline urinary pH is associated with diets with negative PRAL68 even in patients with DM2 (r=−0.24, p=0.002), and it is shown that urinary pH values of less than 6.0 are associated with acidifying diets,69 Questionnaires for the quantification of dietary acid load are suggested for a subsequent implementation of dietary strategies.
The consumption of vegetable proteins versus proteins of animal origin could provide benefits. It has been shown and increase in urinary pH after 7 days on a vegetarian diet; the same effects are observed in patients after following this type of diet for only 2 or 3 days per week.70 The incorporation of dairy products (milk or yogurt) could help to cover for the protein intake without impacting the acid load, since they are foods with neutral PRAL,16 and the incorporation of fruits is inversely associated with the estimated NEAP, so the inclusion of this group of foods may reduce the acid load of the diet, however foods with high oxalate content should be avoided.71
The reduction in the consumption of industrialized products with phosphorus additives (carbonated beverages, industrialized teas, meats, frozen products and other products with food additives) may help to reduce the acid load.72
The routine consumption of mineral water or beverages with added bicarbonate has been shown to have beneficial effects in terms of increasing of urinary pH. These effects have been shown in the studies by Siener et al., that gave 1.4L of mineral water a day (3388mg/L of bicarbonate, 232mg/L of calcium and 337mg/L of magnesium)73; by Heil, who gave to drink mineral water rich in calcium, potassium, magnesium and selenium for 2 weeks74 and by Day et al. administering 1.5–1.8L/day of water enriched with 650mg/L of bicarbonate and 120mg/L of magnesium.75
In patients with CKD, an strategy to reduce MA is oral sodium bicarbonate supplementation, at a dose of 600mg/three times a day for 1 year, observing an increase in serum bicarbonate concentrations and a reduction in the decline in renal function in the supplemented group.76 This strategy has not been evaluated in low-grade MA not associated to CKD.
The PRAL calculation requires the use of a food frequency questionnaire or food diaries, for estimation of the relevant micronutrients consumption. In case of not having an appropriate software, it is suggested the inclusion of foods with neutral or negative PRAL, using PRAL tables for food portions (Table 2).
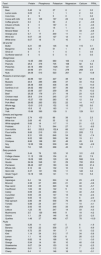
Estimated PRAL in 100g of food.
| Food | Protein | Phosphorus | Potassium | Magnesium | Calcium | PRAL |
|---|---|---|---|---|---|---|
| Drinks | ||||||
| Beer | 0.46 | 14 | 27 | 6 | 4 | 0.0 |
| Lemon soda | 0.05 | 0 | 1 | 1 | 2 | 0.0 |
| Cola Cola | 0 | 9 | 5 | 0 | 1 | 0.2 |
| Cocoa with milk | 3.5 | 105 | 197 | 23 | 114 | −0.6 |
| Coffee ground | 0.3 | 3 | 50 | 4 | 2 | −0.9 |
| Infusion of fruits | 0 | 0 | 167 | 0 | 0 | −3.5 |
| Green tea | 0 | 0 | 15 | 1 | 0 | −0.3 |
| Mineral Water | 0 | 0 | 2 | 11 | 33 | −0.8 |
| Orange juice | 0.7 | 17 | 200 | 11 | 11 | −3.7 |
| Wine red | 0.07 | 23 | 127 | 12 | 8 | −2.2 |
| White wine | 0.07 | 18 | 71 | 10 | 9 | −1.2 |
| Oil and fat | ||||||
| Butter | 3.21 | 85 | 135 | 10 | 115 | 0.1 |
| Margarine | 0.23 | 7 | 51 | 1 | 6 | −0.8 |
| Olive oil | 0 | 0 | 1 | 0 | 1 | 0.0 |
| Sunflower seed oil | 0 | 0 | 0 | 0 | 0 | 0.0 |
| Oleaginosas | ||||||
| Hazelnuts | 14.95 | 290 | 680 | 163 | 114 | −1.9 |
| Peanuts | 25.8 | 376 | 705 | 168 | 92 | 6.2 |
| Pistaches | 20.16 | 490 | 1025 | 121 | 105 | 2.0 |
| Almonds | 20.96 | 471 | 713 | 279 | 268 | 2.0 |
| Nuts | 24.06 | 513 | 523 | 201 | 61 | 13.8 |
| Products of animal origin | ||||||
| Cod | 22.86 | 521 | 427 | 38 | 52 | 19.8 |
| Mussels | 23.8 | 285 | 268 | 37 | 33 | 15.2 |
| Salmon | 26.48 | 305 | 436 | 36 | 11 | 14.0 |
| Sardines in oil | 24.62 | 490 | 397 | 39 | 382 | 15.9 |
| Prawns | 23.98 | 237 | 259 | 39 | 70 | 13.2 |
| Beef | 25.25 | 179 | 271 | 19 | 23 | 12.5 |
| Chicken meat | 29.8 | 214 | 245 | 27 | 14 | 16.5 |
| Pork sausage | 15.27 | 130 | 283 | 15 | 12 | 5.8 |
| Pork Meat | 26.83 | 263 | 352 | 22 | 14 | 14.7 |
| Whole egg | 13.61 | 215 | 152 | 13 | 162 | 9.0 |
| Egg white | 10.9 | 15 | 163 | 11 | 7 | 2.1 |
| Yolk | 15.86 | 390 | 109 | 5 | 129 | 18.1 |
| Cereals and legumes | ||||||
| Integral rice | 2.74 | 103 | 86 | 39 | 3 | 2.3 |
| White rice | 2.69 | 43 | 35 | 12 | 10 | 1.7 |
| White spaghetti | 0.66 | 14 | 117 | 11 | 21 | −2.2 |
| Potatoes | 2.1 | 75 | 544 | 27 | 10 | −8.5 |
| Corn tortilla | 6.6 | 232.5 | 152.4 | 66 | 161.7 | 4.8 |
| Flour tortilla | 9.66 | 210 | 100 | 21 | 205 | 7.2 |
| Beans | 9.31 | 100 | 646 | 54 | 52 | −7.4 |
| Lentils | 9.02 | 180 | 369 | 36 | 19 | 2.1 |
| Chickpea | 8.86 | 168 | 291 | 48 | 49 | 2.6 |
| Soy | 12.35 | 158 | 539 | 60 | 145 | −2.9 |
| Bean | 7.6 | 125 | 268 | 43 | 36 | 1.1 |
| Dairy products | ||||||
| Cream | 2.44 | 76 | 125 | 10 | 101 | −0.2 |
| Cottage cheese | 11.12 | 159 | 104 | 8 | 83 | 7.9 |
| Fresh cheese | 18.09 | 385 | 129 | 24 | 566 | 12.4 |
| Gouda | 24.94 | 546 | 121 | 29 | 700 | 20.0 |
| Parmesan | 28.42 | 627 | 180 | 34 | 853 | 21.4 |
| Whole milk | 3.15 | 84 | 132 | 10 | 113 | 0.2 |
| Skim milk | 3.37 | 101 | 156 | 11 | 122 | 0.2 |
| Greek Yogurt | 10.19 | 135 | 141 | 11 | 110 | 5.3 |
| Vegetables | ||||||
| Asparagus | 2.4 | 54 | 224 | 14 | 23 | −2.2 |
| Broccoli | 2.38 | 67 | 293 | 21 | 40 | −3.6 |
| Raw carrot | 0.93 | 35 | 320 | 12 | 33 | −5.7 |
| Cauliflower | 1.84 | 32 | 142 | 9 | 16 | −1.3 |
| Celery | 0.69 | 24 | 260 | 11 | 40 | −5.0 |
| Cucumber | 0.65 | 24 | 147 | 13 | 16 | −2.4 |
| Eggplant | 0.83 | 15 | 123 | 11 | 6 | −2.0 |
| Raw spinach | 2.86 | 49 | 558 | 79 | 99 | −11.8 |
| Tomato | 0.88 | 24 | 237 | 11 | 10 | −4.1 |
| Kale | 2.92 | 55 | 348 | 33 | 254 | −8.0 |
| Lettuce | 1.23 | 30 | 247 | 14 | 33 | −4.3 |
| Mushrooms | 2.5 | 120 | 448 | 9 | 18 | −4.2 |
| Onions | 1.1 | 29 | 146 | 10 | 23 | −2.0 |
| Quelites | 1.49 | 37 | 488 | 67 | 78 | −10.9 |
| Fruits | ||||||
| Apple | 0.26 | 11 | 107 | 5 | 6 | −1.9 |
| Banana | 1.09 | 22 | 358 | 27 | 5 | −6.9 |
| Grapes | 0.72 | 20 | 191 | 7 | 10 | −3.2 |
| Kiwi | 1.14 | 34 | 312 | 17 | 34 | −5.6 |
| Lemon | 1.1 | 16 | 138 | 8 | 26 | −2.3 |
| Mango | 0.82 | 14 | 168 | 10 | 11 | −3.0 |
| Orange | 0.94 | 14 | 181 | 10 | 40 | −3.6 |
| Strawberries | 0.67 | 24 | 153 | 13 | 16 | −2.5 |
| Watermelon | 0.61 | 11 | 112 | 10 | 7 | −2.0 |
| Cherry | 0.4 | 11 | 146 | 18 | 12 | −3.1 |
Based on USDA Food Composition Databases, EU.
The evidence available of NEAP estimated and PRAL suggests a direct relationship with the development of metabolic complications, including an increase in muscle catabolism mediated by a decrease in insulin sensitivity, also decreasing muscle anabolism. These changes increase the loss of muscle mass in the elderly, and may influence the development of frailty and its complications.17,19,20
Diets with high acid load are associated with an increase in bone resorption, causing a decrease in bone density, however, the results of the studies are controversial, and authors used different indicators of acid load (urinary PRAL, PRAL in diet and estimated NEAP).28–31
Hypercortisolism and IR are risk factors for the development of HTN. In normotensive individuals there is a positive relationship between PRAL and NEAP with the values of systolic blood pressure.33,36,38,39 However the effect PRAL and NEAP on the incidence of HTN is controversial.37
Low-grade MA caused by diets with elevated PRAL and increased NEAP estimulate cortisol production, which causes IR through various mechanisms,42 and increases the risk of long-term DM2,44,45,48 In pregnant women, elevated PRAL and increased NEAP increases the risk of gestational diabetes mellitus (GDM) as reported in a case-control study.43
Diets with elevated PRAL and elevated NEAP could contribute to the development of nonalcoholic fatty liver, which may be explained by the increased release of fatty acids due to IR. Only 2 studies have evaluated this association with inconclusive results50,51
DM2 and HTN are main causes of CKD. Independently, the short and long term consumption of high acid load diets seems to have a negative impact on renal health by producing hyperfiltration to increase the excretion of acids.52 If maintained hyperfiltration favors the development of renal fibrosis and CKD53,55,56 with accelerated progression to ESRD.57 Renal lithiasis is another complication of low-grade MA, as the excretion of phosphorus and calcium in urine is increased, favoring the tubular reabsorption of citrate with a reduction in citrate excretion with the consequent change in urinary pH. These changes in urinary composition and pH increase the formation of calcium-oxalate and calcium-phosphate complexes, increasing the risk of kidney stones.62,63
The DM2, HTN and CKD increase cardiovascular risk and Acid load of the diet is a determinant of the three conditions. High PRAL and NEAP is associated with increased incidence of cardiovascular disease64 and high mortality rates both general and cardiovascular.67 However, regarding mortality, Huston et al. did not observe an association between acid load and greater risk of mortality.66
There is enough information regarding the long-term effects of diets with high acid load; however the publications on the impact of diet with low acid load or alkaline residue are scarce. The body's metabolic processes generate a significant load of hydrogen and there is always an active ventilatory compensation of blood pH; the alkaline intake through the diet does not seem to represent a mechanism to maintain alkalosis or any metabolic complication.
Some authors have suggested the implementation of vegetarian diets as a strategy to reduce metabolic acidosis. It is important to note that not only red meats or products of animal origin are the determinants of the acid load of the diet. It should be consider that these foods may be an important source of essential amino acids as described by Mafra et al.77 This type of vegetarian diets need professional supervision since it may compromise the intake of essential amino acids causing other pathologies and may affect protein anabolism.
ConclusionsAccording to the literature, the type of diet can profoundly affect the organism by providing acid precursors or bases. Diets with high acid load produces changes in the acid base balance. There is an association between low-grade metabolic acidosis with the development of chronic noncommunicable diseases. The implementation of strategies aiming to reduce the acid load of the diet through nutritional interventions may have a positive impact on health.
Keypoints- •
The micronutrient profile of the diet determines the production of acid and base precursors in the organism having an impact in the acid base balance.
- •
The net production of acid may be estimated from the acid load of the diet using mathematical models that includes the consumption of calcium, magnesium, protein, phosphorus and potassium in the regular diet.
- •
The consumption of diets with positive acid loads causes low-grade metabolic acidosis, which has been associated with the development of chronic diseases, such as diabetes, hypertension, chronic kidney disease, renal lithiasis and non-alcoholic fatty liver, among other.
No conflicts to declare.
The following are the supplementary data to this article:

Please cite this article as: Osuna-Padilla IA, Leal-Escobar G, Garza-García CA, Rodríguez-Castellanos FE. Carga ácida de la dieta; mecanismos y evidencia de sus repercusiones en la salud. Nefrologia. 2019;39:343–354.