

Online haemodiafiltration (OL-HDF) with high convective transport volumes improves patient survival in haemodialysis. Limiting the amount of convective volume has been proposed in patients with diabetes mellitus due to glucose load that is administered with replacement fluid. The objective of the study was to analyze the influence of substitution volume on the evolution of the metabolic profile and body composition of incident diabetic patients on OL-HDF.
Material and methodsProspective observational study in 29 incident diabetic patients on postdilution OL-HDF. Baseline data included clinical and demographic data, laboratory parameters (metabolic, nutritional and inflammatory profile) and body composition with bioimpedance spectroscopy (BIS). Laboratory parameters and mean substitution volume per session were collected every 4 months, and in 23 patients a further BIS was performed after a minimum of one year. Variations in glycosylated hemoglobin (HbA1c), triglycerides, total cholesterol, LDL-c, HDL-c, albumin, prealbumin and C reactive protein (CRP) were calculated at one year, 2 years, 3 years, and at the end of follow-up. Quarterly and annual variations were calculated as independent periods, and changes in body composition were analyzed.
ResultsAge at baseline was 69.7±13.6 years, 62.1% were male, 72.3±13.9kg, 1.78±0.16m2, with 48 (35.5–76) months on dialysis. Approximately 81.5% received insulin, 7.4% antidiabetic drugs and 51.9% statins. Mean substitution volume was 26.9±2.9L/session and follow-up period (time on OL-HDF) was 40.4±26 months.
A significant correlation was observed between mean substitution volume and the increase in HDL-c (r=0.385, p=0.039) and prealbumin levels (r=0.404, p=0.003) throughout follow-up. Moreover, substitution volume was correlated with a reduction in CRP levels at one year (r=−0.531, p=0.005), 2 years (r=−0.463, p=0.046), and at the end of follow-up (r=−0.498, p=0.007). Patients with mean substitution volume >26.9L/session had a higher reduction in triglycerides and CRP, and an increase in HDL-c levels. These patients with >26.9L/session finished the study with higher HDL-c (48.1±9.4mg/dL vs. 41.2±11.6mg/dL, p=0.025) and lower CRP levels (0.21 [0.1–2.22]mg/dL vs. 1.01 [0.15–6.96]mg/dL, p=0.001), with no differences at baseline.
Quarterly comparisons between substitution volume and laboratory changes [n=271] showed a significant correlation with a reduction in HbA1c (r=−0.146, p=0.021). Similar findings were obtained with annual comparisons [n=72] (r=−0.237, p=0.045). An annual mean substitution volume over 26.6L/session (29.3±1.7L/session vs. 23.9±1.9L/session) was associated with a reduction in HbA1c (−0.51±1.24% vs. 0.01±0.88%, p=0.043). No correlation was observed between substitution volume and changes in weight, body mass index or BIS parameters.
ConclusionThere is not enough evidence to restrict convective transport in diabetic patients on OL-HDF due to the glucose content of the replacement fluid.
La hemodiafiltración online (HDF-OL) con altos volúmenes de transporte convectivo mejora la supervivencia en los pacientes en hemodiálisis. Se ha propuesto limitar el volumen convectivo en los pacientes diabéticos por la carga de glucosa administrada con el líquido de sustitución. El objetivo del estudio fue analizar la influencia del volumen de sustitución en la evolución del perfil metabólico y la composición corporal de los pacientes diabéticos incidentes en HDF-OL.
Material y métodosEstudio observacional prospectivo en 29 pacientes diabéticos incidentes en HDF-OL posdilución. Basalmente se recogieron datos clínicos y demográficos, parámetros analíticos metabólicos, nutricionales e inflamatorios, y la composición corporal por bioimpedancia espectroscópica (BIS). Cada 4 meses se recogieron parámetros analíticos y el volumen de sustitución medio por sesión, y en 23 pacientes se realizó otra BIS al menos un año después. Se calcularon variaciones de hemoglobina glucosilada (HbA1c), triglicéridos, colesterol total, c-LDL, c-HDL, albúmina, prealbúmina y proteína C reactiva (PCR) al año, 2 años, 3 años y al final del seguimiento. Se calcularon las variaciones cuatrimestrales y anuales como periodos independientes, y se analizaron los cambios de composición corporal.
ResultadosLa edad al inicio fue a los 69,7±13,6 años; el 62,1% eran varones, de 72,3±13,9kg, 1,78±0,16m2, y con 48 (35,5-76) meses en diálisis. El 81,5% recibía insulinoterapia, el 7,4% antidiabéticos y el 51,9% estatinas. El volumen de sustitución medio fue de 26,9±2,9L/sesión y el periodo de seguimiento (tiempo en HDF-OL) fue de 40,4±26 meses.
Se observó una correlación significativa entre el volumen de sustitución medio y un incremento de los niveles de c-HDL (r=0,385, p=0,039) y prealbúmina (r=0,404, p=0,003) a lo largo del seguimiento. El volumen convectivo se asoció a la reducción de los niveles de PCR al año (r=−0,531, p=0,005), a los 2 años (r=−0,463, p=0,046) y al final del seguimiento (r=−0,498, p=0,007). Los pacientes con volumen de sustitución >26,9L/sesión tuvieron mayor descenso en los niveles de triglicéridos y PCR, y un aumento de las cifras de c-HDL. Estos pacientes con >26,9L/sesión finalizaron el estudio con niveles más altos de c-HDL (48,1±9,4mg/dL vs. 41,2±11,6mg/dL, p=0,025) y más bajos de PCR (0,21 [0,1-2,22]mg/dL vs. 1,01 [0,15-6,96]mg/dL, p=0,001), sin diferencias al inicio.
Las comparaciones entre el volumen de sustitución y los cambios analíticos por periodos cuatrimestrales [n=271] mostraron una correlación significativa con un descenso de HbA1c (r=−0,146, p=0,021), al igual que las comparaciones por periodos anuales [n=72] (r=−0,237, p=0,045). Un volumen de sustitución medio anual >26,6L/sesión (29,3±1,7L/sesión vs. 23,9±1,9L/sesión) se asoció a un descenso de HbA1c (−0,51±1,24% vs. 0,01±0,88%, p=0,043). No se observó correlación entre el volumen de sustitución y las variaciones en el peso, IMC o parámetros de la BIS.
Conclusión No existe suficiente evidencia para limitar el transporte convectivo en los pacientes diabéticos en HDF-OL por el contenido de glucosa del líquido de sustitución.
In recent years, the development of convective techniques has contributed to numerous benefits in patients with advanced chronic kidney disease (ACKD) in hemodialysis.1,2 Post-dilution online hemodiafiltration (OL-HDF) is considered the most effective technique since it combines high clearances by diffusion with high convective transport.3 The use of new dialyzers, the online manufacture of the dialysis fluid or the monitors and biocontrol that optimize the rate of substitution have improved performance and increase the convective transport in patients on HDF-OL.
The amount of convective transport seems to determine the accomplishment benefits; most techniques of hemofiltration or hemodiafiltration with lower convective volumes, do not show an increase in survival as compared to high-flux hemodialysis. The OL-HDF with substitution volumes >23L per session, >69L per week or >23L/1.73m2 per session results in a reduction of mortality,4–6 mainly cardiovascular.7,8 Although none of the studies were designed to evaluate a “convective-dependent” effect, it seems that the greater the convection dose the more remarkable the benefits obtained.9
It has been hypothesized that the glucose content of the substitution fluid may be excessive causing an extra load of glucose to the patient during the treatment. This would limit the volume of substitution in patients with intolerance to carbohydrates or diabetes mellitus.10,11 So far, there is no data on whether glucose infused with convective techniques impairs metabolic control or worsens cardiovascular risk in these patients. In fact, after incorporation of convective transport with high-flux membranes the first beneficial effects were observed in diabetic patients12 and studies of OL-HDF showed that improvement in survival and in reduction of cardiovascular mortality is independent of the subgroups of patients evaluated.5,13
The objective of this study was to analyze the influence of the volume of substitution on the metabolic profile and body composition in diabetic patients since they were started on HDF-OL.
MethodsDesign. This is a prospective observational study in diabetic patients starting on postdilution OL-HDF followed since the initiation of treatment until the end of the year 2016.
Inclusion criteria. Patients were older than 18 years, with advanced CKD on renal replacement therapy, diagnosed of diabetes mellitus before starting OL-HDF, and with an OL-HDF regimen of 3 weekly sessions of 4h each.
A total of 29 patients were included in the study: 11 patients started on OL-HDF as their first dialysis technique after a period of 4 weeks of adaptation in high-flux hemodialysis; 17 patients were changed to OL-HDF from high-flow hemodialysis and one was switched from peritoneal dialysis. All patients signed an informed consent. The study conforms with the principles of the last Helsinki Declaration.
Variables: Baseline clinical and demographic data were collected including insulin treatment, antidiabetic and/or lipid-lowering drugs. Metabolic, nutritional and inflammatory laboratory parameters (glycosylated hemoglobin [HbA1c], triglycerides, total cholesterol, LDL-c, HDL-c, albumin, prealbumin and C-reactive protein [CRP]), anthropometric measurements and body composition by bio-impedance spectroscopy (BIS) were also recorded.
In each OL-HDF session the volume of substitution and the convective volume (replacement plus ultrafiltration) were collected and the average volumes per session were calculated every 4 months. The volume of substitution was adjusted to the body surface to standardize the convection dose.
Laboratory parameters and anthropometric measurements were collected every 4 months. In 23 patients, another body composition analysis was performed after at least one year of follow-up.
The monitors used were: 4008 (FMC®), 5008 (FMC®), AK200U (Baxter®), Artis (Baxter®), DBB-07 and DBB-EXA (Nikkiso®) and high permeability dialyzers FX80 (FMC®), FX1000 (FMC®), Polyflux-210H (Baxter®), Elisio-21H (Nipro®) and a case of Sureflux-21H cellulose triacetate (Nipro®) due to hypersensitivity to helixone membranes. The prescription of the volume of substitution was heterogeneous (depending on the fraction of filtration, a volume objective, pressure controls or other automated controls of the rate of substitution) and it was changed throughout the follow-up, aiming of achieving the highest volume of blood processed and the largest possible replacement volume. The glucose concentration in the substitution fluid was 100mg/dL.
The blood samples were extracted before the second session of the week, after an interdialysis period of 44h. The BIS was also measured before the second session of HDF of the week using the BCM monitor (Body Composition Monitor®, FMC); the measurement was performed after a period of 5min rest in supine decubitus.14
Changes in of analytical parameters were obtained at year 1, 2, 3 and at the end of the follow-up. Quarterly and at yearly variations were calculated as independent periods. Variations of body composition between the determinations were also calculated.
The SPSS 20.0 program for Mac was used for statistical analysis. Qualitative variables are expressed as frequencies and/or percentages. The distribution of the quantitative variables was verified by the Kolmogorov–Smirnoff normality test. Quantitative variables with normal distribution are expressed as mean±standard deviation, and quantitative variables with non-normal distribution are expressed as median and interquartile range. Changes in the variables were analyzed as absolute changes, relative (%), and relative to elapsed period of time. The association between variables was evaluated using nonparametric tests (Spearman, Wilcoxon, Kruskal–Wallis, Fisher test) due to the small sample size. We used the multivariate linear regression model enter to evaluate the independent association of variables variations with time. A value of p <0.05 with a confidence interval of 95% was considered significant.
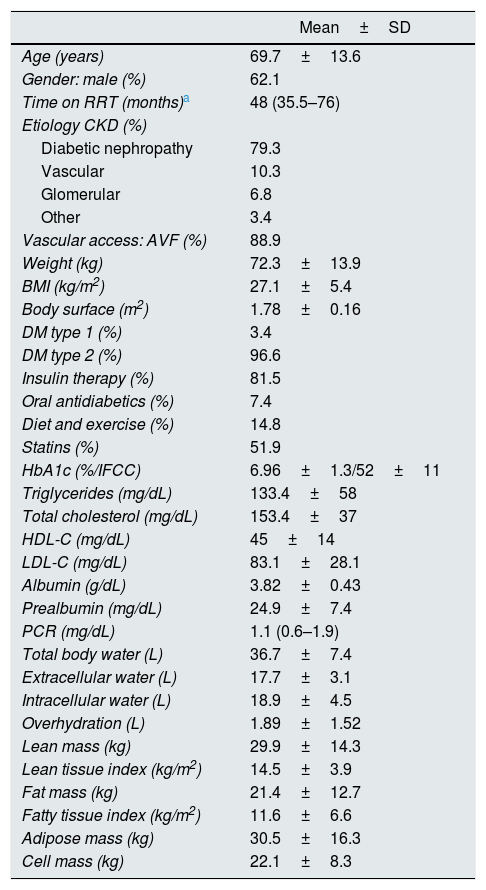
ResultsThe baseline clinical, anthropometric, laboratory and BIS data is shown in Table 1. The follow-up period (time on OL-HDF) was 40.4±26 months (range 12–101; median [ICR]: 35 [19.5–63] months). At the end of the study, 16 patients continued on OL-HDF, 2 changed to high-flow hemodialysis, 2 received a kidney transplant, and 9 (31%) had died.
Clinical, anthropometric, laboratory and bioimpedance data at the beginning of the study.
| Mean±SD | |
|---|---|
| Age (years) | 69.7±13.6 |
| Gender: male (%) | 62.1 |
| Time on RRT (months)a | 48 (35.5–76) |
| Etiology CKD (%) | |
| Diabetic nephropathy | 79.3 |
| Vascular | 10.3 |
| Glomerular | 6.8 |
| Other | 3.4 |
| Vascular access: AVF (%) | 88.9 |
| Weight (kg) | 72.3±13.9 |
| BMI (kg/m2) | 27.1±5.4 |
| Body surface (m2) | 1.78±0.16 |
| DM type 1 (%) | 3.4 |
| DM type 2 (%) | 96.6 |
| Insulin therapy (%) | 81.5 |
| Oral antidiabetics (%) | 7.4 |
| Diet and exercise (%) | 14.8 |
| Statins (%) | 51.9 |
| HbA1c (%/IFCC) | 6.96±1.3/52±11 |
| Triglycerides (mg/dL) | 133.4±58 |
| Total cholesterol (mg/dL) | 153.4±37 |
| HDL-C (mg/dL) | 45±14 |
| LDL-C (mg/dL) | 83.1±28.1 |
| Albumin (g/dL) | 3.82±0.43 |
| Prealbumin (mg/dL) | 24.9±7.4 |
| PCR (mg/dL) | 1.1 (0.6–1.9) |
| Total body water (L) | 36.7±7.4 |
| Extracellular water (L) | 17.7±3.1 |
| Intracellular water (L) | 18.9±4.5 |
| Overhydration (L) | 1.89±1.52 |
| Lean mass (kg) | 29.9±14.3 |
| Lean tissue index (kg/m2) | 14.5±3.9 |
| Fat mass (kg) | 21.4±12.7 |
| Fatty tissue index (kg/m2) | 11.6±6.6 |
| Adipose mass (kg) | 30.5±16.3 |
| Cell mass (kg) | 22.1±8.3 |
c-HDL: cholesterol bound to high density lipoproteins; c-LDL: cholesterol bound to low density lipoproteins; SD: standard deviation; DM: diabetes mellitus; CKD: chronic kidney disease; AVF: arteriovenous fistula; HbA1c: glycosylated hemoglobin; IFCC: International Federation of Clinical Chemistry and Laboratory Medicine; BMI: body mass index; CRP: C-reactive protein; RRT: renal replacement therapy.
The average replacement volume was 26.9±2.9L/session (range 20.5–32.9L) or 26.5±4.2L/1.73m2/session (range 19.5–40.3L/1.73m2/session). There were no significant changes in the volume of substitution throughout the follow-up.
A significant correlation was observed between the mean substitution volume and an increase in HDL-c levels (r=0385, p=0.039) and serum prealbumin concentration (r=0.404, p=0.003) throughout the follow-up. In addition, it was found a significant correlation between the volume of substitution and the reduction of CRP levels after the first year (r=0.531, p=0.005), at year 2 (r=0.463, p=0.046) and at the end of the follow-up (r=−0.498, p=0.007). The volume substituted adjusted to the body surface, correlated significantly with the reduction of triglyceride levels (r=−0.423, p=0.022).
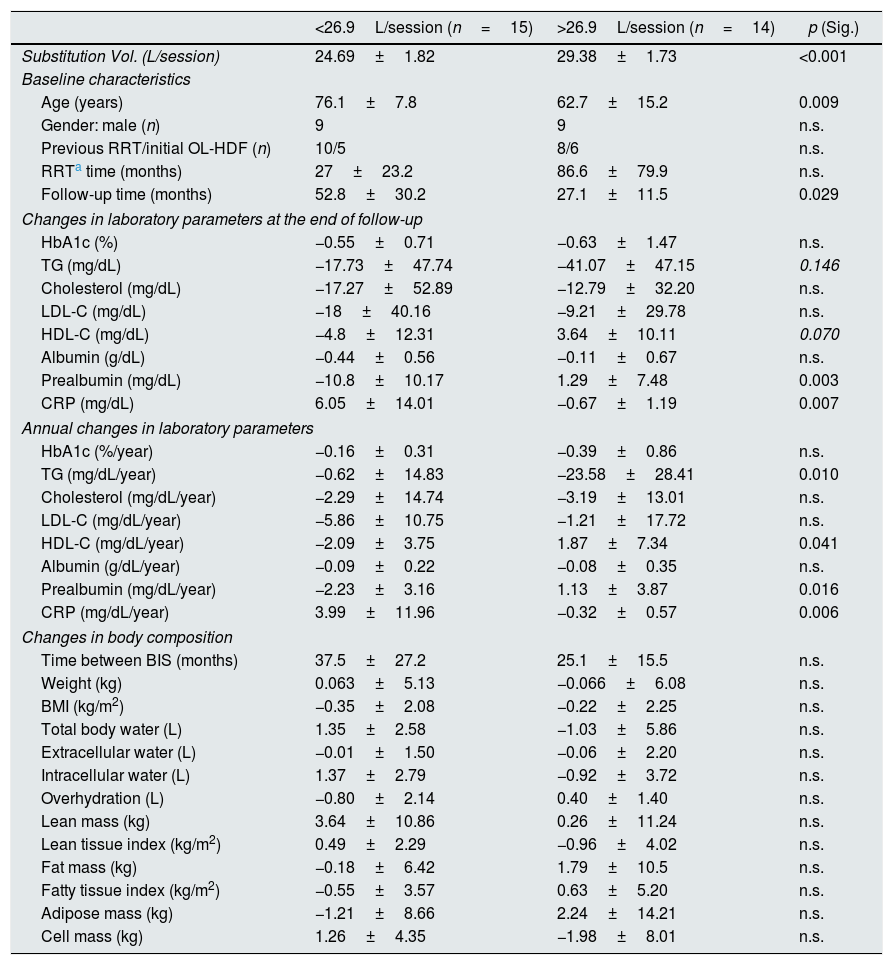
Table 2 shows the changes in laboratory parameters and body composition in patients with a volume of substitution above or below the average. Patients with volume of substitution <26.9L/session were older and had been followed for longer period of time. By contrast patients with a substitution volume >26.9L/session had a greater decrease in triglyceride and CRP levels, and they show an increase in HDL-c levels (Fig. 1).
Differences in the evolution of laboratory parameters and body composition according to the volume of substitution.
| <26.9L/session (n=15) | >26.9L/session (n=14) | p (Sig.) | |
|---|---|---|---|
| Substitution Vol. (L/session) | 24.69±1.82 | 29.38±1.73 | <0.001 |
| Baseline characteristics | |||
| Age (years) | 76.1±7.8 | 62.7±15.2 | 0.009 |
| Gender: male (n) | 9 | 9 | n.s. |
| Previous RRT/initial OL-HDF (n) | 10/5 | 8/6 | n.s. |
| RRTa time (months) | 27±23.2 | 86.6±79.9 | n.s. |
| Follow-up time (months) | 52.8±30.2 | 27.1±11.5 | 0.029 |
| Changes in laboratory parameters at the end of follow-up | |||
| HbA1c (%) | −0.55±0.71 | −0.63±1.47 | n.s. |
| TG (mg/dL) | −17.73±47.74 | −41.07±47.15 | 0.146 |
| Cholesterol (mg/dL) | −17.27±52.89 | −12.79±32.20 | n.s. |
| LDL-C (mg/dL) | −18±40.16 | −9.21±29.78 | n.s. |
| HDL-C (mg/dL) | −4.8±12.31 | 3.64±10.11 | 0.070 |
| Albumin (g/dL) | −0.44±0.56 | −0.11±0.67 | n.s. |
| Prealbumin (mg/dL) | −10.8±10.17 | 1.29±7.48 | 0.003 |
| CRP (mg/dL) | 6.05±14.01 | −0.67±1.19 | 0.007 |
| Annual changes in laboratory parameters | |||
| HbA1c (%/year) | −0.16±0.31 | −0.39±0.86 | n.s. |
| TG (mg/dL/year) | −0.62±14.83 | −23.58±28.41 | 0.010 |
| Cholesterol (mg/dL/year) | −2.29±14.74 | −3.19±13.01 | n.s. |
| LDL-C (mg/dL/year) | −5.86±10.75 | −1.21±17.72 | n.s. |
| HDL-C (mg/dL/year) | −2.09±3.75 | 1.87±7.34 | 0.041 |
| Albumin (g/dL/year) | −0.09±0.22 | −0.08±0.35 | n.s. |
| Prealbumin (mg/dL/year) | −2.23±3.16 | 1.13±3.87 | 0.016 |
| CRP (mg/dL/year) | 3.99±11.96 | −0.32±0.57 | 0.006 |
| Changes in body composition | |||
| Time between BIS (months) | 37.5±27.2 | 25.1±15.5 | n.s. |
| Weight (kg) | 0.063±5.13 | −0.066±6.08 | n.s. |
| BMI (kg/m2) | −0.35±2.08 | −0.22±2.25 | n.s. |
| Total body water (L) | 1.35±2.58 | −1.03±5.86 | n.s. |
| Extracellular water (L) | −0.01±1.50 | −0.06±2.20 | n.s. |
| Intracellular water (L) | 1.37±2.79 | −0.92±3.72 | n.s. |
| Overhydration (L) | −0.80±2.14 | 0.40±1.40 | n.s. |
| Lean mass (kg) | 3.64±10.86 | 0.26±11.24 | n.s. |
| Lean tissue index (kg/m2) | 0.49±2.29 | −0.96±4.02 | n.s. |
| Fat mass (kg) | −0.18±6.42 | 1.79±10.5 | n.s. |
| Fatty tissue index (kg/m2) | −0.55±3.57 | 0.63±5.20 | n.s. |
| Adipose mass (kg) | −1.21±8.66 | 2.24±14.21 | n.s. |
| Cell mass (kg) | 1.26±4.35 | −1.98±8.01 | n.s. |
No significant differences were found in the baseline laboratory parameters or in body composition at the beginning of the study between both groups. Mann–Whitney test and Chi square test/Fisher exact test, p<0.05.
BIS: bioimpedance spectroscopic; c-HDL: cholesterol bound to high density lipoproteins; c-LDL: cholesterol bound to low density lipoproteins; HbA1c: glycosylated hemoglobin; HDF-OL: online hemodiafiltration; BMI: body mass index; n.s.: not significant; CRP: C-reactive protein; TG: triglycerides; RRT: renal replacement therapy.
 and replacement volume adjusted to the body surface (right column).")
Age correlated with a greater decrease in serum albumin per year (r=−0.515, p=0.004) and at the end of the follow-up (r=0.655, p<0.001). Age also correlated with a greater decrease in prealbumin level per year (r=−0.617, p<0.001) and at the end of follow-up (r=−0.673, p<0.001) and, age also correlated negatively with convective volumes (r=−0.516, p<0.004).
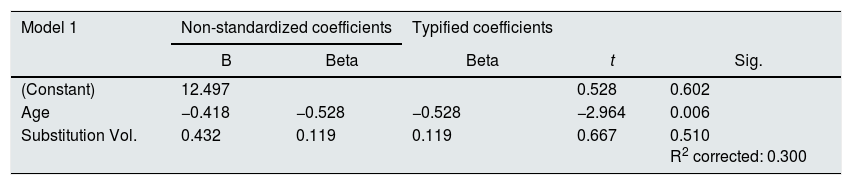
In model 1 of multivariate regression analysis (Table 3), age was the only independent predictor of the reduction of prealbumin throughout the follow-up. In model 2, only the prealbumin levels and weight at the beginning of the study were independently associated with the reduction of prealbumin.
Multivariate linear regression analysis for the variation of prealbumin throughout the follow-up.
| Model 1 | Non-standardized coefficients | Typified coefficients | |||
|---|---|---|---|---|---|
| B | Beta | Beta | t | Sig. | |
| (Constant) | 12.497 | 0.528 | 0.602 | ||
| Age | −0.418 | −0.528 | −0.528 | −2.964 | 0.006 |
| Substitution Vol. | 0.432 | 0.119 | 0.119 | 0.667 | 0.510 R2 corrected: 0.300 |
| Model 2 | Non-standardized coefficients | Typified coefficients | |||
|---|---|---|---|---|---|
| B | Typ. Error | Beta | t | Sig. | |
| (Constant) | 16.007 | 31.911 | 0.502 | 0.624 | |
| Age | −0.221 | 0.166 | −0.248 | −1.335 | 0.205 |
| Gender | −3.600 | 4.535 | −0.157 | −0.794 | 0.442 |
| Follow-up time | −0.087 | 0.086 | −0.208 | −1.023 | 0.325 |
| Vol. Substitution | −0.212 | 0.826 | −0.046 | −0.256 | 0.802 |
| Basal prealbumin | −0.570 | 0.245 | −0.396 | −2.326 | 0.037 |
| Prealbumin 1st year | 0.362 | 0.320 | 0.184 | 1.130 | 0.279 |
| Basal weight | 0.314 | 0.141 | 0.361 | 2.223 | 0.045 R2 corrected: 0.655 |
Independent variables of model 1: age, volume of substitution. Independent variables of model 2: age, gender, time on OL-HDF, volume of substitution, basal prealbumin, variation of prealbumin in the first year, basal weight.
The results of p highlighted in bold are the significant results of the statistical analysis.
There was a significant correlation between volume of substitution and the decrease in HbA1c during quarterly periods [n=271] (r=−0.146, p=0.021). The correlation was maintained at annual periods [n=72] (r=−0.237, p=0.045). A mean annual substitution volume >26.6L/session (29.3±1.7 vs. 23.9±1.9L/session) was associated with a greater decrease in HbA1c (−0.51±1.24% vs. 0.01±0.88%, p=0.043).
No correlation was observed between the volume of substitution and the variations in weight, BMI or BIS parameters.
At baseline there was not a significant correlation between convective volume and laboratory parameters or body composition. Patients with a higher convective volume (mean replacement >26.2L/session) completed the study with higher levels of HDL-c (48.1±9.4 vs. 41.2±11.6mg/dL, p=0.025) and lower CRP levels (0.21 [0.10–2.22] vs. 1.01 [0.15–6.96]mg/dL, p=0.001).
Patients on statins finished the study with lower levels of LDL-C (60.5±29.5 vs. 80.2±27.8mg/dL, p=0.028), however the degree of change was not statistically significant (−21.6±36.6 vs. −4.1±32.1mg/dL, p=0.186). One patient received ezetimibe in addition to atorvastatin.
No patient initiated insulin therapy once the study was started. There were no dose changes or discontinuation of insulin therapy throughout the follow-up.
There were no differences in the metabolic-nutritional profile or in the changes in body composition in patients with and without insulin therapy or oral antidiabetics (linagliptin).
DiscussionThe present study suggests that in OL-HDF with high replacement volumes do not cause a deterioration of the metabolic profile of patients with diabetes mellitus. Even accepting that more glucose is infused during the treatment, still we found that a high convective volumes are associated with an improvement in the metabolic profile.
Glucose balance in post-dilution online hemodiafiltration (OL-HDF)The glucose balance during a session of OL-HDF not only depends on the infused glucose, but it is also conditioned by the transport through the membrane and, fundamentally, by the glycemia. Thus, there is diffusive transport (since it is low molecular weight solute) and there is loss of glucose by convection with ultrafiltration (with a filtration coefficient close to 1 in high permeability membranes),15 of the fluid gained between dialysis and of the excess ultrafiltration being replaced in the venous line (HDF-OL post-dilution).
The most commonly used glucose concentration in the dialysis bath and in the substitution fluid in OL-HDF, is 100–200mg/dL.16,17 Excluding the loss of glucose by ultrafiltration that would occur if there is a negative balance, the glucose transfer will depend on the concentration gradient between the blood and the dialysis fluid (100mg/dL in our case). Patients with glycemia of around 100mg/dL will have a neutral glucose balance (both by diffusion and by ultrafiltration and reinfusion of the liquid); patients with glycemia >100mg/dL will have a negative glucose balance (both by diffusion and by ultrafiltration and reinfusion of fluid with a lower concentration of glucose than plasma) and, therefore, only patients with glycemia <100mg/dL will have a positive glucose balance both by diffusion and by convection. Similarly, glucose losses by eliminating water overload will also be variable depending on the actual blood glucose concentration (loss of 1g/L of UF per 100mg/dL of glycemia).
According to this model, only with glycemia <100mg/dL an increase in the volume of substitution will cause a small increase in the amount of glucose infused (for example, 10g of glucose are infused if the volume of substitution is increased from 25 to 35.6L during a session of OL-HDF), but with a glycemia >100mg/dL the increase in the volume of substitution produces a an increase of glucose elimination by convective transport (since plasma water is ultrafiltered with a higher concentration of glucose than the one infused). These theoretical models do not take into account the variability of glycemia throughout the session, which is modified by the glucose concentrations of the bath and by multiple mechanisms external to the treatment (hormonal, corticoids, catecholamines, intake, etc.).), or the interference between the diffusive and convective transports in the dialyzer.
The hypothesis that a greater infusion may produce an increase in the load of glucose, does not justify the tendency to reduce the volume of substitution given the numerous advantages associated with the high convective transports, but it could suggest the evaluation of different concentrations of glucose in the bath. Some studies in non-diabetic patients on conventional hemodialysis did not observe hemodynamic changes when removing glucose from the fluid,18 and it is rare to develop hypoglycemia using a dialysis fluid without glucose.19 Although the potential use of dialysis fluids at lower concentrations of glucose could modify the glucose balance, both the change in osmolarity and the necessary changes in conductivity should be evaluated (to avoid sudden drops in blood volume); the concentration of potassium in the bath may need to by modified (lower insulin secretion may be accompanied of greater elimination of potassium). Also it should be taken into consideration the long-term consequences of these changes (such as an increase in sodium transfer, or intracellular depletion of potassium and the increase in the risk of arrhythmias).
Evolution of the metabolic profileThere in an improvement of the metabolic profile in patients with higher replacement volumes; this includes a reduction in triglyceride and an increase in c-HDL levels resulting a reduction of the atherogenicity index. However, it should be noted that the degree of correlation between convective volume and the improvement of the metabolic profile, although clinically significant, appears to be modest. It is likely that the changes in the metabolic profile are associated with a lower systemic inflammation observed early after the initiation of the OL-HDF. In older patients the convective volumes are low whereas in younger patients the higher convective transport explains a better evolution of nutritional parameters. The benefits in the lipid and inflammatory profile were unrelated to age.
Despite a greater glucose infusion, patients with high replacement volumes did not have worse glycemic control as reflected by HbA1c levels and neither they have more hypertriglyceridemia. The association between high volumes and a reduction in HbA1c analyzed for periods of time suggests a better metabolic control even with better nutritional parameters and probably higher dietary intake.
These results suggest that high volumes do not cause negative effects in the metabolic control or the body composition of diabetic patients on OL-HDF; thus, the infusion of a small amount of glucose is acceptable if the volume of substitution is increased.
Most studies revealed that pharmacological treatment to control cardiovascular risk factors is not clearly effective in dialysis patients20; however several clinical trials do find an improvement in cardiovascular mortality with OL HDF. In this regard, no clinical trial has shown a clear beneficial effect in the management of dyslipidemia in dialysis patients,21–23 but in our study it was observed that the OL-HDF technique itself could contribute to the improvement of lipid profile in these patients.
As the benefits of OL-HDF and high volumes have been attributed to multiple mechanisms24 (increased clearance of uremic toxins, less inflammation, more hemodynamic stability, lower temperature, etc.), probably the improvement of metabolic control also has a multifactorial origin, and it cannot be ruled out that this improvement is partly responsible for the reduction of cardiovascular risk and mortality. Overall, there is not data to support the use of a of low convective technique in a specific population of dialysis patients, nor to restrict the convective transport in diabetic patients on OL-HDF based on the glucose content of the replacement fluid.
LimitationsThe main limitation of this work is its small sample size for an observational study, data from more patients will be desirable to fully validate the benefits of convective transport in the metabolic profile. Several factors may have influenced the amount of convective volume achieved that depends on the characteristics of the patient (age, body composition, anemia and hemoconcentration, etc.) or the use of different monitors and high permeability dialyzers. Other limitations include the variability of the follow-up period, not enough information about dose changes, withdraw of insulin and lipid-lowering drugs, and the distrustful value of plasma lipid levels or HbA1c levels in dialysis patients.
ConclusionIn conclusion, there is no reason to limit convective transport in diabetic patients on OL-HDF based of the glucose content of the substitution fluid. The OL-HDF with high substitution volumes may result in an improvement in metabolic control in diabetic patients that should benefit the control of cardiovascular risk.
Conflicts of interestThe authors declare that they have no conflicts of interest.
Please cite this article as: Macías N, Abad S, Vega A, Cedeño S, Santos A, Verdalles Ú, et al. Los altos volúmenes convectivos se asocian a la mejoría del perfil metabólico en los pacientes diabéticos en hemodiafiltración online. Nefrologia. 2019;39:168–176.


