Antecedentes: El funcionamiento de las fórmulas para la estimación de tasa de filtrado glomerular (TFG) CKD-EPI y MDRD en pacientes de origen hispano con función renal normal tiene pocos antecedentes y en México requiere validación. Material y métodos: Se incluyeron individuos mexicanos, adultos y previamente sanos. Se recabaron variables clínicas y se determinó el nivel de creatinina sérica para calcular las fórmulas CKD-EPI y MDRD-IDMS. Este resultado fue comparado con el estándar de referencia (TFG medida con Tc99DTPA). Se evaluaron otras variables clínicas que afectaran el funcionamiento de la fórmula CKD-EPI. Resultados: Se incluyeron 97 individuos voluntarios sanos, 55 varones y 42 mujeres; edad promedio 35 años (18 a 73). La creatinina media fue de 0,76 mg/dl (± 0,18). El funcionamiento de CKD-EPI fue significativamente mejor que el de MDRD-IDMS en todas las comparaciones (sesgo, correlación y exactitud). La diferencia entre los sesgos de las fórmulas fue 6,08 ml/min/1,73 m2 (IC 95 % 2,58 a 9,58) (p < 0,001). Las personas con índice de masa corporal (IMC) mayor de 25 kg/m2 presentaron un mejor funcionamiento que el grupo con menor IMC (diferencia de medias 7,39 ml/min/1,73 m2; IC 95 % 1,17 a 13,6; p < 0,02). Ambas fórmulas sobrestimaron la TFG. El IMC se asoció significativamente con el funcionamiento de la fórmula CKD-EPI (β 0,82; IC 95 % 0,085 a 1,56; p = 0,029). Conclusiones: En individuos adultos mexicanos sanos la fórmula CKD-EPI predice mejor la TFGm que la fórmula MDRD-IDMS. El IMC se asocia de manera significativa al funcionamiento de la fórmula CKD-EPI, siendo mejor en aquellos con IMC superior a 25 kg/m2. Ambas fórmulas sobrestiman la TFGm.
Background: The performance of the CKD-EPI and MDRD formulae for estimating glomerular filtration rate (GFR) in patients of Hispanic origin with normal renal function has been poorly explored and requires validation in Mexico. Material and method: We included previously healthy Mexican adults. We obtained clinical variables and determined serum creatinine to calculate the CKD-EPI and MDRD-IDMS formulae. These results were compared with the gold standard (GFR measured by Tc99DTPA). We evaluated other clinical variables that could affect the performance of the CKD-EPI formula. Results: A total of 97 healthy volunteers were included, 55 males and 42 females; the mean age was 35.8 years old (18 to 73). Mean creatinine was 0.76mg/dl (±0.18). CKD-EPI performance was significantly better than MDRD-IDMS in all comparisons (bias, correlation and accuracy). The bias difference between the formulae was 6.08ml/min/1.73m2 (95% CI 2.58 to 9.58) (p<.001). Individuals with a body mass index (BMI) above 25kg/m2 displayed a better performance than the group with a lower BMI (difference of means 7.39ml/min/1.73m2; 95% CI 1.17 to 13.6 p<.02). Both formulae overestimated the GFR. BMI was significantly associated with the performance of the CKD-EPI formula (β 0.82; 95% CI 0.085 to 1.56 p=.029). Conclusions: In healthy Mexican adults, the CKD-EPI formula is a better predictor of the mGFR than the MDRD-IDMS formula. BMI is significantly associated with the performance of the CKD-EPI formula and is better in those with a BMI greater than 25kg/m2. Both formulae overestimate mGFR.
INTRODUCTION
Estimation of the glomerular filtration rate (eGFR) using formulae has become widespread worldwide. By calculating the eGFR, we can classify patients in different chronic kidney disease (CKD) stages and estimate its prevalence in various populations. EGFR is a valid endpoint in clinical trials and in many situations in daily medical practice. Moreover, it provides a prognosis value for mortality or the requirement for renal replacement therapy1.
The main precedent dates back to 1976, when Cockcroft and Gault (CandG) proposed their formula for estimating the glomerular filtration rate2. This, in combination with creatinine clearance in 24-hour urine, was the only alternative used in clinical practice for many years. However, both tests overestimate renal function3. It was not until 1999 when Levey et al. created a new formula derived from the Modification of Diet in Renal Disease Study (MDRD) that factors such as age, race, sex, serum creatinine, blood urea nitrogen and serum albumin were included. This formula performed better than that of CandG4,5.
The limitations in the validity of this formula originate in the population from which it was created, since the vast majority of individuals recruited were white, without diabetes mellitus (DM) and with a GFR of less than 60ml/min/1.73m2. The main bias shown was that the formula does not perform as well as the GFR increases, and as such, the real prevalence of CKD is overestimated6.
For this reason, the same group of researchers created a new formula derived from the CKD-EPI study (Chronic Kidney Disease Epidemiology Collaboration). In this study, 8254 individuals were analysed, of which the data of 5504 (66.6%) were used to create the formula and the 2750 (33.3%) remaining individuals were used for its validation. 71% of individuals included were considered to be at high risk of CKD and 29% had type 2 DM. Moreover, 60% were white and the average age was 47 years old7. Initially, the variables of the MDRD study were taken into account and the following were additionally included: weight, a history of kidney transplantation and type 2 DM. After the analysis, significant variables were as follows: age, sex, race (African American versus white) and standardised serum creatinine, and as such, only these variables were included in the final formula7. In the analysis, we observed that the formula performed similarly to the MDRD formula in the CKD population (defined as a GFR <60ml/min/1.73m2), but better in the population with a GFR >60ml/min/1.73m2.
A fact of great epidemiological importance was that on the basis of the National Health and Nutrition Examination Survey (NHANES III), in which the MDRD formula had found a CKD prevalence of 13% in the United States, this prevalence was reduced to 11% with the CKD-EPI formula. Recently, after a mean follow-up of 14 years after this estimation, it was found that individuals reclassified to higher kidney damage stages with CKD-EPI had greater cardiovascular mortality. Likewise, individuals reclassified to lower kidney damage stages had lower cardiovascular mortality, suggesting that the difference in classification between MDRD and CKD-EPI is due to a better screening of individuals who really have CKD8.
One limitation in the generalisation of these formulae was that they performed better in the group of individuals from which they were obtained. In 2010, on the basis of the different ethnic groups included in the CKD-EPI study, an adjustment formula was proposed for the following race groups: black, Asian, Hispanic and white. For the internal validation, 4014 individuals were taken from European studies and 1022 from Asian studies (Japan and China). The formula with four variables showed an improvement in performance in the Chinese population, while its validity was poor in the Japanese population. There was no significant improvement in the bias of Hispanics, and as such, we can conclude that the two-tiered CKD-EPI formula (African American and white/others) may be reliably used in the United States and Europe, with Hispanics who reside in these regions being included9.
We should highlight certain aspects about the selection of individuals for the ethnic group of Hispanics who live in the United States, which may not be equivalent for the Mexican population. Firstly, Hispanic (Latino) patients were grouped with Native Americans with the justification that they share the same anthropological origin. Another aspect is the average body mass index (BMI) of individuals in this group, which was 31kg/m2, and that 54% had a BMI greater than 30kg/m2.
Another matter examined was the validation of the CKD-EPI formula in individuals at a high risk of progressing to CKD, such as obese individuals, those with type 2 DM and those with a kidney transplant. None of these variables contributed significant changes to the performance of the formula. When it was adjusted for weight, there was a slight improvement in the mean bias in BMI below 20kg/m2 (-3.2 versus 0.1). However, the authors dismissed it because the validation study had a greater amount of individuals with a low BMI than the original. As such, the authors do not recommend the adjustment for any of these variables. The tendency10, even when discreet, to overestimate the GFR in individuals with a BMI of less than 20kg/m2 is striking.
As such, we can conclude that in spite of this formula having demonstrated its validity in a Latino population born or residing in the United States, we cannot necessarily extrapolate the information of these articles to our population native to and living in Mexico.
The objective of this study was to compare the performance of the CKD-EPI and MDRD estimation formulae in a healthy adult Mexican population, taking as a reference standard the measurement of the GFR using Tc99DTPA. A secondary and post-hoc analysis of the variables included was carried out in order to assess their involvement in the performance of the CKD-EPI formula.
MATERIAL AND METHOD
This was a cross-sectional, observational and open study to compare the performance of two GFR estimation formulae: CKD-EPI and MDRD. The gold standard for determining the measured glomerular filtration rate (mGFR) was Tc99DTPA clearance in urine. Tc99DTPA administration began at the end of a hydration period with a loading dose of 150μCi bolus and subsequently a 300μCi 240-minute infusion. After a 60-minute balance period, we started taking samples (urine and blood) every half hour over four periods (we only considered the three last periods at 120, 150 and 180 minutes for calculation of the glomerular filtration rate). The samples were analysed in duplicate in a gamma counter (Packard® COBRA II, EUA), recording the activity of a millimetre of each tube over a minute (counts/ml/min). The urine samples were obtained by spontaneous voiding and blood samples by venepuncture in the arm contralateral to the infusion. Clearance was calculated with the formula UxV/[(P1+P2+P3)/3], with U = counts in a millimetre of urine, V = 240-minute urine volume, and P1, P2 and P3 = counts in plasma at minute 120, 150 and 180, respectively. The GFR was adjusted to 1.73m2 of body surface.
We included adult Mexican individuals (between 18 and 75 years of age) without known comorbidities in the medical history. We excluded those with measured creatinine greater than 1.5mg/dl in previous studies, iodine allergy and pregnancy. Exclusion criteria were: withdrawal of informed consent, incomplete (anthropometric or laboratory) data, presence of comorbidities or serum creatinine greater than 1.5mg/dl in the screening sample. The creatinine measurement used was standardised based on recommended standards11 (kinetic Jaffe method. Syncron System, Beckman Coulter, Ireland). For the MDRD-IDMS estimation formula, we used the previously validated four-variable equation with standardised creatinine12. The protocol was designed in accordance with the Declaration of Helsinki criteria. This study was submitted to and approved by the ethics committee of the Instituto Nacional de Ciencias Médicas y Nutrición Salvador Zubirán (INNSZ), in Mexico City.
We used descriptive statistics in accordance with the variable measurement level. The results are displayed as frequencies and percentages for categorical variables and as means with standard deviation for continuous variables.
On the basis of the parameters most used for validating the performance of GFR estimation formulae, we used the following:
a) Bias = measured GFR – estimated GFR.
b) Bias (%) = (measured GFR – estimated GFR) ÷ measured GFR.
c) Accuracy p(30) = percentage of estimated GFR within 30% of the measured GFR.
d) Pearson correlation (r2).
e) Precision = interquartile range (IQR).
We should stress that the results of the bias with a minus sign refer to an overestimation of the mGFR, while the results with a positive sign refer to an underestimation of the mGFR.
The results were analysed with the paired t-test for bias and bias%, with 95% confidence intervals (95% CI). For the accuracy variable, we used the χ2 test. We considered a P-value of <.05 to be statistically significant.
To analyse variables that affect the performance of the CKD-EPI formula, we used a multiple linear regression, with the bias as a dependent variable. We analysed the significant variables in the subgroups and compared all the determinants of formula performance. We used Microsoft Excel 2010 and STATA version 11 to analyse the data.
RESULTS
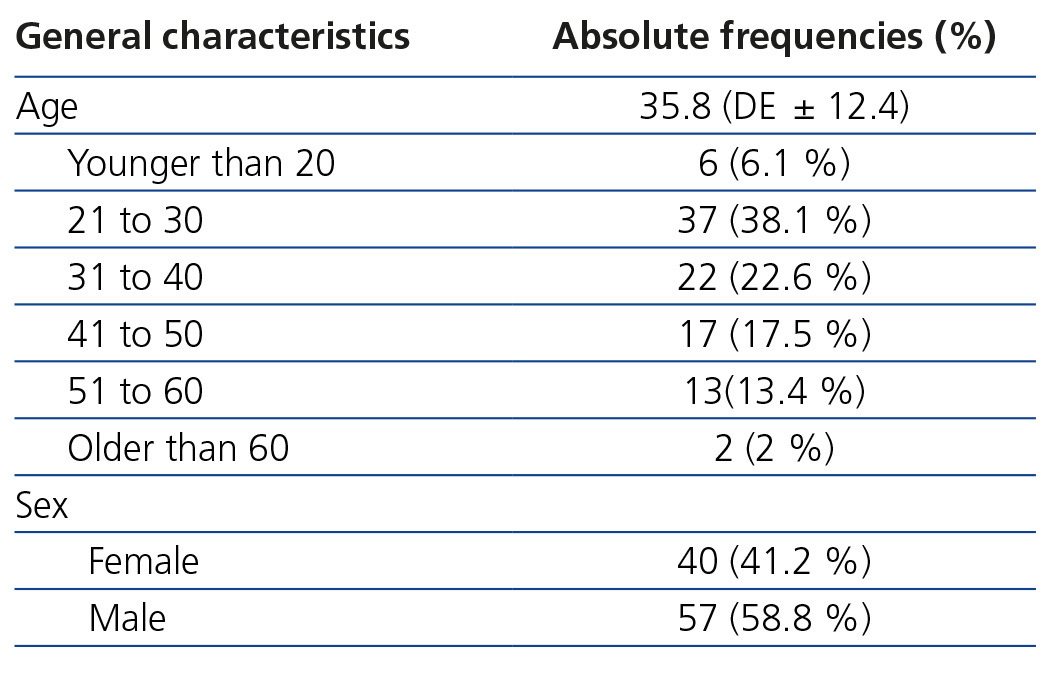
Between April 2010 and June 2011, we recruited 120 healthy individuals, of which only 97 displayed all of the criteria necessary for the final analysis. The main reason for exclusion was incomplete data in the laboratory or of the measurement technique with Tc99DTPA. In 5 individuals, the reason for exclusion was serum creatinine greater than 1.5mg/dl. The main characteristics of the selected patients are shown in Table 1.
The average age was 35.8 years (min-max 18 to 73) and most participants were between 20 and 50 years of age (78.2%). The individuals included were mostly workers of the INNSZ and potential kidney donors.
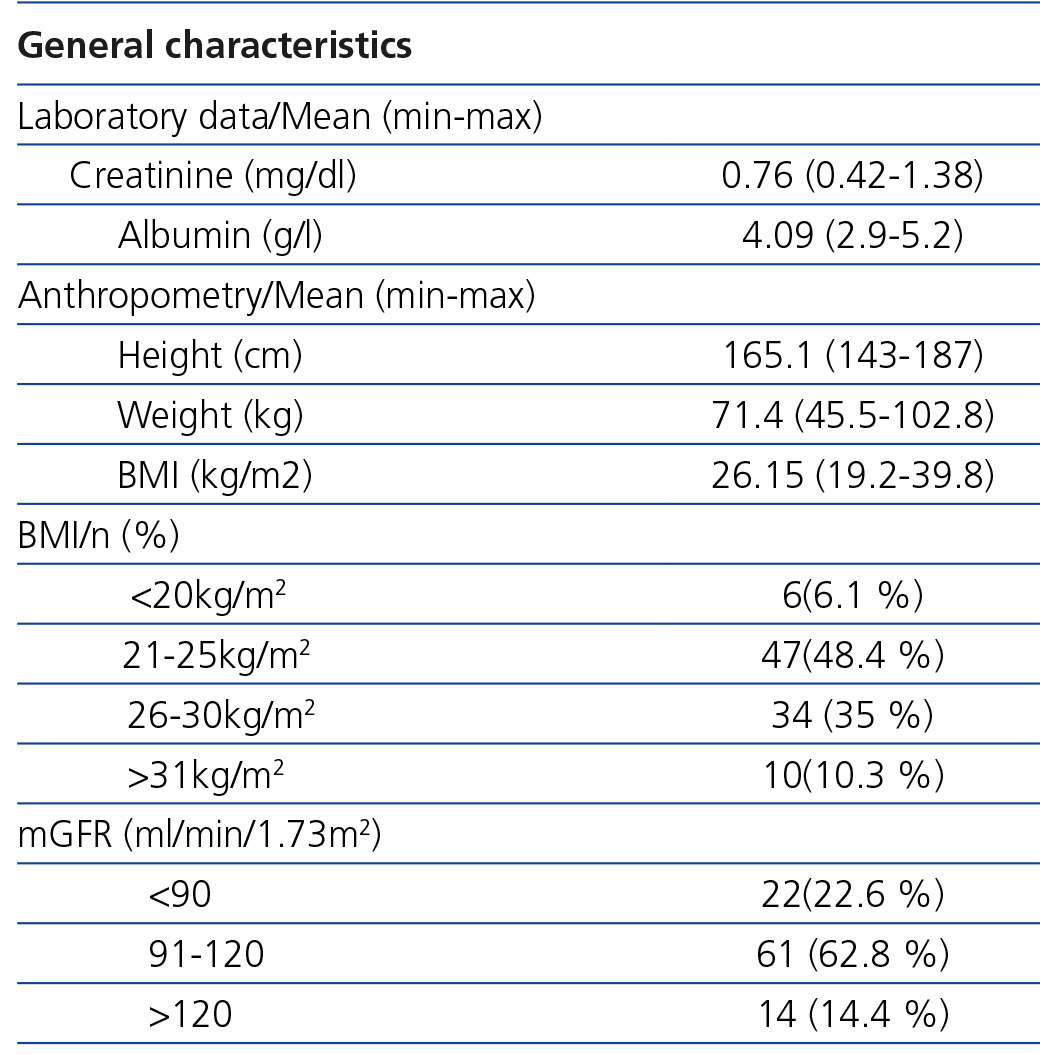
Average creatinine was 0.76mg/dl and 45.3% of individuals were overweight or obese. The rest of the variables and their ranges are expressed in Table 2.
The mean mGFR by Tc99DTPA was 102.7ml/min/1.73m2. 75.1% of individuals had an mGFR greater than 90ml/min/1.73m2.
Performance of the formulae
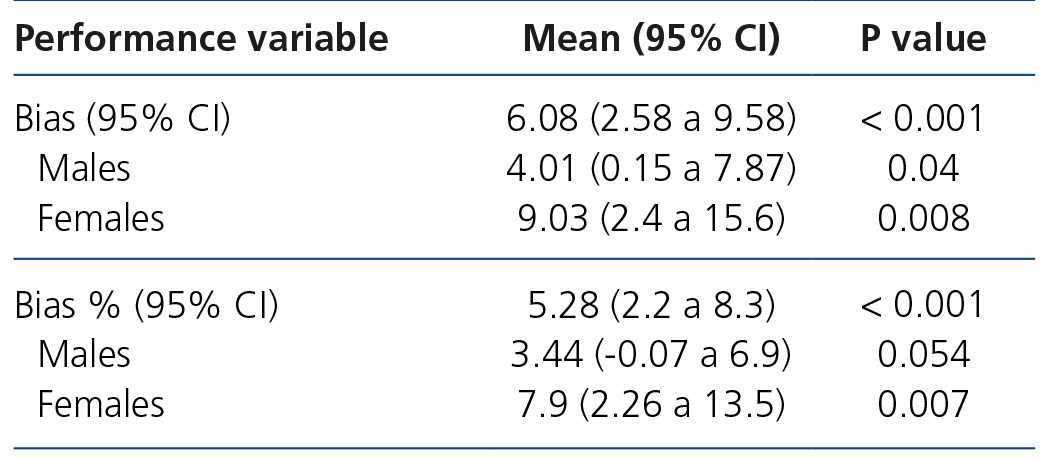
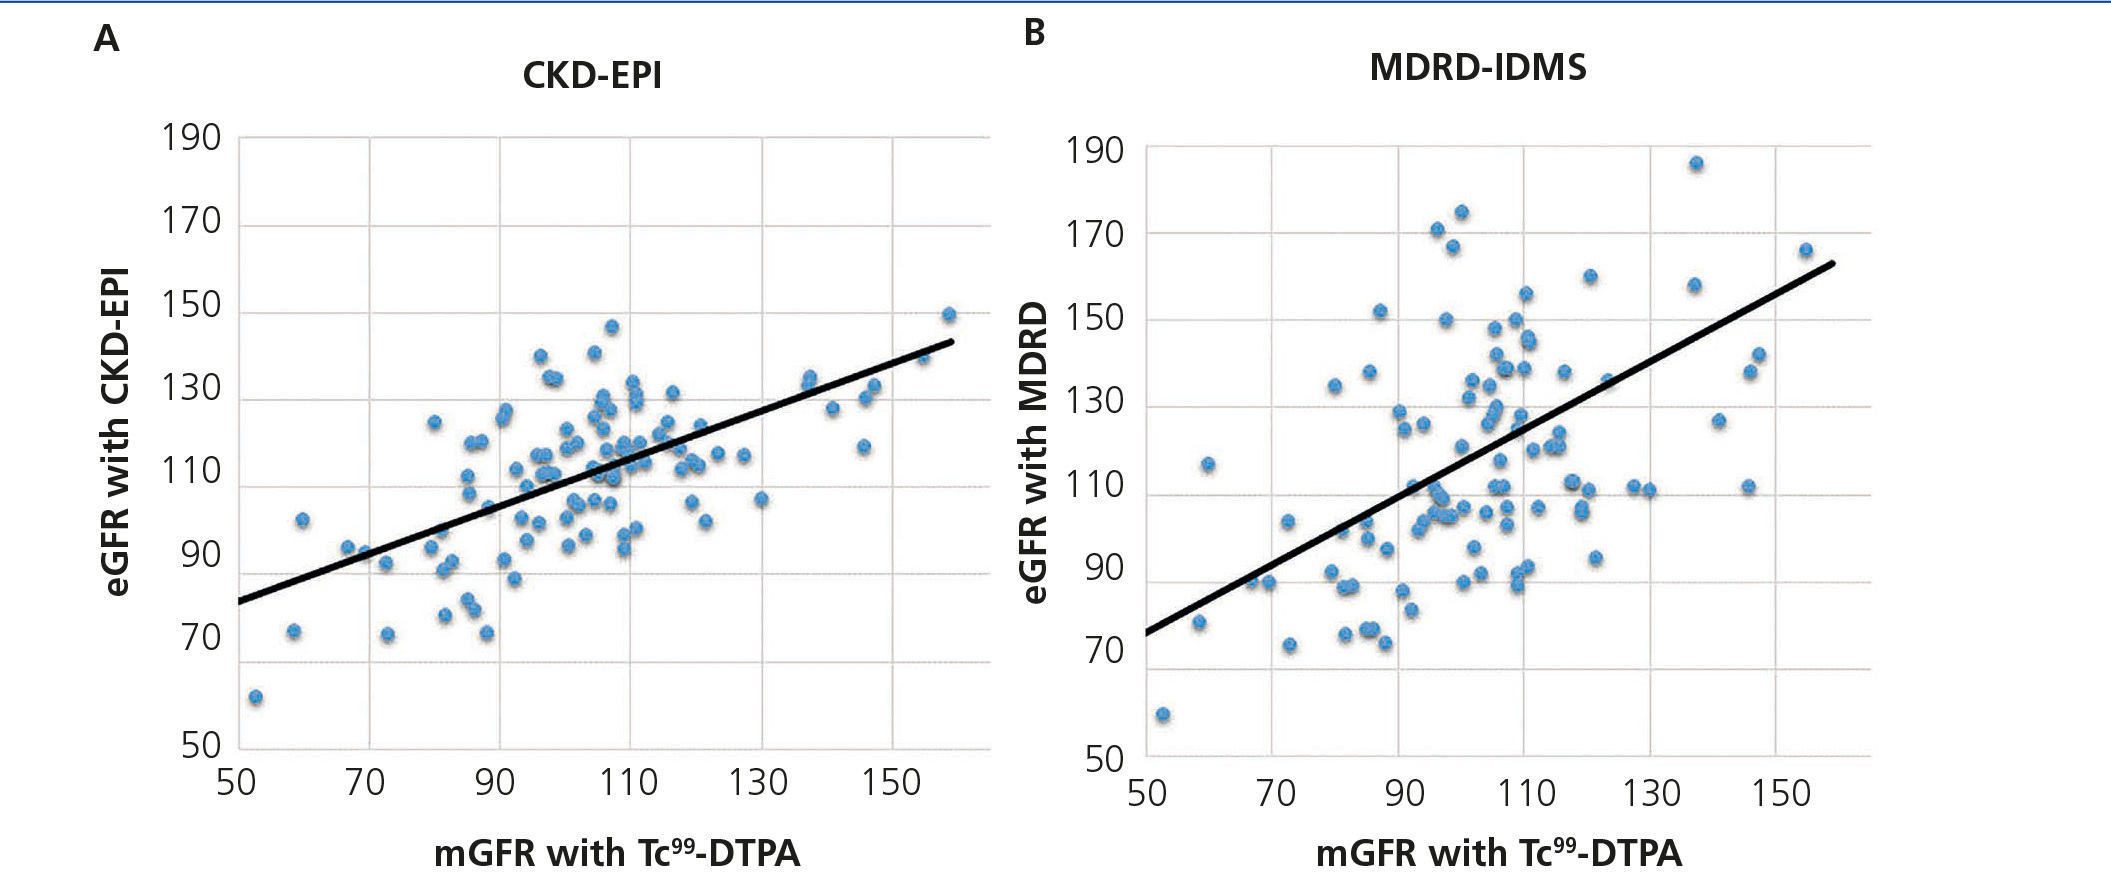
The mean GFR estimated by CKD-EPI was 112.7ml/min/1.73m2, while for MDRD it was 118.8ml/min/1.73m2. In all validation points, CKD-EPI had a better performance than MDRD-IDMS. The bias, defined as mGFR – eGFR, for CKD-EPI was -10.01ml/min/1.73m2, 95% CI (-13.2 to -6.8), and for MDRD -16.1ml/min/1.73m2, 95% CI (-21.4 to -10.7). On comparing the biases of both formulae, the difference was 6.08ml/min/1.73m2, 95% CI (2.58 to 9.58), with statistical significance (p<.001). Likewise, the correlation for CKD-EPI was r=0.65 and for MDRD-IDMS it was r=0.52 (Figure 1). The rest of the performance variables are displayed in Tables 3 and 4. Accuracy, represented as p(30), was also higher for CKD-EPI than for MDRD-IDMS (Figure 2).
Subgroup analysis
Only BMI was significant in the prediction of the performance of the CKD-EPI formula (β 0.82, 95% CI 0.085 to 1.56; p=.029). Neither age nor sex displayed a significant value in the formula performance (Table 5).
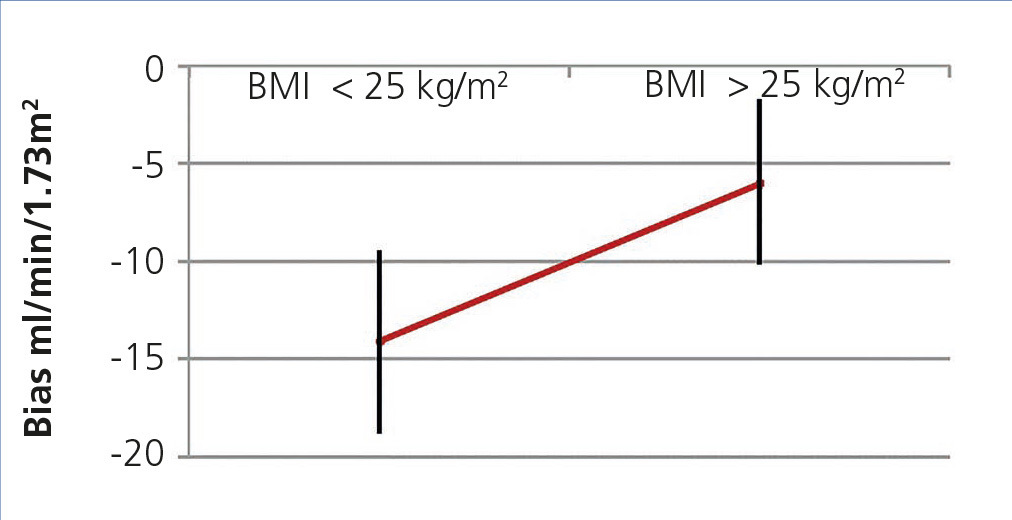
When we divided groups into over and under 25kg/m2, we found a difference in the mean of the statistically significant bias (difference of means 7.39, 95% CI 1.17 to 13.6; P<.02) (Figure 3). When they were divided into BMI subgroups, CKD-EPI performance improved as BMI increased, with there being an r2 value of 0.46 and 0.82 in the under 21kg/m2 and over 30kg/m2 BMI groups, respectively (Table 6).
We also found that this was the case with the MDRD formula, although to a lesser extent. Individuals with a BMI greater than 25kg/m2 had a bias of -12.31, while those with a BMI less than 25 kg/m2 had a bias of -19.9ml/min/1.73 m2.
DISCUSSION
This is the first study that has aimed to compare the performance of the MDRD-IDMS and CKD-EPI formulae in a Mexican population with renal function >60ml/min/1.73m2. The reference standard was measurement of the GFR using Tc99DTPA, which was recently validated in Mexican individuals. In this study, we found a bias of +3ml/min/1.73m2 and r2=0.94, taking insulin clearance as the gold standard13.
The only precedent in relation to the validation of estimation formulae in Hispanic individuals that undoubtedly includes a significant number of individuals from Mexico was the abovementioned trial carried out in the United States for different ethnic groups living in the country. In this study, Native American and Hispanic individuals (from any Latin American country), were grouped together, in which a considerable number were individuals with Mexican parents or ancestors and/or were Mexicans living in the United States. 353 people were studied and the initial characteristics showed that there were 80% who were overweight or obese. Its conclusion with respect to the validity of the CKD-EPI formula was that for the Hispanic population residing in the United States, no adjustment was required for their ethnicity and that the “white and others” CKD-EPI level was that which had to be used reliably9. However, although the ethnicity may be Hispanic, United States residency and the degree of obesity of the sample mean that it may not be possible to extrapolate the results to our country. Furthermore, regardless of racial background, being an emigrant from a Latin American country identifies these individuals as Hispanic. As such, it was necessary to recruit individuals in the country of origin to validate the estimation formulae.
In our study group, in line with the worldwide literature, CKD-EPI performance was statistically better in all validation categories than MDRD, which was to be expected due to the greater heterogeneity of the population in which this formula was created and validated.
When we compared our results with those reported in the original CKD-EPI study, the difference in the performance of the formula was notable. The internal CKD-EPI validation study only reported groups greater than and less than 60ml/min/1.73m2. The bias mean in those of more than 60ml/min/1.73m2 was 3.5 (95% CI from 2.6 to 4.5), which was significantly better than MDRD, which had a bias of 10.6 (9.8 to 11.3), an exceptional difference7 of 7.1ml/min/1.73m2. In the external validation study, levels were reported from 90 to 119 and more than 120ml/min/1.73m2. In these two categories, the performance of the formula continued to be very notable. In the group from 90 to 119ml/min/1.73m2, the CKD-EPI bias was 1.9 (95% CI 0.2 to 4), while for MDRD, it was 10 (95% CI 6.9 to 11.3). In the >120ml/min/1.73m2 level, there was a CKD-EPI bias of -2.9 (-5.1 to -0.1) and a MDRD bias of -8.0 (-9.8 to -2.7)14. These data, when compared with our results, display a CKD-EPI formula performance in our population that is similar to that of MDRD in the United States, and clearly far from the CKD-EPI performance in this population.
A CKD-EPI formula validation study was recently published based on cystatin C by the same team of researchers15. An interesting finding from this study was that in the GFR group greater than 90ml/min/1.73m2, there was an average bias of 11.1 (95% CI 8.0 to 12.5), a precision defined as IQR 25 (21.6 to 28.1) with an accuracy (p30) of 92%. These data are very similar to those that we obtained in our study group, and as such, we believe that the CKD-EPI performance in our population is acceptable.
In a post hoc analysis, on observing the difference between the performance of the formula in our study and the original study, we carried out an analysis in which only BMI was significant in the performance of the CKD-EPI formula. Upon subgroup analysing, all performance categories clearly improved as the BMI increased (Table 6). On dividing them into groups that were greater and less than 25kg/m2, the difference was statistically significant. This is a possible explanation for the performance of the CKD-EPI formula in our study, which, as has already been mentioned, was to be expected because the original validation group included mostly obese individuals of Latino ethnicity (Native Americans and Hispanics)9.
An interesting finding was the tendency of both formulae to overestimate the mGFR, contrarily to the United States and Europe. This phenomenon was also reported in Oriental populations and in South Africa, in which the bias (mGFR – eGFR) was reported as an average of -35ml/min/1.73m2 in the mGFR group greater than9 90ml/min/1.73m2. In our study, this overestimation decreased as the mGFR increased and in the mGFR range above 120ml/min/1.73m2 the sign was inverted and this was the only category in which the GFR was underestimated (average bias + 13.9). These data, although interesting, have a limited value due to the number of individuals. However, they set a CKD-EPI behaviour precedent in different mGFR ranges. If there was similar behaviour in lower mGFR, we would run the risk of underestimating CKD prevalence, which would be very important.
One relative limitation of this study is the number of individuals included, in spite of which the results were solid and significant and allowed validation of these estimation formulae. The second relative limitation is that we cannot know if the use of the formula will in some way impact on CKD detection since this study was not designed for CKD but rather required healthy individuals. Due to the tendency to overestimate the GFR, consistently observed in CKD-EPI and MDRD-IDMS, validation in groups with a lower GFR is essential in subsequent studies in order to avoid underdiagnosis of CKD. A third limitation is recruitment in a single hospital (INNSZ), which, although it receives patients and staff from all over the country, it prevents data obtained being generalised to a certain extent.
CONCLUSIONS
Estimation of GFR by CKD-EPI performed better than the MDRD-IDMS formula in healthy Mexican individuals with normal renal function. This is consistent with that reported in the literature, although to a lesser extent than was originally published. BMI had a significant impact on the performance of the CKD-EPI formula, and was significantly better in individuals with a BMI greater than 25kg/m2. Both formulae overestimated the mGFR, unlike in African Americans and white individuals, but consistent with the behaviour in populations in Japan and South Africa. Due to the epidemiological implications, it is important to carry out a study on lower GFR and take into account the likely impact of BMI.
Conflicts of interest
The authors declare that they have no conflicts of interest related to the contents of this article.
Table 1. General characteristics of the study population
Table 2. Laboratory and anthropometric data
Table 3. Variables of performance of the estimation formulae versus the glomerular filtration rate measured with Tc99DTPA
Table 4. Performance differences (bias and bias %) between CKD-EPI and MDRD-IDMS based on sex
Table 5. Linear regression analysis for the CKD-EPI performance
Table 6. Performance of the CKD-EPI formula in various body mass index levels
Figure 1. Graph of correlation between the glomerular filtration rate measured with Tc99DTPA and the estimation formulae.
Figure 2. Accuracy p(30) of CKD-EPI (A) and MDRD-IDMS (B).
Figure 3. CKD-EPI performance in body mass index greater and less than 25.


