


Cystatin C (CysC) is a renal function marker that is not as influenced as creatinine (Cr) by endogenous or exogenous agents, so it is proposed as a marker in preterm infants.
ObjectivesTo determine serum CysC values in preterm infants during the first week of life, compared to Cr. To analyse alterations caused by prematurity diseases.
MethodThe design involved a longitudinal, observational study of prospective cohorts.
Groups were based on gestational age (GA): Group A (24–27 weeks), Group B (28–33 weeks), Group C (34–36 weeks). Blood samples were collected at birth, within 48–72h and after 7 days of life.
StatisticsSPSS v.20 software was used. The statistical methods applied included chi-squared test and ANOVA.
ResultsA total of 109 preterm infants were included in the study. CysC levels were 1.54mg/l (±0.28) at birth, 1.38mg/l (±0.36) within 48–72h of life, and 1.50mg/l (±0.31) after 7 days (p<0.05). Cr levels were 0.64mg/dl (±0.17) at birth, 0.64mg/dl (±0.28) within 48–72h, and 0.56mg/dl (±0.19) after 7 days (P<.05). CysC values were lower in hypotensive patients and in those with a respiratory disease (P<.05), and no alterations associated with other diseases were observed. There were no differences in Cr levels associated with any disease. Creatinine levels were higher in patients ≤1.500g (P<.05).
ConclusionsSerum CysC decreased within 48–72h of life, and this decline showed significance (P<.05). The levels increased after 7 days in all 3 GA groups, and there was no difference in CysC levels among the groups. More studies in preterm infants with hypotension and respiratory disease are required. CysC is a better glomerular filtration rate (GFR) marker in ≤1.500g preterm infants.
La cistatina C (CisC) es un marcador de función renal no tan influenciado como la creatinina (Cr) por agentes endógenos o exógenos, por lo que se propone como marcador en el pretérmino.
ObjetivosDeterminar valores de CisC sérica en pretérminos en la primera semana de vida, comparándola con la Cr. Analizar modificaciones por patologías de la prematuridad.
MétodoEstudio longitudinal, observacional, de cohortes prospectivo.
Grupos por edad gestacional (EG): grupo A (24–27 semanas), grupo B (28–33 semanas), grupo C (34–36 semanas). Se recogieron muestras de sangre al nacimiento, a las 48–72h y a los 7días.
EstadísticaPrograma SPSS v.20. Métodos estadísticos utilizados χ2 y ANOVA.
ResultadosN=109 pretérminos. CisC al nacimiento: 1,54mg/l (±0,28), a las 48–72h de vida: 1,38mg/l (±0,36), a los 7días: 1,50mg/l (±0,31) (p<0,05). Cr al nacimiento: 0,64mg/dl (±0,17), a las 48–72h: 0,64mg/dl (±0,28), a los 7días: 0,56mg/dl (±0,19) (p<0,05). Valores de CisC más bajos en pacientes con patología respiratoria e hipotensos (p<0,05) sin modificación según patologías restantes. No diferencias en valores de Cr según patología. Valores de creatinina más altos en pacientes ≤500g (p<0,05).
ConclusionesDescenso de CisC sérica a las 48–72h de vida, siendo esta caída en el tiempo significativa (p<0,05), ascenso a los 7días, en los 3 grupos de EG y sin diferencias en valores de CisC entre los grupos. Se requieren más estudios en pretérminos con patología respiratoria y situaciones de hipotensión. En ≤1.500g la CisC es mejor marcador de filtrado glomerular (FG).
The best renal function assessment index is the estimation of glomerular filtration rate (GFR). Procedures for the measurement of such filtrate are based on the renal clearance of exogenous or endogenous molecules. Creatinine is the most commonly used endogenous marker. Given that its production is proportional to the muscular mass of individuals and that it is not only freely filtered by the glomerulus but also secreted by the proximal tubule and, in addition serum Creatinine is not sensitive enough for the identification of early stages of renal damage. Serum Creatinine is not not the most adequate marker for the paediatric population in general and the neonatal population in particular. As an alternative to creatinine, several biological markers have been suggested, cystatin C (Cys C) being the most commonly analysed.
Cys C is a non-glycosylated, low molecular weight (13,343Da), cationic protein, with 120 amino acids and two disulphide bridges. It has a protective function: inhibition of enzymes involved in protein metabolism, collagen catabolism and cellular matrix degradation and possible involvement in defense mechanisms against viral and bacterial infections. This protein is regularly synthesised by most nucleated cells, with a considerable distribution volume in bodily fluids. At the renal level, it is freely filtered by the glomerulus, due to its low molecular weight and positive charge at physiological pH, and it is reabsorbed and catabolised by proximal tubular cells. Under normal conditions, urinary concentration is very low if there is no tubular damage. It is not affected by muscular mass, nutrition status, size, age, gender, serum proteins, bilirubin or drugs, though it may present variations in cases of thyroid dysfunction, tumours or inflammatory diseases. Therefore, authors such as Filler1,2 recommend the use of equations based on Cys C, rather than the Schwartz formula to estimate GFR in children.
GFR is low in foetal and neonatal life. It increases after birth and reaches a maximum of 60ml/min/1.73m2 during the first 3–5 weeks of life in normal-term and premature newborns (NB).3 Approximately 7.36% of NB in our setting are preterm and 1.25% weigh less than 1500g. This population requires a more adequate filtration marker than the current one due to its physiological characteristics: low weight, low body mass index, reduced muscular mass, tendency to early renal failure arising from the prematurity itself, as well as from the added pathology and the use of nephrotoxic drugs.
This study was planned because of the difficulty to identify Cys C reference values in neonates, since these values are defined in a reduced number of preterm newborns and only during the first 3 postnatal days. The conducted study determines said values during the first 7 days after delivery by relating them with gestational age (GA) and serum levels of creatinine.
Objectives- -
To determine values of serum concentration of Cys C, as a renal function marker, in preterm NB during the first week of life in our population upon conducting a comparative study with serum creatinine.
- -
To analyze if the serum concentration of Cys C and creatinine is modified due pathologies related to being premature and/or nephrotoxic drugs.
This is a longitudinal, observational, prospective, cohort study.
It was conducted in the newborn intensive care unit on preterm new born (NB) born in and/or admitted to the Hospital Universitario Virgen Macarena de Sevilla from July 2010 to May 2012. The protocol was approved by the Ethics Committee of our centre. Informed consent was obtained from the neonates’ legal representatives. Preterm newborns were divided into three groups according to the (degree of prematurity) (GA): Group A (24–27 weeks), Group B (28–33 weeks) and Group C (34–36 weeks). The analysed variables were GA, weight, gender, administration of nephrotoxic drugs: antibiotics (cephotaxime, vancomicin, gentamicin), furosemide and ibuprofen IV at different doses based on weight in kg, GA in weeks and days of postnatal life, according to the NeofaxR handbook, 2011 version. There was no pharmacokinetic control of the drugs that could potentially be monitored; there was coexistence of associated respiratory pathologies (transient tachypnea or hyaline membrane of I–IV degree, which increases according to the severity of the radiological pattern), hypoxic ischaemic encephalopathy, acute renal failure (ARF), intraventricular haemorrhage, necrotising enterocolitis, sepsis and severe low blood pressure (blood pressure below the third percentile, according to GA, gender and days of life4). Blood, Cys C and creatinine samples were collected at birth, at 48–72h of life and at 7 days. Blood samples were obtained from arteries, veins or capillaries during the first 7 days after delivery, when routine samples were collected. Serum Cys C was measured through nephelometry (Particle-Enhanced Nephelometric Immuno-Assay) (BNII Siemens) with an ERM-DA471/IFCC60 certification that ensures its standardisation and traceability. Serum creatinine was measured through the Jaffe method using the IDMS (isotope dilution mass spectrometry)-standardised analyser, Cobas 6000 from Roche.
To calculate the intra-assay precision of Cys C and serum creatinine determinations, two different samples were selected: a sample with normal values and a pathological sample, with known concentrations in both cases; and these were entered 21 consecutive times into the corresponding analysers for each technique. As a result, we obtained the intra-assay coefficients of variation (CV) shown below:
Cystatin: at 1mg/l, CV: 2.9%; and at 2.1mg/l, CV: 2.9%.
Creatinine: at 1.8mg/l, CV: 2%; and at 8.5mg/l, CV: 1.2%.
Furthermore, to calculate the intra-assay precision of Cys C and serum creatinine determinations, two samples with known concentrations (once again, a normal sample and a pathological sample) were selected and determined by duplicate analysis during 10 consecutive days in the corresponding analysers for each technique. As a result, we obtained the inter-assay coefficients of variation (CV) shown below:
Cystatin: at 1mg/l, CV 2.6%; and at 2.1mg/l, CV 2.4%.
Creatinine: at 1.8mg/l, CV 3.7%; and at 8.5mg/l, CV 2.8%.
The statistical analysis was performed using the SPSS v.20 software, and the statistical methods used included the x2 method and the variance analysis of repeated measures on one factor. The p<0.05 value was considered statistically significant.
ResultsTotal number of studied preterm newborns (n) was 109; 62 (56.9%) were male individuals and 47 (43.1%) female individuals. There were no differences among GA groups based on gender (p=0.97). Group A had 10 preterm newborns; group B had 50 preterm newborns; and group C had 49 preterm newborns.
Mean GA of the studied population was 32 weeks, range: 24–36 weeks. For Group A it was 26 weeks; range: 24–27 weeks, for Group B 31 weeks; range: 28–33 weeks and Group C 35 weeks; range: 34–36 weeks.
Mean weight of the studied population was 1767g, range: 620–3505g. For Group A it was 911g; range: 620–1210g, for Group B 1612g; range: 845–2435g and for Group C 2099g; range: 1260–3505g.
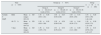
Table 1 shows the values of serum Cys C and creatinine at birth, at 48–72h and at the first week of life, as well as the values in each subgroup of the population. Fig. 1a shows the changes in the values of Cys C in each GA group over time. There is a decrease in the serum concentration of Cys C at 48–72h of life and an increase at 7 days (p<0.05). This decrease over time occurs in the 3 GA groups, and, though the values of Cys C are higher as the GA of preterm newborns increases, there are no differences among groups (p=0.07).
Plasma cystatin C and creatinine values during the first week of life and arranged by gestational age groups.
| Time (p<0.05) | Groups (p=0.07) | Group A+B+C (n=109) | ||||
|---|---|---|---|---|---|---|
| Group A (n=10) (24–27 weeks of GA) | Group B (n=50) (28–33 weeks of GA) | Group C (n=49) (34–36 weeks of GA) | ||||
| Cystatin C (mg/l) | Birth | Mean±SD (range) | 1.44±0.28 (0.91–1.81) | 1.48±0.24 (0.94–2.00) | 1.63±0.31 (0.94–2.56) | 1.54±0.28 (0.91–2.56) |
| 95% CI | 1.49–1.60 | |||||
| 48–72h | Mean±SD (range) | 1.20±0.28 (0.91–1.89) | 1.36±0.28 (0.99–2.40) | 1.44±0.44 (0.20–2.71) | 1.38±0.36 (0.20–2.71) | |
| 95% CI | 1.32–1.48 | |||||
| 7 days | Mean±SD (range) | 1.36±0.22 (1.05–1.74) | 1.51±0.34 (0.76–2.81) | 1.52±0.28 (1.21–2.80) | 1.50±0.31 (0.76–2.81) | |
| 95% CI | 1.47–1.57 | |||||
| Time (p<0.05) | Groups (p=0.11) | Group A+B+C (n=109) | ||||
|---|---|---|---|---|---|---|
| Group A (n=10) (24–27 weeks of GA) | Group B (n=50) (28–33 weeks of GA) | Group C (n=49) (34–36 weeks of GA) | ||||
| Creatinine (mg/dl) | Birth | Mean±SD (range) | 0.57±0.19 (0.40–1.00) | 0.62±0.18 (0.30–1.00) | 0.68±0.14 (0.40–1.20) | 0.64±0.17 (0.30–1.20) |
| 95% CI | 0.61–0.68 | |||||
| 48–72h | Mean±SD (range) | 0.93±0.47 (0.40–1.90) | 0.65±0.17 (0.20–1.10) | 0.57±0.29 (0.10–2.00) | 0.64±0.28 (0.10–2.00) | |
| 95% CI | 0.58–0.68 | |||||
| 7 days | Mean±SD (range) | 0.73±0.15 (0.50–1.00) | 0.59±0.19 (0.30–1.10) | 0.50±0.19 (0.20–1.40) | 0.56±0.19 (0.20–1.40) | |
| 95% CI | 0.53–0.60 | |||||
 Cys values arranged by GA group (p=0.07) and postnatal days of life (p<0.05). (b) Creatinine values arranged by GA group (p=0.11) and postnatal days of life (p<0.05).")
Fig. 1b shows the changes in the values of creatinine in each GA group over time. There is a decrease over time, and serum concentrations are lower at 7 days (p<0.05). However, there were no differences among GA groups (p=0.11).
Fig. 2a shows how serum Cys C continues to decrease at 48–72h depending on the presence or absence of respiratory pathology, and how it increases at 7 days (p<0.05). Besides, it shows that the concentration of Cys C is lower in the group with respiratory pathology (p<0.05). Fig. 2b shows that serum creatinine decreases over time depending on the presence or absence of respiratory pathology, with lower values at 7 days (p<0.05). However, there are no differences in the values of creatinine among groups based on the presence or absence of respiratory pathology (p=0.73).
 Serum Cys C and creatinine values arranged by respiratory pathology and postnatal days of life. (c and d) Serum Cys C and creatinine values arranged by weight and postnatal days of life. (e and f) Serum Cys C and creatinine values.")
Fig. 2c shows that serum Cys C continues to decrease at 48–72h of life and that it increases at 7 days in both weight groups (p<0.05). There are no differences among groups >1500g compared to ≤1500 (p=0.08). Fig. 2d shows that serum creatinine continues to decrease over time in both weight groups (p<0.05), and creatinine values are higher in the group ≤1500g (p<0.05).
Fig. 2e shows the values of Cys C in relation to blood pressure figures. Serum Cys C values are slightly lower in patients with low blood pressure (p<0.05) during the first 48h compared to patients with normal blood pressure. These values subsequently increase in both groups. Creatinine values increase at 48h in patients with low blood pressure, and these values decrease at the first week of life (p<0.05). These figures are more stable in patients with normal blood pressure (p=0.59) (Fig. 2f).
The decrease in serum Cys C at 48–72h of life and the increase at 7 days also depend on whether nephrotoxic drugs are administered or not, there being no differences in the values of Cys C among groups (p=0.61). In relation to creatinine, it continues to decrease over time (p<0.05), without there being differences between both groups (p=0.94). (Table 2).
Plasma cystatin C and creatinine values in our population arranged by weight, respiratory pathology, low blood pressure cases and administration of nephrotoxic drugs.
| Time (p<0.05) | Weight (p=0.08) | Respiratory P. (p<0.05) | Blood pressure (p<0.05) | Nephrotoxic drugs (p=0.61) | ||||||
|---|---|---|---|---|---|---|---|---|---|---|
| ≤1500gn=35 | >1500gn=72 | Yesn=46 | Non=61 | Low blood pressuren=12 | Normal blood pressuren=95 | Yesn=73 | Non=34 | |||
| Cystatin C (mg/l) | Birth | Mean±SD | 1.44±0.25 | 1.59±0.29 | 1.49±0.25 | 1.58±0.30 | 1.42±0.33 | 1.56±0.28 | 1.50±0.29 | 1.63±0.27 |
| 95% CI | 1.30–1.59 | 1.54–1.73 | 1.37–1.62 | 1.52–1.74 | ||||||
| 48–72h | Mean±SD | 1.31±0.24 | 1.46±0.40 | 1.25±0.24 | 1.48±0.00 | 1.14±0.15 | 1.41±0.37 | 1.33±0.36 | 1.48±0.34 | |
| 95% CI | 1.14–1.47 | 1.35–1.58 | 1.11–1.39 | 1.41–1.66 | ||||||
| 7 days | Mean±SD | 1.49±0.39 | 1.51±0.26 | 1.43±0.33 | 1.56±0.28 | 1.35±0.30 | 1.52±0.31 | 1.50±0.35 | 1.51±0.19 | |
| 95% CI | 1.32–1.65 | 1.45–1.68 | 1.29–1.57 | 1.50–1.74 | ||||||
| Time (p<0.05) | Weight (p<0.05) | Respiratory P. (p=0.73) | Blood pressure (p=0.59) | Nephrotoxic drugs (p=0.94) | ||||||
|---|---|---|---|---|---|---|---|---|---|---|
| ≤1500gn=35 | >1500gn=70 | Yesn=46 | Non=59 | Low blood pressuren=12 | Normal blood pressuren=93 | Yesn=73 | Non=32 | |||
| Creatinine (mg/dl) | Birth | Mean±SD | 0.61±0.18 | 0.66±0.17 | 0.64±0.18 | 0.65±0.16 | 0.60±0.18 | 0.65±0.17 | 0.64±0.16 | 0.66±0.18 |
| 95% CI | 0.55–0.67 | 0.62–0.70 | 0.59–0.69 | 0.61–0.7 | ||||||
| 48–72h | Mean±SD | 0.71±0.24 | 0.59±0.26 | 0.65±0.31 | 0.61±0.21 | 0.73±0.20 | 0.61±0.26 | 0.66±0.27 | 0.56±0.20 | |
| 95% CI | 0.62–0.79 | 0.53–0.65 | 0.57–0.72 | 0.55–0.68 | ||||||
| 7 days | Mean±SD | 0.65±0.20 | 0.52±0.18 | 0.57±0.20 | 0.56±0.19 | 0.57±0.18 | 0.56±0.20 | 0.59±0.21 | 0.50±0.15 | |
| 95% CI | 0.59–0.72 | 0.47–0.56 | 0.51–0.63 | 0.51–0.61 | ||||||
No group statistical analysis was not conducted to determine the presence or absence of the following pathologies: hypoxic ischaemic encephalopathy (n=3), acute renal failure (ARF) (n=3), intraventricular haemorrhage (n=3), necrotising enterocolitis (n=3) or neonatal sepsis (n=5), due to the low incidence of these pathologies in the studied population.
DiscussionIt is widely known that serum Cys C values are very high in neonates and that these are exclusively related to NB, since serum Cys C does not cross the placental barrier as creatinine, which comes from both mothers and NB.
Upon determination of GFR, Cys C provides better sensitivity (97%) and specificity (96%) than creatinine (83% and 87%, respectively),5,6 which is supported by recent studies where Cys C reference figures are determined in both preterm NB and term NB from different populations.7,8 The objective of this study was not to estimate GFR in our population, but rather serum concentration of Cys C in preterm newborns; thus, the GFR rate is not mentioned in the study. However, it is worth mentioning the reference method used for the measurement of GFR in these patients. There are different estimation equations based on creatinine, Cys C and both endogenous markers. These equations arise from a newborn population with specific characteristics (in relation to age and chronic renal disease stage) and from certain procedures for the measurement and calibration of several endogenous markers, which differ from equations used for the adult population. The most commonly used estimation equation based on creatinine is the Schwartz equation. It was originally published in 1976. It is called the original Schwartz equation. In 2009, the original equation was updated and it is currently known as the updated or modified Schwartz equation. The creatinine measurement procedure in the lab in this equation is an enzymatic procedure with IDMS traceability (standardised creatinine). It is the first paediatric estimation equation with standardised creatinine based on the size of the patient, 2009 updated Schwartz equation (ml/min/1.73m2) [K×size]/pCr, where K is 0.413, with size in cm and plasma creatinine (pCr) in mg/dl.
Equations based on serum Cys C are simpler than equations based on creatinine, since the former do not include anthropometric data: Filler, 2003 (ml/min/1.73m2) 91.62×CysC-1.123 (cystatin C: mg/l).
The results of our study show that Cys C values progressively decrease at 48–72h of life, this decrease being statistically significant over time (p<0.05), followed by an increase at 7 days. This decrease over time occurs in the 3GA groups, and, though the values of Cys C are higher as the GA of preterm newborns increases, there are no statistically significant differences among GA groups. However, Je-Hyan found that serum levels of Cys C tend to decrease as GA increases, as from the third postpartum day.9 However, we have found certain concordance with studies that show lower values of serum Cys C in bigger preterm newborns, which means that serum Cys C might be affected by renal immaturity that favours excessive urinary loss in more immature newborns, compared to term newborns.10,11 Interestingly, according to some authors, newborns with low birth weight have higher serum levels of Cys C during childhood.12 The specific meaning of high serum levels of Cys C during the first days of life is still unknown, but it may be related to its excretion difficulty secondary to tubular immaturity.13
Regarding its association with a concomitant pathology,14,15 there are statistically significant differences in the values of Cys C in patients with respiratory pathology, and the lowest values are observed in patients with said pathology. We have not determined the exact cause of said values. Elmas et al. observed lower values of Cys C in neonates with respiratory distress, which makes it an independent predictor of acute renal failure even in patients with distress.16
This also occurs in cases of haemodynamic instability. Although Cys C values are lower in patients with low blood pressure, they remain more stable over time than creatinine values, which increase more abruptly at 48h of life. Having said that, we did not find a cause for decreased Cys C values in this case either. This could be related to a greater urinary loss of urine Cys C as a result of renal lesion associated with renal hypoperfusion, although this is currently just a study hypothesis. Besides, an inverse correlation between pressure and serum creatinine and Cys C is to be expected, as shown by CL. Abitbol et al. in their study,17 although it is unknown whether, in cases where low blood pressure persists, Cys C urinary losses could increase and Cys C blood levels could decrease. In our population, it is also true that we found a small sample size of neonates with low blood pressure, which could affect the data and the statistical significance. Patients with systolic pressure measurements below the third percentile for their age group were considered severe low blood pressure cases. These cases could be due to perinatal hypoxia, severe intraventricular haemorrhage, sepsis, severe enterocolitis or congenital cardiopathies, which make it difficult to obtain a representative sample for the study due to the low incidence of these pathologies in the population studied18,19 during the first week of life.
In the study conducted by CL. Abitbol et al.17 creatinine and Cys C values were also related to the administration of nephrotoxic drugs, especially gentamicin, without there being significant differences among preterm newborns who received these drugs and those who did not receive them. We also did not find statistically significant differences among Cys C values in neonates treated with nephrotoxic drugs and those who were not treated. This is probably due to the better control of said drugs and the reasonable use of these medications, which would reduce the risk of toxicity.
In our study, serum creatinine values decreased in preterm newborns, and lower values were observed at 7 days of life. Statistically significant differences in creatinine values according to weight are evidenced. Patients ≤1500g present higher values, unlike Cys C values, where there are no statistically significant differences.20
It was difficult to assess the increase in Cys C in subjects with ARF because very few individuals presented that pathology in our sample. A possibility would be to consider a subclinical assessment of acute renal disease, or the adequate management of liquids in this population, which could reduce the risk of renal disease. In relation to the sepsis parameter, we could not assess Cys C values because of the small sample of patients with confirmed sepsis. Y Li published changes in the values of IL-18 in neonates with sepsis, but not modifications in the values of Cys C as a predictor of independent risk for ARF.21
There are several limitations in this study. Firstly, it is difficult to determine which subjects are “healthy”, although we tried to classify patients according to the clinical severity of their pathologies associated with prematurity. Subjects may have different degrees of disease severity, may be subject to different mechanic breathing modalities and may have a certain degree of subclinical renal failure, which is inherent to their immaturity. Secondly, we could not standardise levels in the first group, because this is for a smaller and statistically less valuable group.
ConclusionsSerum Cys C decreases at 48–72h of life, this decrease being statistically significant over time (p<0.05), followed by an increase at 7 days. This decrease over time occurs in the 3GA groups, and, though the values of Cys C are higher as the GA of preterm newborns increases, there are no statistically significant differences in Cys C values among GA groups. These changes are probably due to the maturation of renal function.
Statistically significant differences in serum creatinine values are evidenced when groups are divided according to weight ≤1500g or >1500g (p<0.05), and creatinine levels are higher in patients with lower weight, although this difference is not present with serum Cys C. Thus, Cys C is a better GFR marker in very preterm newborns,22 since its values are less variable for the determination of the renal function in neonates23 and it is independent of body mass.
Lower Cys C values are found in cases of haemodynamic instability as well as in preterm newborns with associated respiratory pathology. However, more studies are needed for the identification of the exact measures of Cys C, creatinine and GFR in preterm newborns, taking into account that slight increases in serum creatinine probably indicate renal lesion, especially in this vulnerable population. Renal damage during the neonatal period and its subsequent follow-up should be assessed.
Conflicts of interestThe authors have no conflicts of interest to declare.
Please cite this article as: Bardallo Cruzado L, Pérez González E, Martínez Martos Z, Bermudo Guitarte C, Granero Asencio M, Luna Lagares S, et al. Valores de cistatina C sérica en recién nacidos pretérmino en nuestro medio. Relación con valores de creatinina sérica y patologías de la prematuridad. Nefrologia. 2015;35:296–303.


