


The purpose of the study is to show the evolution of renal replacement therapy (RRT) in Spain from 2007 to 2013.
Aggregated data and individual patient records were used from participating regional renal disease registries and that National Transplant Organisation registry. The reference population was the official population on January 1st of each year studied. Data on incidence and prevalence were based on aggregated data, while the survival analysis was calculated from individual patient records. The study period was 2007–2013 for prevalence, incidence and transplantation, and survival was analysed for 2004–2012. The population covered by the registry was a minimum of 95.3–100% of the Spanish population for aggregated data. The EU27 age and gender distributions of the European population for 2005 were used to adjust incidence and prevalence for age and gender. Survival probabilities were calculated for incident patients between the years 2004 and 2013 using the Kaplan–Meier method to calculate unadjusted patient survival probability. The log rank test was applied to compare survival curves according to some risk factors. Cox proportional hazards model was created to study the potential predictors of survival.
In 2013, the total number of patients in Spain that started RRT was 5705 for 95.3% of the total Spanish population, with an unadjusted rate of 127.1PMP. The evolution from 2007 to 2013 showed a gradual decline from 127.4PMP in 2007 to 120.4PMP in 2012, with a small upturn to 127.1 in 2013. The adjusted incidence rate for the year 2013 was 121.5PMP for the total population, 158.7PMP for males and 83.1PMP for females. The most frequent cause of primary renal disease in incident was diabetes mellitus: 20.4% in 2007, which increased to 24.6% in 2013. The percentage of transplant as first RRT increased from 1.7% in 2007 to 4.2% in 2013. The total number of patients in RRT for 95.3% of the population in 2013 was 50,567, with an unadjusted prevalent rate of 1125.7PMP. The adjusted prevalence rate for 2013 was 1087.5PMP (1360.7PMP for males and 809.8PMP for females). The percentage of diabetes mellitus in prevalent patients evolved from 13.9% in 2007 to 14.9% (168PMP) in 2013. The percentage of transplanted prevalent patients with functioning grafts evolved from 49.3% in 2007 to 51.5% in 2013. The number of transplantations performed each year increased from 2211 (48.9PMP) in 2007 (6.2% living donor transplants) to 2552 (54.2PMP) in 2013 (15.0% living donor transplants).
40,394 patients from 12 regions of Spain who began RRT between 2004 and 2012 were included in the survival analysis (87% Spanish population coverage). Unadjusted patient survival probabilities after one, 2 and 5 years were 91, 81 and 57%, respectively. In the univariate analysis, better survival was found for non-diabetic patients, women, age below 45, peritoneal dialysis as first RRT and patients who had received at least one transplant.
El objetivo del estudio es mostrar la evolución del TRS en España desde 2007 hasta 2013.
Se utilizaron datos agregados y registros individuales de pacientes de los registros de enfermedades renales de las comunidades autónomas participantes, y el registro de la Organización Nacional de Trasplantes. La población de referencia fue la población oficial a 1 de enero de cada año estudiado. La incidencia y la prevalencia se basan en datos agregados, mientras que el análisis de supervivencia se calculó a partir de registros individuales. El período de estudio fue 2007-2013 para prevalencia, incidencia y trasplante; y 2004-2012 para el análisis de supervivencia. La población cubierta por el registro fue un mínimo del 95,3-100% de la población española para datos agregados. La distribución de edad y sexo de la población europea (UE-27) para el año 2005 se utilizó para ajustar incidencia y prevalencia. Se calcularon las probabilidades de supervivencia de los pacientes incidentes entre 2004 y 2013, utilizando el método de Kaplan-Meier para calcular la probabilidad de supervivencia sin ajustar. Las curvas de supervivencia se compararon mediante log rank test de acuerdo con algunos factores de riesgo. Se construyó un modelo proporcional de Cox para estudiar los posibles predictores de supervivencia.
En 2013 el número total de pacientes en España que iniciaron TRS fue de 5.705 para un 95,3% del total de la población española; con una tasa no ajustada de 127,1pmp. La evolución desde 2007 hasta 2013 mostró una disminución gradual, de 127,4pmp en 2007 a 120,4pmp en 2012, con un pequeño repunte a 127,1 en 2013. La incidencia ajustada para el año 2013 fue de 121,5pmp total, 158,7pmp para hombres y 83,1pmp para mujeres. La causa más frecuente de enfermedad renal primaria en incidentes fue la diabetes mellitus: el 20,4% en 2007, aumentando al 24,6% en 2013. El porcentaje de trasplante, como primera TRS, aumentó del 1,7% en 2007 al 4,2% en 2013. El número total de pacientes en TRS, respecto al 95,3% de la población, en 2013 fue de 50.567, con una tasa de prevalencia no ajustada de 1.125,7pmp. La tasa de prevalencia ajustada para 2013 fue 1.087,5pmp, 1.360,7pmp para varones y 809,8pmp para mujeres. El porcentaje de diabetes mellitus en pacientes prevalentes evolucionó del 13,9% en 2007 al 14,9% en 2013. El porcentaje de pacientes prevalentes trasplantados y con injerto funcionante pasó del 49,3% en 2007 al 51,5% en 2013. El número de trasplantes realizado cada año aumentó de 2.211 (48,9pmp) en 2007, con un 6,2% de trasplantes de donante vivo, a 2.552 (54,2pmp) en 2013, con un 15% de trasplantes de donante vivo.
Se incluyeron en el análisis de supervivencia 40.394 pacientes procedentes de 12 regiones que comenzaron su TRS entre 2004 y 2012 (un 87% de cobertura de la población española). Las probabilidades de supervivencia sin ajustar de los pacientes, a uno, 2 y 5 años, fueron del 91, 81 y 57% respectivamente. En el análisis univariado se encontró una mejor supervivencia en pacientes no diabéticos, de sexo femenino, edad inferior a 45 años, siendo la diálisis peritoneal el primer TRS y que hubieran recibido al menos un trasplante.
Since the publication of the 2006 Spanish Renal Registry (REER) report in Nefrología1 in 2009, we have not published any additional report, although we have presented a yearly report at the Spanish Society of Nephrology (SEN) Congress. Also the information has been available in the website of the SEN2 as a presentation. During these years we have also developed our own website3 that collects annual incidence and prevalence data separated by modality of renal replacement treatment (RRT) including each autonomous regions (ARs) of Spain and the global data for Spain. We maintain our collaboration with the European ERA-EDTA registry4 and with the North American USRDS registry,5 as the reference from Spain. Since 2012 (2011 report),6 the yearly report at the SEN Congress includes survival data in patients in RRT since 2004, compiling data from the ARs registries that was made available.
In recent years, a new codification of primary renal disease (PRD) has been developed by the ERA-EDTA Registry, with the collaboration of one member of our REER. Subsequently, the REER collaborated in its translation into Spanish published in Nefrología.7 The new coding provides a simpler system to achieve a more precise diagnosis of renal disease, including codes and terms for most renal diseases whether or not may progress end-stage renal failure. It also has the advantage of including the latest advances on renal disease, as well as a direct link to CIE-10 codes and SNOMED identifiers.
The aim of the present REER report is to illustrate the situation of end-stage renal disease (ESRD) in Spain in 2013. Through analysis of the evolution of the epidemiological parameters during recent years, we want to outline the possible evolution of the disease and RRT in the near future.
MethodologySources of data- •
Annual collection of aggregated and individualised data from the renal registries of the participating ARs. It was not possible to include data from the autonomous region of the Canary Islands in 2013 since in 2013 and 2014 the databases and electronic storage medium were being transferred to the Canary Islands Health Service, which is now analysing the registry.
- •
Donation and transplant registry of the Spanish Transplant Organisation.
- •
Reference population of Spain and each autonomous region: the official data on population is provided on 1 January of the year, published by the Spanish Official State Bulletin (BOE).8–14 Distribution of population by age group, obtained from the Spanish Statistical Office (INE) website.15
The incidence and prevalence data were calculated based on the aggregated data, while the survival analysis was performed based on the data on individual patients from the registries provided by the autonomous regions.
Study period- •
2007–2013 for prevalence, incidence and transplants.
- •
2004–2012 for the survival analysis.
The definitions used were those agreed upon by the Spanish Group of Registries of Renal Diseases (GRER)16 and, if not available, the definitions of the ERA-EDTA Registry.17
- •
Incidence: Number of patients who started RRT during the specified period; in this report it was in a year period during 2007–2013.
- •
Prevalence: Total number of alive patients in RRT on 31 December of the corresponding year with residence in each of the ARs.
Incidence and prevalence rates are expressed as patients per million of the population (PMP).
MethodsRates of incidence and prevalence- •
Non adjusted rates: number of incident or prevalent patients divided by the general population in the specific year and multiplied by one million. The rates are presented stratified by PRD, type of replacement therapy, sex and age group.
- •
Adjusted rates: We use the distribution by age and gender of the European population in 2005 (EU27)18 for the total in Spain and each AR to adjust the rates using the direct method.
The number of kidney transplants was recorded from the donation and transplant registry of the Spanish Transplant Organisation19 and the data was presented stratified by donor type (living, deceased by neurological criteria—brain death—or deceased by circulatory and respiratory criteria—asystole).
Methods for survival analysisIt was based on data on individual patients provided by the ARs with specific consent to be use for analysis. To merge all data, an initial process of data purging and conversion was performed until a uniform format was obtained that allowed the analysis of variables.
Patients incident between 2004 and 2012, over 15 years of age and with a follow-up greater than 3 months were included. Patients with a kidney transplant as a first RRT and patients from other registries were excluded.
For description of the patients included in the survival analysis, mean, median and standard deviation were used for the quantitative variables and percentages and frequencies were used for the categorical variables. The Kaplan–Meier method was used to calculate the unadjusted probability of survival, and the log-rank test was used to compare the survival curves between groups. A Cox proportional hazards model was developed to study factors potentially predictive of survival using the following as adjustment variables: age, sex, RRT modality, diabetic nephropathy as PRD and having received at least one transplant.
Death was considered to be an event, censoring the recovery of renal function, transfer to another registry and the loss to follow-up. The analysis was done by intention to treat.
The software programs used were Microsoft Excel and SPSS v.15.0 for Windows.
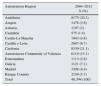
ResultsThe total population covered by the registry has varied from year to year, from at least 95.3% to 100% of the total population in Spain for the aggregated incidence and prevalence data (Table 1).
Coverage of the population of Spain by the REER.
| Year | |||||||
|---|---|---|---|---|---|---|---|
| 2007 | 2008 | 2009 | 2010 | 2011 | 2012 | 2013 | |
| Population | 45,200,737 | 46,157,822 | 46,745,807 | 47,021,031 | 47,190,493 | 47,265,321 | 47,129,700 |
| Population covered | 43,415,981 | 44,296,880 | 44,804,102 | 45,559,052 | 47,095,618 | 47,265,321 | 44,916,825 |
| % Coverage | 96.1 | 96 | 95.8 | 96.9 | 99.8 | 100 | 95.3 |
REER: The Spanish Renal Registry.
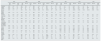
In 2013 the total number of patients who started RRT due to ESRD was 5705, for a 95.3% of the total population of Spain. This represents an unadjusted rate of 127PMP. The lowest rate was in Castilla-La Mancha with 102.3PMP, and the highest rate was that of Asturias with 158.2PMP (Table 2). Among incident patients, 3746 (65.7%) were men and 1959 (34.3%) were women, and the rate was 200.9PMP for men and 102.4PMP for women (Table 2), so in Spain, for every woman that started RRT, there were 1.9 men who did so. The value varied according to AR; from 1:1 in Melilla up to 2.7 men for each woman in Cantabria and in Castilla y León. By age group, the incidence increased in both men and in women, reaching 414.9PMP in patients over 75 years of age (Table 3). The age-adjusted incidence rate was 121.5PMP overall, 158.7PMP for men and 83.1 for women, with a wide variation among ARs (Table 4 and Fig. 1).
Incidence by gender and initial renal replacement treatment modality in 2013.
| Total | Gender | Initial treatment | |||||||||||
|---|---|---|---|---|---|---|---|---|---|---|---|---|---|
| N | PMP | N | PMP | ||||||||||
| Population | N | PMP | Male | Female | Male | Female | HD | PD | ETX | HD | PD | ETX | |
| Andalusia | 8,440,300 | 1043 | 123.6 | 655 | 388 | 157 | 90.9 | 845 | 160 | 38 | 100.1 | 19 | 4.5 |
| Aragon | 1,347,150 | 168 | 124.7 | 112 | 56 | 167.2 | 82.7 | 135 | 30 | 3 | 100.2 | 22.3 | 2.2 |
| Asturias | 1,068,165 | 169 | 158.2 | 121 | 48 | 236.6 | 86.2 | 125 | 42 | 2 | 117 | 39.3 | 1.9 |
| Balearic Islandsa | 1,017,395 | 144 | 141.5 | 91 | 53 | 179.3 | 103.9 | 123 | 10 | 11 | 120.9 | 9.8 | 10.8 |
| Cantabria | 591,888 | 63 | 106.4 | 46 | 17 | 159.4 | 56.1 | 38 | 14 | 11 | 64.2 | 23.7 | 18.6 |
| Castile and León | 2,519,875 | 270 | 107.1 | 197 | 73 | 158.1 | 57.3 | 220 | 44 | 6 | 87.3 | 17.5 | 2.4 |
| Castile-La Mancha | 2,100,998 | 215 | 102.3 | 136 | 79 | 128.7 | 75.7 | 163 | 51 | 1 | 77.6 | 24.3 | 0.5 |
| Catalonia | 7,553,650 | 1095 | 145 | 719 | 376 | 193 | 98.2 | 873 | 143 | 79 | 71.1 | 18.7 | 0.7 |
| Autonomous Community of Valencia | 5,113,815 | 683 | 133.6 | 434 | 249 | 171.2 | 96.5 | 537 | 141 | 5 | 170.7 | 28 | 15.4 |
| Extremadura | 1,104,004 | 137 | 121.4 | 97 | 40 | 173.3 | 70.2 | 118 | 18 | 1 | 106.9 | 16.3 | 0.9 |
| Galicia | 2,765,940 | 393 | 142.1 | 264 | 129 | 197.7 | 90.2 | 291 | 83 | 19 | 105.2 | 30 | 6.9 |
| Madrid | 6,495,551 | 780 | 120.1 | 505 | 275 | 161.7 | 81.6 | 630 | 110 | 40 | 97 | 16.9 | 6.2 |
| Murcia | 1,472,049 | 160 | 108.7 | 107 | 53 | 144.6 | 72.4 | 125 | 33 | 2 | 84.9 | 22.4 | 1.4 |
| Navarra | 644,477 | 69 | 107.1 | 48 | 21 | 149.6 | 64.9 | 53 | 15 | 1 | 82.2 | 23.3 | 1.6 |
| Basque Country | 2,191,682 | 262 | 119.5 | 183 | 79 | 171.2 | 70.4 | 178 | 66 | 18 | 81.2 | 30.1 | 8.2 |
| La Rioja | 322,027 | 37 | 114.9 | 22 | 15 | 137.4 | 92.7 | 28 | 8 | 1 | 86.9 | 24.8 | 3.1 |
| Ceutab | 84,180 | 12 | 142.6 | 7 | 5 | 162.6 | 121.6 | 12 | 0 | 0 | 142.6 | 0 | 0 |
| Melillab | 83,679 | 8 | 95.6 | 4 | 4 | 93 | 98.4 | 8 | 0 | 0 | 95.6 | 0 | 0 |
| Total in Spain | 44,916,825 | 5708 | 127.1 | 3746 | 1959 | 200.9 | 102.4 | 4502 | 968 | 238 | 100.2 | 21.6 | 5.3 |
PD: peritoneal dialysis (all modalities); HD: haemodialysis (all modalities); N: total number of cases; PMP: patients per million of the population; ETX: early kidney transplant.
Incidence by age group in 2013 (PMP).
| 0–14 | 15–44 | 45–64 | 65–74 | >75 | |
|---|---|---|---|---|---|
| Andalusia | 6.5 | 39.6 | 172.8 | 399.8 | 387.4 |
| Aragon | 10.7 | 15.1 | 136.6 | 343.7 | 444 |
| Asturias | 0 | 38.9 | 193.9 | 386.8 | 362.8 |
| Balearic Islands | 0 | 33.2 | 180.6 | 524.6 | 579.7 |
| Cantabria | 0 | 52.3 | 124.7 | 388.3 | 159.1 |
| Castile and León | 0 | 23.9 | 107.2 | 315.6 | 276.6 |
| Castile-La Mancha | 0 | 26.1 | 140.1 | 243 | 378.1 |
| Catalonia | 11 | 34.3 | 162.7 | 470.6 | 535.1 |
| Autonomous Community of Valencia | 5.2 | 35.9 | 145.5 | 397.6 | 499.6 |
| Extremadura | 6.3 | 29.6 | 163.9 | 304.9 | 387.4 |
| Galicia | 0 | 39.3 | 172.2 | 365.5 | 331.2 |
| Madrid | 4.9 | 39.7 | 151.3 | 365 | 440.2 |
| Murcia | 3.8 | 38.7 | 147.4 | 399.6 | 366.8 |
| Navarra | 0 | 31.1 | 147.8 | 290.3 | 323.6 |
| Basque Country | 0 | 46.3 | 115.3 | 312.2 | 370.9 |
| La Rioja | 0 | 23.5 | 82.1 | 583.7 | 327.6 |
| Ceuta | 0 | 80.1 | 149 | 395.1 | 969.2 |
| Melilla | 0 | 79.9 | 51.8 | 467.7 | 517.3 |
| Total in Spain | 5 | 36 | 153.1 | 384.6 | 414.9 |
PMP: patients per million of the population.
Age-adjusted incidence (EU27, 2005) 2013 (PMP).
| Male | Female | Total | |
|---|---|---|---|
| Ceuta | 208.5 | 149 | 180.4 |
| Balearic Islands | 187.5 | 110.9 | 151.1 |
| Catalonia | 184.4 | 95.6 | 140.5 |
| Melilla | 111.1 | 142.6 | 128.4 |
| Asturias | 186.6 | 71.2 | 127.9 |
| Andalusia | 138.7 | 94.4 | 127 |
| Autonomous Community of Valencia | 157.2 | 93.2 | 126.6 |
| Madrid | 163.1 | 83.4 | 122.2 |
| Galicia | 158.9 | 77.6 | 118.3 |
| Murcia | 155.7 | 79.3 | 118.2 |
| Extremadura | 152.6 | 67.7 | 111.8 |
| La Rioja | 126 | 88.9 | 108.6 |
| Aragon | 158.5 | 73 | 107.4 |
| Basque Country | 146 | 64 | 105 |
| Navarra | 136.8 | 63.2 | 101.2 |
| Cantabria | 149.8 | 51.8 | 100.9 |
| Castile-La Mancha | 120.3 | 71.2 | 97 |
| Castile and León | 124.4 | 46.1 | 86.8 |
| Total in Spain | 158.7 | 83.1 | 121.5 |
PMP: patients per million of the population.

As far as RRT modality, in 2013, 78.9% of patients started in some modality of haemodialysis (HD), 16.9% started in peritoneal dialysis (PD) and 4.2% had an early kidney transplantation. HD rates was 100.2PMP, PD 21.6PMP and early kidney transplant 5.3PMP. Again, a wide variation was observed among the different ARs (Table 2 and Fig. 2).

By PRD, 24.6% of incident patients had the diagnosis of diabetes mellitus (DM); classified as PRD of unknown origin (UO) were 20.9%; vascular diseases, including hypertension (vascular and/or hypertensive nephropathy [VHN]), represented a 16.2%; and glomerular disease (glomerulonephritis) were only 12.3% of incident patients (Table 5). DM was the most common PRD (29.2%) in patients who started RRT between 65 and 74 years old, and VHN (24.8%) and UO (27.8%) were the most common PRDs in the group patients with more than 75 years (Table 5). However, the greatest percentage of DM (33.9%) was in the group of 45 to 64 years of age, and the percentage of UO increased with the age group reaching a 40.7% in those over 75 years old (Table 6 and Figs. 3 and 4).
Distribution of PRD in each age group. 2013.
| GN (%) | CPN/CIN (%) | DM (%) | VHN (%) | PKD (%) | HDs (%) | SDs (%) | Other (%) | UO (%) | Total (%) | |
|---|---|---|---|---|---|---|---|---|---|---|
| 0–14 | 14.71 | 17.7 | 0 | 2.9 | 5.9 | 29.4 | 2.9 | 11.8 | 14.7 | 100 |
| 15–44 | 22.4 | 12.5 | 16.7 | 7.1 | 8.3 | 5.3 | 7.1 | 3.3 | 17.4 | 100 |
| 45–64 | 16.5 | 8.4 | 26.5 | 10.7 | 13 | 1.7 | 4.7 | 3.3 | 15.3 | 100 |
| 65–74 | 10.1 | 8.7 | 29.2 | 17.1 | 4.5 | 1% | 4.8 | 3.6 | 21.1 | 100 |
| >75 | 6 | 7.6 | 22.1 | 24.8 | 3 | 0.5 | 4.4 | 3.94 | 27.9 | 100 |
| Adults | 12.3 | 8.7 | 24.7 | 16.3 | 7.2 | 1.6 | 4.9 | 3.6 | 20.9 | 100 |
| Total | 12.3 | 8.8 | 24.6 | 16.2 | 7.2 | 1.7 | 4.9 | 3.6 | 20.9 | 100 |
DM: diabetes mellitus; HDs: hereditary diseases; PRD: primary renal disease; SDs: systemic diseases; GN: glomerulonephritis; VHN: vascular and/or hypertensive nephropathy; CPN/CIN: chronic pyelonephritis/chronic interstitial nephropathy; PKD: polycystic kidney disease; UO: unknown origin.
Distribution by age group of PRD. 2013.
| GN (%) | CPN/CIN (%) | DM (%) | VHN (%) | PKD (%) | HDs (%) | SDs (%) | Other (%) | UO (%) | Total (%) | |
|---|---|---|---|---|---|---|---|---|---|---|
| 0–14 | 0.7 | 1.2 | 0% | 0.1 | 0.5 | 10.2 | 0.4 | 1.9 | 0.4 | 0.6 |
| 15–44 | 21.1 | 16.6 | 7.9 | 5.1 | 13.4 | 35.7 | 16.9 | 10.7 | 9.7 | 11.6 |
| 45–64 | 42.1 | 30.1 | 33.9 | 20.8 | 57.1 | 30.6 | 30.1 | 28.6 | 23 | 31.4 |
| 65–74 | 21.3 | 25.8 | 30.8 | 27.3 | 16.3 | 15.3 | 25.5 | 25.7 | 26.2 | 25.9 |
| >75 | 14.9 | 26.4 | 27.4 | 46.7 | 12.7 | 8.2 | 27.2 | 33 | 40.7 | 30.5 |
| Total | 100 | 100 | 100 | 100 | 100 | 100 | 100 | 100 | 100 | 100 |
DM: diabetes mellitus; HDs: hereditary diseases; PRD: primary renal disease; SDs: systemic diseases; GN: glomerulonephritis; VHN: vascular and/or hypertensive nephropathy; CPN/CIN: chronic pyelonephritis/chronic interstitial nephropathy; PKD: polycystic kidney disease; UO: unknown origin.


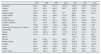
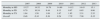
The evolution of the overall incidence from 2007 to 2013 shows a sustained a gradual decrease from 127.4PMP in 2007 (in 2006 it was 130.6PMP) down to 120.4PMP in 2012, with a rise of 5.5%, up to 127.1, in 2013, which may be explained by an increase in incidence in the most populared ARs: Andalusia (5.2%), Catalonia (24.6%) and Madrid (14.8%), while in Valencia, the fourth most populated, it decreased (−5.2%) (Table 7 and Fig. 5).
Overall incidence, unadjusted rate 2007 to 2013 (PMP).
| 2007 | 2008 | 2009 | 2010 | 2011 | 2012 | 2013 | Variation 2012–2013 (%) | |
|---|---|---|---|---|---|---|---|---|
| Andalusia | 117.9 | 125.6 | 118.8 | 116.6 | 114 | 117.5 | 123.6 | 5.2 |
| Aragon | 131.9 | 109.3 | 118.9 | 121 | 121.1 | 131.2 | 124.7 | −4.9 |
| Asturias | 132.1 | 123.1 | 129.9 | 141.5 | 125.3 | 158.2 | 26.3 | |
| Balearic Islands | 111.3 | 125.4 | 95 | 79.6 | 103.1 | 144.7 | 141.5 | −2.2 |
| Canary Islands | 147.1 | 150.8 | 165.4 | 142.1 | 166.9 | 144 | ||
| Cantabria | 92.5 | 120.2 | 125.6 | 140.1 | 116.3 | 114.5 | 106.4 | −7 |
| Castile and León | 124.2 | 124.7 | 120.1 | 116 | 115.7 | 123.3 | 107.1 | −13.1 |
| Castile-La Mancha | 102.7 | 99.8 | 95.6 | 104.4 | 94.5 | 98 | 102.3 | 4.4 |
| Catalonia | 137.3 | 134.4 | 142.5 | 127.1 | 129.4 | 116.4 | 145 | 24.6 |
| Autonomous Community of Valencia | 146 | 128.6 | 138.4 | 137.3 | 129.8 | 141 | 133.6 | −5.2 |
| Extremadura | 105.5 | 133 | 107.9 | 134.6 | 105.5 | 120 | 124.1 | 3.4 |
| Galicia | 139.2 | 147.3 | 124.5 | 135.1 | 141.7 | 132.3 | 142.1 | 7.4 |
| Madrid | 117.6 | 125 | 114.3 | 107.6 | 106.2 | 104.6 | 120.1 | 14.8 |
| Murcia | 108.8 | 108.5 | 108.7 | 0.2 | ||||
| Navarra | 146.9 | 132.2 | 122.1 | 125.6 | 119.9 | 103.9 | 107.1 | 3 |
| Basque Country | 113 | 107.6 | 126.1 | 105.1 | 107.1 | 111.7 | 119.5 | 7 |
| La Rioja | 106.8 | 132.3 | 143 | 124.1 | 139.3 | 132.9 | 114.9 | −13.5 |
| Ceuta | 326.4 | 336 | 266.9 | 211 | 194.2 | 142.8 | 142.6 | −0.2 |
| Melilla | 331.2 | 279.9 | 122.5 | 118.4 | 140.2 | 210.4 | 95.6 | −54.6 |
| Total in Spain | 127.4 | 128.1 | 126.5 | 121.1 | 120.7 | 120.4 | 127 | 5.5 |
PMP: patients per million of the population.
 overall and according to initial RRT modality. 2007–2013.")
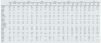
The decrease in incidence occurred at the expense of HD as an initial RRT, while the incidence of PD and early kidney transplant progressively increased reaching 21.5PMP and 5.5PMP, respectively in 2013 (Table 8 and Fig. 5).
Evolution of the percentage of the different initial RRT modalities 2007–2013.
| 2007 | 2008 | 2009 | 2010 | 2011 | 2012 | 2013 | |||||||||||||||
|---|---|---|---|---|---|---|---|---|---|---|---|---|---|---|---|---|---|---|---|---|---|
| HD (%) | PD (%) | ETX (%) | HD (%) | PD (%) | ETX (%) | HD (%) | PD (%) | ETX (%) | HD (%) | PD (%) | ETX (%) | HD (%) | PD (%) | ETX (%) | HD (%) | PD (%) | ETX (%) | HD (%) | PD (%) | ETX (%) | |
| Andalusia | 89.2 | 10.1 | 0.7 | 88.3 | 10.1 | 1.7 | 86.4 | 11.4 | 2.2 | 89.1 | 8.3 | 2.6 | 86 | 11.7 | 2.3 | 81.9 | 14.7 | 3.4 | 81 | 15.3 | 3.6 |
| Aragon | 94.7 | 4.1 | 1.2 | 93.8 | 6.2 | 0 | 93.1 | 6.9 | 0 | 87.7 | 11 | 1.2 | 84 | 13.5 | 2.5 | 84.7 | 12.4 | 2.8 | 80.4 | 17.9 | 1.8 |
| Asturias | 82.4 | 15.5 | 2.1 | 85 | 12 | 3 | 85.1 | 14.9 | 0 | 81.8 | 13.9 | 4.4 | 79.7 | 17 | 3.3 | 75.6 | 23.7 | 0.7 | 74 | 24.9 | 1.2 |
| Balearic Islands | 88.7 | 11.3 | 0 | 90% | 10% | 0% | 91.2% | 8.8% | 0% | 89.8% | 8% | 2.3% | 81% | 18.1% | 1% | 80.2% | 14.8% | 4.9% | 85.4% | 6.9% | 7.6% |
| Canary Islands | 88.6 | 11.1 | 0.3 | 88.2 | 11.8 | 0 | 86.5 | 13.5 | 0 | 84.1 | 15.9 | 0 | 87.6 | 12.4 | 0 | 84.3 | 15.7 | 0 | |||
| Cantabria | 66 | 20.8 | 13.2 | 81.4 | 14.3 | 4.3 | 64.9 | 28.4 | 6.8 | 63.9 | 25.3 | 10.8 | 63.8 | 24.6 | 11.6 | 73.5 | 19.1 | 7.4 | 60.3 | 22.2 | 17.5 |
| Castile and León | 86.6 | 13.1 | 0.3 | 82.8 | 17.2 | 0 | 79.5 | 20.5 | 0 | 79.8 | 18.5 | 1.7 | 78.4 | 20.3 | 1.4 | 80.6 | 18.5 | 1 | 81.5 | 16.3 | 2.2 |
| Castile-La Mancha | 86.2 | 12.3 | 1.5 | 86.8 | 12.3 | 1 | 89.4 | 9.5 | 1 | 84.5 | 15.1 | 0.5 | 80.5 | 18.5 | 1 | 81.7 | 18.3 | 0 | 75.8 | 23.7 | 0.5 |
| Catalonia | 86.5 | 9.3 | 4.2 | 84.5 | 10.6 | 4.8 | 81.4 | 11.5 | 7 | 81.4 | 12.4 | 6.3 | 81.9 | 12.1 | 6 | 75.7 | 16.3 | 7.9 | 79.7 | 13.1 | 7.2 |
| Autonomous Community of Valencia | 91.3 | 7.9 | 0.8 | 91.5 | 7.3 | 0.8 | 90.1 | 7.9 | 2 | 85.2 | 11.7 | 3.4 | 83.9 | 15.2 | 0.9 | 79.4 | 17.3 | 3.3 | 78.6 | 20.6 | 0.7 |
| Extremadura | 90.4 | 9.6 | 0 | 84.2 | 15.8 | 0 | 84.9 | 15.1 | 0 | 88.6 | 11.4 | 0 | 84.6 | 15.4 | 0 | 87.2 | 12.8 | 0 | 86.1 | 13.1 | 0.7 |
| Galicia | 78.5 | 20.2 | 1.3 | 81.2 | 17.8 | 1 | 84.5 | 14.1 | 1.4 | 73.3 | 24.1 | 2.6 | 77.3 | 20.2 | 2.5 | 73.1 | 23.4 | 3.5 | 74 | 21.1 | 4.8 |
| Madrid | 83.6 | 13.7 | 2.7 | 83.7 | 14.9 | 1.4 | 82.9 | 14.2 | 2.9 | 82.9 | 14.7 | 2.4 | 81.9 | 14.5 | 3.6 | 81.6 | 13.8 | 4.6 | 80.8 | 14.1 | 5.1 |
| Murcia | 85.6 | 13.1 | 1.3 | 86.9 | 11.3 | 1.9 | 78.1 | 20.6 | 1.3 | ||||||||||||
| Navarra | 89.9 | 10.1 | 0 | 84.1 | 15.9 | 0 | 85.7 | 14.3 | 0 | 91.3 | 11.3 | 0 | 76.6 | 18.2 | 5.2 | 76.1 | 19.4 | 4.5 | 76.8 | 21.7 | 1.4 |
| Basque Country | 74 | 26 | 0 | 81 | 17.2 | 1.7 | 78.1 | 21.2 | 0.7 | 82.1 | 17.5 | 0.4 | 75.2 | 24.4 | 0.4 | 79.2 | 20 | 0.8 | 67.9 | 25.2 | 6.9 |
| La Rioja | 81.8 | 18.2 | 0 | 85.7 | 14.3 | 0 | 100 | 0 | 0 | 37.5 | 32.5 | 0 | 80 | 20 | 0 | 79.1 | 20.9 | 0 | 75.7 | 21.6 | 2.7 |
| Ceuta | 100 | 0 | 0 | 100 | 0 | 0 | 100 | 0 | 0 | 100% | 0 | 0 | 100 | 0 | 0 | 100 | 0 | 0 | 100 | 0 | 0 |
| Melilla | 100 | 0 | 0 | 100 | 0 | 0 | 100 | 0 | 0% | 100% | 0% | 0 | 54.5 | 45.5 | 0 | 88.2 | 11.8 | 0 | 100 | 0 | 0 |
| Total in Spain | 86.4 | 11.9 | 1.7 | 86.1 | 12.1 | 1.7 | 84.8 | 12.7 | 2.6 | 83.3 | 13.7 | 2.9 | 82.2 | 15.1 | 2.7 | 80 | 16.5 | 3.5 | 78.9 | 16.9 | 4.2 |
PD: peritoneal dialysis (all modalities); HD: haemodialysis (all modalities); RRT: renal replacement treatment; ETX: early kidney transplant.
The PRD has been fairly stable. DM increased from 2007 to 2010, and it became the leading cause of RRT above UOs, then it became stable around 24.5–25% of incident patients (Fig. 6). On the other the incidence in PMP of DM continued to increase every year. It should be taken into consideration that in the last year, the data from the Canary Islands with a incidence of DM as a PRD much greater than the rest of the ARs, was not included in the analysis (Fig. 7).
Prevalence

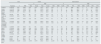
On December 31st 2013 there were 50,567 patients on RRT corresponding to a 95.3% of the total registry; the unadjusted prevalence rate was 1125.7PMP with a wide range among ARs. The prevalence was less than 1000PMP in the Balearic Islands, Cantabria, Madrid, Ceuta and Melilla, and greater than 1200 in Catalonia, Valencia, Galicia and Murcia (Table 9). Among the 50,567 prevalent patients, 31,596 were men (62.5%) and 18,971 were women (37.5%); this represents a rate of 1430PMP in men and 831.2PMP in women (Table 9); in Spain for every woman in RRT, there were 1.67 men This ration is varies from 1.25 in Melilla to 2.27 in Cantabria. By age group, the greatest prevalence corresponded to the group from 65 to 74 years of age that reached 3038.1PMP (Table 10 and Fig. 8).
Prevalence by sex and initial renal replacement treatment modality in 2013.
| Total | Gender | Initial treatment | |||||||||||||||
|---|---|---|---|---|---|---|---|---|---|---|---|---|---|---|---|---|---|
| N | PMP | N | PMP | ||||||||||||||
| Population | N | PMP | Male | Female | Male | Female | CHD | HHD | CAPD | CPD | FTX | CHD | HHD | CAPD | CPD | FTX | |
| Andalusia | 8,440,300 | 9193 | 1089.2 | 5575 | 3618 | 1336.7 | 847.4 | 4104 | 9 | 0 | 384 | 4696 | 486.2 | 1.1 | 0 | 45.5 | 556.4 |
| Aragon | 1,347,150 | 1504 | 1116.4 | 972 | 532 | 1450.8 | 785.6 | 549 | 2 | 65 | 5 | 883 | 407.5 | 1.5 | 48.3 | 3.7 | 655.5 |
| Asturias | 1,068,165 | 1209 | 1131.8 | 783 | 426 | 1531.3 | 765.1 | 430 | 0 | 51 | 62 | 666 | 402.6 | 0 | 47.7 | 58 | 623.5 |
| Balearic Islandsa | 1,017,395 | 945 | 928.8 | 598 | 347 | 1178.3 | 680.5 | 460 | 0 | 0 | 45 | 440 | 452.1 | 0 | 0 | 44.2 | 432.5 |
| Cantabria | 591,888 | 569 | 961.3 | 395 | 174 | 1368.5 | 573.8 | 174 | 2 | 29 | 7 | 357 | 294 | 3.4 | 49 | 11.8 | 603.2 |
| Castile and León | 2,519,875 | 2634 | 1045.3 | 1731 | 903 | 1388.8 | 709.1 | 1051 | 2 | 100 | 67 | 1414 | 417.1 | 0.8 | 39.7 | 26.6 | 561.1 |
| Castile-La Mancha | 2,100,998 | 2150 | 1023.3 | 1324 | 826 | 1252.6 | 791.2 | 811 | 3 | 80 | 44 | 1212 | 386 | 1.4 | 38.1 | 20.9 | 576.9 |
| Catalonia | 7,553,650 | 9533 | 1262 | 5975 | 3558 | 1603.9 | 929.4 | 4017 | 3 | 210 | 193 | 5110 | 531.8 | 0.4 | 27.8 | 25.6 | 676.5 |
| Autonomous Community of Valencia | 5,113,815 | 6295 | 1231 | 3889 | 2406 | 1534.4 | 932.8 | 3325 | 10 | 351 | 46 | 2563 | 650.2 | 2 | 68.6 | 9 | 501.2 |
| Extremadura | 1,104,004 | 1194 | 1081.5 | 735 | 459 | 1341.1 | 825.6 | 580 | 8 | 50 | 23 | 533 | 525.4 | 7.2 | 45.3 | 20.8 | 482.2 |
| Galicia | 2,765,940 | 3361 | 1215.1 | 2109 | 1252 | 1579.6 | 875 | 1473 | 7 | 193 | 88 | 1600 | 532.5 | 2.5 | 69.8 | 31.8 | 578.5 |
| Madrid | 6,495,551 | 6490 | 999.1 | 3991 | 2499 | 1277.6 | 741.1 | 2492 | 15 | 267 | 84 | 3632 | 383.6 | 2.3 | 41.1 | 12.9 | 559.2 |
| Murcia | 1,472,049 | 1767 | 1200.4 | 1111 | 656 | 1501.7 | 895.9 | 896 | 0 | 86 | 7 | 778 | 608.7 | 0 | 58.4 | 4.8 | 528.5 |
| Navarra | 644,477 | 753 | 1168.4 | 519 | 234 | 1617.2 | 723.2 | 271 | 4 | 11 | 20 | 447 | 420.5 | 6.2 | 17.1 | 31 | 693.6 |
| Basque Country | 2,191,682 | 2457 | 1121.1 | 1567 | 890 | 1466.2 | 792.6 | 741 | 3 | 164 | 28 | 1521 | 338.1 | 1.4 | 74.8 | 12.8 | 694 |
| La Rioja | 322,027 | 369 | 1145.9 | 233 | 136 | 1454.8 | 840.2 | 145 | 2 | 9 | 17 | 196 | 450.3 | 6.2 | 27.9 | 52.8 | 608.6 |
| Ceutab | 84,180 | 81 | 962.2 | 54 | 27 | 1254.1 | 656.6 | 81 | 0 | 0 | 0 | 0 | 962.2 | 0 | 0 | 0 | 0 |
| Melillab | 83,679 | 63 | 752.9 | 35 | 28 | 813.6 | 688.6 | 63 | 0 | 0 | 0 | 0 | 752.9 | 0 | 0 | 0 | 0 |
| Total in Spain | 44,916,825 | 50,567 | 1125.8 | 31,596 | 18,971 | 1430.1 | 831.2 | 21,658 | 75 | 1666 | 1120 | 26,048 | 482.2 | 1.7 | 37.1 | 24.9 | 579.9 |
CPD: cycling peritoneal dialysis; CAPD: continuous ambulatory peritoneal dialysis; CHD: centre haemodialysis; HHD: home haemodialysis; N: total number of cases; PMP: patients per million of the population; FTX: functioning kidney transplant.
Prevalence by age group in 2013 (PMP).
| 0–14 | 15–44 | 45–64 | 65–74 | >75 | |
|---|---|---|---|---|---|
| Andalusia | 34 | 455.9 | 1723.5 | 3090.4 | 2654.3 |
| Aragon | 37.4 | 395.4 | 1644.5 | 2674.1 | 2474.9 |
| Asturias | 51.7 | 412 | 1544.8 | 2348.7 | 2140.8 |
| Balearic Islands | 0 | 241.6 | 1348.7 | 2968.3 | 3577.3 |
| Cantabria | 0 | 431.6 | 1461.3 | 2543.2 | 1479.9 |
| Castile and León | 0 | 363.3 | 1477.3 | 2374.9 | 1960.1 |
| Castile-La Mancha | 3.1 | 373.1 | 1615.6 | 2984.7 | 2358.3 |
| Catalonia | 58.1 | 447.9 | 1846.3 | 3586 | 3288.1 |
| Autonomous Community of Valencia | 56.1 | 426.9 | 1726.7 | 3250.6 | 3409.2 |
| Extremadura | 6.3 | 423.3 | 1737.9 | 2492 | 2181.5 |
| Galicia | 27.5 | 471.7 | 1761.5 | 2855.2 | 2004.2 |
| Madrid | 36.5 | 376.3 | 1524.3 | 2864.9 | 2734.7 |
| Murcia | 34.6 | 421.5 | 1978.4 | 3606 | 3762.4 |
| Navarra | 0 | 267.9 | 1324.4 | 3084.3 | 4692.8 |
| Basque Country | 56.1 | 483.6 | 1524.7 | 2819.5 | 2134.9 |
| La Rioja | 0 | 516.2 | 1525.2 | 3392.9 | 2382.6 |
| Ceuta | 0 | 160.2 | 1837.5 | 4938.8 | 3150 |
| Melilla | 0 | 372.9 | 1139.1 | 2338.6 | 4397.3 |
| Total in Spain | 36.3 | 419.4 | 1669 | 3038.1 | 2712 |
PMP: patients per million of the population.

The adjusted overall prevalence rate in 2013 was 1087.5PMP; 1360.7PMP in males and 809.8PMP in females (Table 11 and Fig. 9).
Age-adjusted prevalence (EU27, 2005) 2013 (PMP).
| Male | Female | Total | |
|---|---|---|---|
| Murcia | 1600.8 | 971 | 1294.8 |
| Catalonia | 1555.6 | 917 | 1238.4 |
| Ceuta | 1568.5 | 838.1 | 1218.9 |
| Autonomous Community of Valencia | 1439 | 902.9 | 1177.6 |
| Andalusia | 1351.1 | 874 | 1113.9 |
| La Rioja | 1351.8 | 812 | 1091 |
| Navarra | 1455.8 | 678.1 | 1081.9 |
| Galicia | 1342.7 | 777.7 | 1058.6 |
| Aragon | 1291.5 | 726.5 | 1017.5 |
| Madrid | 1298.1 | 752.8 | 1016 |
| Basque Country | 1299.2 | 732.1 | 1015.1 |
| Castile-La Mancha | 1217.5 | 793.5 | 1014.9 |
| Extremadura | 1231 | 779.7 | 1011.2 |
| Melilla | 1004.9 | 956.8 | 989 |
| Balearic Islands | 1218.6 | 726.3 | 982.2 |
| Asturias | 1256.4 | 649.5 | 946.8 |
| Cantabria | 1241.6 | 547 | 893.6 |
| Castile and León | 1146.5 | 615.1 | 889.7 |
| Total | 1360.7 | 809.8 | 1087.5 |
PMP: patients per million of the population.

At the end of the year 2013 on 31 December 2013, 26,043 prevalent patients had a functioning kidney transplant (51.5%), while 21,656 (42.8%) received treatment in HD centers, 78 (0.15%) were on home HD; 1667 (3.3%) received continuous ambulatory peritoneal dialysis and 1120 (2.2%) received cycling PD (Table 9).
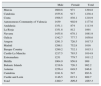
Regarding PRD in the prevalent patients, glomerulonephritis was the most common with 20.4% and 231PMP, followed by UO (20.3% and 229PMP) and DM (14.9% and 168PMP), although with marked differences among ARs (Figs. 10 and 11).


On December 31st 2013 among RRT patients on HD and PD in all their varieties, there were 1.8% with positive serology for hepatitis B surface antigen (HBV+), 6.9% were positive for the hepatitis C virus (HCV+) and 1.3% had positive serology for the human immunodeficiency virus (HIV+).
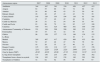
The overall prevalence in Spain show a progressive increase with values above 1000PMP since 2009 reaching 1125.8PMP in 2013 (Table 12 and Fig. 12). This increase, although it also occurred in patients in HD, was markedly reflected in patients with PD, and above all in transplant patients, who exceeded 50% starting in 2012 (Table 13 and Fig. 12).
Overall prevalence, unadjusted rate PMP 2007 to 2013 (PMP).
| 2007 | 2008 | 2009 | 2010 | 2011 | 2012 | 2013 | |
|---|---|---|---|---|---|---|---|
| Andalusia | 952.9 | 960.3 | 977.4 | 1004.1 | 1028.4 | 1054.1 | 1089.2 |
| Aragon | 789.7 | 950.3 | 998.2 | 994.7 | 1028.8 | 1071.5 | 1116.4 |
| Asturias | 1077.3 | 973.9 | 990.5 | 1030.1 | 1069.3 | 1131.8 | |
| Balearic Islands | 496.9 | 434.2 | 588.1 | 792 | 886.8 | 877.2 | 928.8 |
| Canary Islands | 994.6 | 607.4 | 1169.2 | 1143.3 | 680.4 | 1162.7 | |
| Cantabria | 844.9 | 834.9 | 874 | 883.1 | 891.9 | 931.2 | 961.3 |
| Castile and León | 935.8 | 965.5 | 994.3 | 1010.7 | 1014.7 | 1038.9 | 1045.3 |
| Castile-La Mancha | 927 | 911.4 | 929.2 | 964.6 | 997.5 | 1004.3 | 1023.3 |
| Catalonia | 1099.1 | 1123.7 | 1158.5 | 1188.4 | 1222.9 | 1200.1 | 1262 |
| Autonomous Community of Valencia | 1103.8 | 1098.9 | 1107.2 | 1130.9 | 1147.3 | 1195.1 | 1231 |
| Extremadura | 893.6 | 920.1 | 952.5 | 999.8 | 1026.7 | 1049.5 | 1081.5 |
| Galicia | 1047.8 | 1061.4 | 1079 | 1125.9 | 1171.6 | 1178.1 | 1215.1 |
| Madrid | 971.6 | 1077.2 | 907.8 | 926.7 | 956.6 | 970.1 | 999.1 |
| Murcia | 1117.6 | 1153 | 1200.4 | ||||
| Navarra | 485.2 | 486.8 | 472.6 | 500.8 | 1151 | 1137.2 | 1168.4 |
| Basque Country | 959.9 | 1016.6 | 1024.8 | 1019.6 | 1055.6 | 1093 | 1121.1 |
| La Rioja | 987.2 | 1124.4 | 1038.2 | 1045.2 | 1136.4 | 1072.3 | 1145.9 |
| Ceuta | 900.7 | 969.1 | 1004.1 | 1092.1 | 1031.9 | 1023.6 | 962.2 |
| Melilla | 1022.5 | 1007.7 | 803.2 | 789.1 | 828.3 | 841.6 | 752.9 |
| Total in Spain | 985.3 | 994.8 | 1015.7 | 1036.7 | 1054.6 | 1091.1 | 1125.8 |
PMP: patients per million of the population.
 overall and according to RRT modality 2007–2013.")
Evolution of the percentage of the different RRT modalities in prevalent patients 2007–2013.
| 2007 | 2008 | 2009 | 2010 | 2011 | 2012 | 2013 | |||||||||||||||
|---|---|---|---|---|---|---|---|---|---|---|---|---|---|---|---|---|---|---|---|---|---|
| HD (%) | PD (%) | TX (%) | HD (%) | PD (%) | TX (%) | HD (%) | PD (%) | TX (%) | HD (%) | PD (%) | TX (%) | HD (%) | PD (%) | TX (%) | HD (%) | PD (%) | TX (%) | HD (%) | PD (%) | TX (%) | |
| Andalusia | 48.6 | 4.5 | 46.9 | 48.9 | 4.1 | 47 | 48.2 | 4.3 | 47.5 | 47.7 | 4.3 | 47.9 | 46.1 | 4.3 | 49.6 | 45.1 | 4.4 | 50.5 | 44.7 | 4.2 | 51.1 |
| Aragon | 50.5 | 0.8 | 61.8 | 42 | 1.1 | 56.9 | 44.7 | 1.5 | 53.8 | 44.3 | 2.8 | 53 | 40.2 | 3.7 | 56.1 | 39.3 | 4.3 | 56.4 | 36.6 | 4.7 | 58.7 |
| Asturias | 32.7 | 4.5 | 51.2 | 37.4 | 5.4 | 57.2 | 37.3 | 5.7 | 57 | 37.7 | 5.8 | 56.5 | 37.4 | 5.9 | 56.6 | 35.7 | 9 | 55.3 | 35.6 | 9.3 | 55.1 |
| Balearic Islands | 91.5 | 8.5 | 91 | 9 | 92.6 | 7.4 | 47.1 | 3.8 | 49.1 | 44.7 | 4.5 | 50.7 | 47.9 | 4.9 | 47.3 | 48.7 | 4.8 | ||||
| Canary Islands | 54.4 | 4.4 | 41.1 | 91.8 | 8.2 | 72.7 | 50.5 | 5 | 44.5 | 51.6 | 5.8 | 42.6 | 89.7 | 10.3 | 49.2 | 5.3 | 45.4 | ||||
| Cantabria | 36.4 | 9.5 | 54.1 | 38.3 | 7 | 54.7 | 37.5 | 7.4 | 55.1 | 34.4 | 7.5 | 58.1 | 32.5 | 7.6 | 59.9 | 32.5 | 6.7 | 60.8 | 30.9 | 6.3 | 62.7 |
| Castile and León | 45.4 | 5.5 | 49.1 | 44.8 | 5.9 | 49.3 | 43.9 | 6.5 | 49.6 | 42.8 | 6.5 | 50.7 | 42 | 7 | 51 | 41.1 | 6.5 | 52.5 | 40 | 6.3 | 53.7 |
| Castile-La Mancha | 43 | 5.2 | 51.8 | 41.5 | 3.9 | 54.7 | 41.3 | 3.8 | 55 | 41.3 | 4.5 | 54.2 | 41% | 5.1 | 53.9 | 39.2 | 5.7 | 55.1 | 37.9 | 5.8 | 56.4 |
| Catalonia | 46.4 | 3.5 | 50.1 | 46.2 | 3.6 | 50.2 | 45.3 | 3.7 | 51 | 44.5 | 4 | 51.5 | 42.7 | 3.9 | 53.4 | 41 | 4.1 | 54.9 | 42.2 | 4.2 | 53.6 |
| Autonomous Community of Valencia | 56.5 | 4.3 | 39.2 | 56.7 | 3.8 | 39.3 | 56 | 3.5 | 40.5 | 56.2 | 3.4 | 40.3 | 55.2 | 4.9 | 39.8 | 54.6 | 5.5 | 40 | 53 | 6.3 | 40.7 |
| Extremadura | 49 | 5.9 | 45.2 | 48.6 | 6 | 45.3 | 48.9 | 6.2 | 45 | 50.6 | 5.9 | 43.5 | 49.3 | 5.8 | 45 | 49.2 | 6.4 | 44.5 | 49.3 | 6.2 | 44.5 |
| Galicia | 43.3 | 9.2 | 47.5 | 45.8 | 9.4 | 44.8 | 46.1 | 8.6 | 45.3 | 45.8 | 8.8 | 45.4 | 45 | 8.7 | 46.3 | 44.6 | 8.2 | 47.2 | 44 | 8.4 | 47.6 |
| Madrid | 35.5 | 7.3 | 57.2 | 36.4 | 5.1 | 58.4 | 41.4 | 5.9 | 52.7 | 40.4 | 5.7 | 53.9 | 39 | 5.5 | 55.5 | 38.5 | 5.6 | 56 | 38.6 | 5.4 | 56 |
| Murcia | 55.6 | 4 | 40.4 | 53.5 | 4.3 | 42.2 | 50.7 | 5.3 | 44 | ||||||||||||
| Navarra | 89.5 | 10.5 | 111.2 | 90.4 | 11.3 | 117.9 | 78.2 | 12.8 | 0 | 89 | 11.3 | 123.2 | 37.8 | 5.1 | 57.1 | 37.1 | 4.8 | 58.1 | 36.5 | 4.1 | 59.4 |
| Basque Country | 30 | 8.3 | 61.7 | 31.5 | 7.7 | 60.8 | 29.6 | 7.8 | 62.6 | 31.5 | 8.1 | 60.4 | 31.5 | 8.7 | 59.8 | 31.2 | 8.2 | 60.6 | 30.3 | 7.8 | 61.9 |
| La Rioja | 37.7 | 4.9 | 57.4 | 37.3 | 4.5 | 51.3 | 44.9 | 3.3 | 51.8 | 41.2 | 8 | 55.8 | 39.5 | 6.8 | 53.7 | 42.9 | 8.6 | 48.4 | 39.8 | 7 | 53.1 |
| Ceuta | 100 | 0 | 100 | 0 | 100 | 0 | 100 | 0 | 100 | 0 | 100 | 0 | 100 | 0 | |||||||
| Melilla | 100 | 0 | 97.2 | 0 | 100 | 0 | 100 | 0 | 96.9 | 3.1 | 97.1 | 2.9 | 100 | 0 | |||||||
| Total in Spain | 46.2 | 5.3 | 49.3 | 47.1 | 5 | 50.8 | 46.5 | 5 | 48.5 | 46 | 5.1 | 49.8 | 45.6 | 5.4 | 49 | 43.7 | 5.4 | 50.9 | 43 | 5.5 | 51.5 |
PD: peritoneal dialysis; HD: haemodialysis; RRT: renal replacement treatment; TX: transplant.
In Spain, during 2013, there were 2552 kidney transplants performed in Spain, with a rate of 47.12PMP. Based on donor type, 382 (14.97%) were from a living donor and 200 (7.8%) were from a donor who was deceased by circulatory and respiratory criteria (asystole). In 67 cases the transplant recipient was a child under 16 years of age (Table 14).
Kidney transplants by AR of the transplant centre. 2013.
| AR/HOSPITAL | Total in 2013 | Chi | Asyst | Living | DK | EB |
|---|---|---|---|---|---|---|
| Andalusia | 412 | 11 | 32 | 60 | 3 | |
| Aragon | 85 | 11 | ||||
| Asturias | 48 | 5 | 1 | |||
| Balearic Islands | 39 | |||||
| Canary Islands | 101 | 3 | 12 | |||
| Cantabria | 61 | 4 | 6 | |||
| Castile-La Mancha | 94 | 6 | 0 | 2 | ||
| Castile and León | 108 | 6 | 3 | |||
| Catalonia | 540 | 21 | 25 | 165 | 1 | 1 |
| Autonomous Community of Valencia | 237 | 7 | 13 | 8 | 4 | |
| Extremadura | 30 | |||||
| Galicia | 132 | 2 | 28 | |||
| La Rioja | 16 | 1 | ||||
| Madrid | 406 | 19 | 104 | 40 | 2 | |
| Murcia | 61 | 4 | ||||
| Navarra | 26 | 2 | ||||
| Basque Country | 156 | 9 | 4 | 38 | ||
| Total in Spain | 2552 | 67 | 200 | 382 | 9 | 5 |
Asyst: transplant from a deceased donor in asystole; EB: en bloc double kidney transplant from a child donor; DK: double kidney transplant and older donor; AR: autonomous region; Chi: transplant in children under 15 years of age; Living: transplant from a living donor.
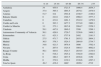
From 2007 to 2013, the number of kidney transplants increased by 15.4%, and the rate PMP increased by more than 5 points, from 48.9PMP to 54.2PMP. This increase is mostly due to the increase in donations by living donors and in the use of organs from deceased donors in asystole (Table 15 and Fig. 13).
Kidney transplants overall and by AR 2007–2013.
| Autonomous region | 2007 | 2008 | 2009 | 2010 | 2011 | 2012 | 2013 |
|---|---|---|---|---|---|---|---|
| Andalusia | 344 | 367 | 381 | 330 | 426 | 457 | 412 |
| Aragon | 63 | 55 | 66 | 65 | 74 | 68 | 85 |
| Asturias | 54 | 40 | 46 | 43 | 53 | 50 | 48 |
| Balearic Islands | 28 | 46 | 45 | 43 | 43 | 52 | 39 |
| Canary Islands | 145 | 126 | 103 | 104 | 116 | 91 | 101 |
| Cantabria | 41 | 27 | 46 | 42 | 48 | 36 | 61 |
| Castile-La Mancha | 36 | 51 | 51 | 54 | 59 | 55 | 94 |
| Castile and León | 83 | 86 | 79 | 93 | 85 | 117 | 108 |
| Catalonia | 470 | 471 | 524 | 460 | 581 | 559 | 540 |
| Autonomous Community of Valencia | 231 | 198 | 209 | 209 | 190 | 232 | 237 |
| Extremadura | 30 | 35 | 33 | 32 | 44 | 34 | 30 |
| Galicia | 96 | 120 | 127 | 131 | 146 | 138 | 132 |
| La Rioja | 10 | 5 | 16 | ||||
| Madrid | 395 | 407 | 417 | 420 | 406 | 432 | 406 |
| Murcia | 52 | 45 | 48 | 47 | 54 | 76 | 61 |
| Navarra | 18 | 26 | 35 | 25 | 40 | 32 | 26 |
| Basque Country | 125 | 129 | 118 | 127 | 123 | 117 | 156 |
| Total in Spain | 2211 | 2229 | 2328 | 2225 | 2498 | 2551 | 2552 |
| Total in Spain (PMP) | 48.92 | 48.29 | 49.80 | 47.32 | 52.93 | 53.97 | 54.15 |
| Living donor transplants | 137 | 156 | 235 | 240 | 312 | 361 | 382 |
| Transplants from a donor in asystole | 104 | 105 | 145 | 158 | 140 | 201 | 200 |
| Transplants in Children | 72 | 62 | 62 | 58 | 63 | 59 | 67 |
AR: autonomous region; PMP: patients per million of the population.

The percentage of transplant patients that returned to dialysis (HD or PD) due to transplant failure remained stable at around 2.5% (Fig. 14).
Mortality
The overall mortality of patients in RRT remained stable around 8% annually throughout the period 2007–2013. Mortality remain stable in the three modalities of RRT (HD, PD and transplant), although there was a very modest increase in mortality in transplant patients, which continues to be the lowest of the 3 modalities (Table 16).
Evolution of annual mortality 2007–2013, by treatment modality (%).
| 2007 | 2008 | 2009 | 2010 | 2011 | 2012 | 2013 | |
|---|---|---|---|---|---|---|---|
| Mortality in HD | 15.27 | 14.52 | 14.79 | 14.60 | 14.12 | 14.43 | 15.1 |
| Mortality in PD | 8.79 | 10.54 | 8.44 | 8.13 | 8.07 | 8.85 | 8.86 |
| Mortality in TX | 1.64 | 1.50 | 1.89 | 1.67 | 1.85 | 2.31 | 2.35 |
| Overall | 8.46 | 8.34 | 8.36 | 8.24 | 7.78 | 7.96 | 8.18 |
PD: peritoneal dialysis; HD: haemodialysis; TX: transplant.
Between 2004 and 2012 there were 40,394 incident patients that met the selection criteria. Tables 17 and 18 show the distribution by AR and year.
Distribution by AR of the incident patients 2004–2012 included in the survival analysis.
| Autonomous Region | 2004–2012 N (%) |
|---|---|
| Andalusia | 8175 (20.2) |
| Aragon | 1478 (3.6) |
| Asturias | 1197 (3) |
| Cantabria | 575 (1.4) |
| Castile-La Mancha | 1943 (4.8) |
| Castilla y León | 2697 (6.7) |
| Catalonia | 8539 (21.1) |
| Autonomous Community of Valencia | 6119 (15.1) |
| Extremadura | 1113 (2.8) |
| Galicia | 3121 (7.1) |
| Madrid | 3298 (8.8) |
| Basque Country | 2159 (5.3) |
| Total | 40,394 (100) |
AR: autonomous region; N: number of cases.
Distribution by year of the incident patients 2004–2012 included in the survival analysis.
| Year of inclusion | N (% compared to total) |
|---|---|
| 2004 | 4056 (10.0) |
| 2005 | 4093 (10.1) |
| 2006 | 4093 (10.1) |
| 2007 | 4204 (10.4) |
| 2008 | 4972 (12.3) |
| 2009 | 4938 (12.2) |
| 2010 | 4802 (11.9) |
| 2011 | 4664 (11.5) |
| 2012 | 4572 (11.3) |
| Total | 40,394 (100) |
N: number of cases.
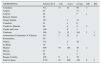
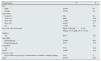
Table 19 shows the main characteristics of the sample.
Characteristics of the patients included in the survival analysis 2004–2012.
| Characteristics | N | % |
|---|---|---|
| Sex | ||
| Male | 25,858 | 64 |
| Female | 14,536 | 36 |
| Age groups | ||
| Under 20 | 166 | 0.4 |
| 20 to <45 | 5086 | 12.6 |
| 45 to <65 | 12,826 | 31.8 |
| 65 to <75 | 10,923 | 27 |
| 75+ | 11,393 | 28.2 |
| Age at the start of treatment | Mean: 64.06 (SD=15.16) | |
| Median: 67.28 (IQR: 54.54–75.94) | ||
| Diabetes | ||
| Yes | 8533 | 21.1 |
| Initial RRT | ||
| Haemodialysis | 34,869 | 86.3 |
| Peritoneal dialysis | 5515 | 13.7 |
| Transplant | ||
| Yes | 7772 | 19.2 |
| Death | 13,867 | 34.3 |
| Censure events | ||
| (loss to follow-up, recovery of renal function or transfer to another registry) | 1212 | 3 |
| Total | 40,394 | 100 |
SD: standard deviation; N: number of cases; IQR: interquartile range; RRT: renal replacement treatment.
Estimated median survival was 6.2 years, with a 95% confidence interval of 6.1 and 6.4.
The unadjusted probability of survival was 91%, 81% and 57% after one, 2 and 5 years, respectively, as shown in Table 20.
Table 21 presents the adjusted survival analysis; those variables that had turned out to be significant in the univariate analysis were included as potential predictive factors.
Cox model.
| Variable | HR | 95% CI | p |
|---|---|---|---|
| Age group | |||
| 15–19 years | 0.47 | 0.20–1.14 | 0.96 |
| 20–44 years | 1 | – | 0.000 |
| 45–64 years | 2.7 | 2.41–2.99 | 0.000 |
| 65–74 years | 4.44 | 3.99–4.93 | 0.000 |
| ≥75 years | 6.35 | 5.71–7.06 | 0.000 |
| Diabetes as PRD | 1.28 | 1.23–1.33 | 0.000 |
| Female sex | 0.86 | 0.83–0.90 | 0.000 |
| PD as initial RRT | 0.91 | 0.85–0.96 | 0.001 |
| Transplant | 0.16 | 0.15–0.18 | 0.000 |
PD: peritoneal dialysis; PRD: primary renal disease; HR: hazard ratio; 95% CI: 95% confidence interval; RRT: renal replacement treatment.
The Cox model shows the following as independent factors of survival: age, diabetes as PRD, transplanted, sex and modality of initial RRT (Table 21), survival being worse for diabetic men over 45 years of age who had started RRT with HD and who had not undergone a transplant.
Fig. 15 shows the survival curves for the incident patients during the period 2004–2012 based on age group.
Discussion and conclusions
Over the course of these 7 years, the REER was able to collect and assemble information about a percentage above 95% of the population of Spain reaching 100% in 2012, this is despite the occasional difficulties of some of the autonomous region registries. Therefore, the future objective should be to cover 100% of the population every year, with a tendency to group individualised data from an ever greater number of registries, until a total coverage throughout Spain is achieved. Likewise, the quality of data collected is improved, as demonstrated by the temporal coherence of the data.
Annual incidence sustained a gradual decrease, although in 2013 we observed a rise that will have to be confirmed as a result of either a change in the trend or simply a temporary isolated increase. The evolution of incidence in the different varieties of RRT showed the marked decrease in HD as an initial treatment, which went from 86.4% in 2007 to 78.9% in 2013, while the percentage of patients who started RRT with PD increased from 11.9% in 2007 to 16.9% in 2013, and those who had undergone a transplant without previous treatment with HD or PD increased from 1.7% in 2007 to 4.2% in 2013.
The total number of prevalent patients with ESRD in RRT grew from one year to the next, and exceeded 1000PMP in 2010, essentially owing to an increase in functioning kidney transplants, which represented 49.3% in 2007 and 51.5% in 2013.
International comparisonsComparisons were made with countries with international registries available when the present manuscript was written. The latest USRDS report20 included data on 2012 and the evolution of the epidemiological data for ESRD from 2006 to 2012.
IncidenceThe incidence rate of the countries whose data were collected by the USRDS in 2012 ranged from 25PMP in Ukraine to 450 in Taiwan and 467 in Jalisco (Mexico). Spain (121PMP) was in the below the middle of the table, with numbers similar to those of western European countries with similar characteristics (Fig. 16). In these seven years there was a 3.1% decrease, in the same range that Australia (−3.1%), Canada (−4.5%), the Netherlands (−3.3%), Norway (−3.9%) and Israel (−3.9%). Some European countries experienced an even more marked decrease in incidence: Austria (−10.3%), Czech Republic (−7.2%), Denmark (−9.7%), Finland (−7.6%) and Sweden (−7.9%) (Fig. 17).
 by country in 2012.")
Unadjusted incidence rate (PMP) by country in 2012.
 by country, 2000 to 2012, in countries whose incidence rate decreased by at least 3% from 2006 to 2012.")
Evolution of the ESRD incidence rate (PMP) by country, 2000 to 2012, in countries whose incidence rate decreased by at least 3% from 2006 to 2012.
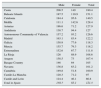
The percentage of DM as PRD varied widely among countries (Fig. 18), with the highest rates in Singapore (66%), Malaysia (61%) and Jalisco (Mexico) (59%), while it represented less than 20% in Flemish Belgium, Russia, Norway, the Netherlands, Romania and Ukraine.

Percentage of incident patients with ESRD, in whom diabetes mellitus was the primary renal disease, by country, in 2012.
The prevalence at December 31st 2012 was 2902PMP in Taiwan, 2365PMP in Japan and 1976PMP in United States, while in Bahrain, Qatar, Indonesia, Russia, South Africa and Ukraine less than 300PMP received RRT; Spain, with 1091, was in the upper third of the table In the majority of western European countries the range was between 808PMP in Finland to 1670PMP in Portugal (Fig. 19). From 2006 to 2012 Spain unadjusted prevalence increased by 12.9%, similar to the countries around i (Fig. 20), although the prevalence of treatment with dialysis has decreased by 0.4% with the consequent increase in the numbers of transplanted patients and with a functioning graft.

Prevalence of ESRD in RRT, PMP by country, in 2012.

Trend in the prevalence of ESRD in RRT, PMP by country, in 2012.
In accordance with the 2014 USRDS report,20 there was major variability in transplant rates among reporting countries, which did not only reflect the variations in incidence and prevalence reported. The highest transplant rate reported, 60PMP in Norway, was 30 times higher than the lowest transplant rate reported, 2PMP in Ukraine. The highest rates of kidney transplant for all donor types were those reported by Norway (60PMP), Jalisco (Mexico) (59PMP), the Netherlands (57PMP), the United States (55PMP), Croatia (54PMP) and Spain (54PMP) (Fig. 21): Although, according to the data of the Global Observatory on Donation and Transplantation (GODT),21 the highest rate of kidney transplant from a deceased donor is 50.5PMP in Croatia followed by Spain (46.8PMP), Belgium (44.4PMP), Estonia (43.9PMP) and Norway (43.6PMP) (Fig. 22).

Rate of kidney transplant, PMP, by country, in 2012.

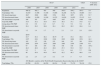
The evolution of the annual rate of transplants from 2006 to 2012 showed an increase in the overall rate in countries of the European Union and all countries of the World Health Organization that reported to the GODT21 (Table 22). The increase observed in Spain is comparatively much higher, with an 18.3% increase in total kidney transplants, with the extraordinary contribution of transplants from a living donor (253.9%) and from deceased donors in asystole (107.2%).
Evolution of kidney transplants 2006–2012.
| EU27 | UE28 | % increase 2006–2012 | ||||||
|---|---|---|---|---|---|---|---|---|
| 2006 | 2007 | 2008 | 2009 | 2010 | 2011 | 2012 | ||
| Population | 488.42 | 492.3 | 493 | 500 | 501.6 | 504.2 | 507.5 | 3.9 |
| Total kidney TXs | 16,819 | 17,306 | 17,198 | 17,886 | 18,246 | 18,712 | 19,085 | 13.5 |
| TX from living donor | 2617 | 2926 | 3089 | 3354 | 3616 | 3857 | 3970 | 51.7 |
| TX from deceased donor | 14,204 | 14,380 | 14,109 | 14,532 | 14,630 | 14,855 | 15,115 | 6.4 |
| TX from donor in asystole | 598 | 707 | 837 | 1007 | 1037 | 1178 | 1400 | 134.1 |
| Total TXs PMP | 34.4 | 35.2 | 34.9 | 35.8 | 36.4 | 37.1 | 37.6 | 9.2 |
| Living donor TX PMP | 5.4 | 5.9 | 6.3 | 6.7 | 7.2 | 7.6 | 7.8 | 46 |
| TX from deceased donor PMP | 29.1 | 29.2 | 28.6 | 29.1 | 29.2 | 29.5 | 29.8 | 2.4 |
| TX from donor in asystole PMP | 1.2 | 1.4 | 1.7 | 2 | 2.1 | 2.3 | 2.8 | 125.3 |
| Spain | ||||||||
| Population | 44.7 | 45.2 | 46.2 | 46.75 | 47 | 47.2 | 46.8 | 4.7 |
| Total kidney TXs | 2157 | 2211 | 2229 | 2328 | 2225 | 2498 | 2551 | 18.3 |
| TX from living donor | 102 | 137 | 156 | 235 | 240 | 312 | 361 | 253.9 |
| TX from deceased donor | 2055 | 2074 | 2073 | 2093 | 1985 | 2186 | 2190 | 6.6 |
| TX from donor in asystole | 97 | 104 | 105 | 148 | 158 | 140 | 201 | 107.2 |
| Total TXs PMP | 48.3 | 48.9 | 48.2 | 49.8 | 47.3 | 52.9 | 54.5 | 13 |
| Living donor TX PMP | 2.3 | 3 | 3.4 | 5 | 5.1 | 6.6 | 7.7 | 238 |
| TX from deceased donor PMP | 46 | 45.9 | 44.9 | 44.8 | 42.2 | 46.3 | 46.8 | 1.8 |
| TX from donor in asystole PMP | 2.2 | 2.3 | 2.3 | 3.2 | 3.4 | 3 | 4.3 | 97.9 |
| 103 Member countries of the World Health Organization that provided data to the GODT | ||||||||
| Total kidney TXs | 65,700 | 65,511 | 68,250 | 69,214 | 71,418 | 73,179 | 76,118 | 15.9 |
GODT: Global Observatory on Donation and Transplantation; PMP: patients per million of the population; TX: transplant.
Comparisons with international data20,22 with respect to the survival of patients in RRT were limited by differences in the methodology used for analysis and data processing as well as differences in the analysis of cohorts followed through different periods of time.
Conflicts of interestThe author has no conflicts of interest to declare.
Spanish Transplant Organisation: Eduardo Martín-Escobar, Beatriz Mahillo Durán; Spanish Society of Nephrology (SEN): J. Emilio Sánchez, Ramón Saracho Rotaeche; Andalusia Renal Registry (SICATA): Pablo Castro de la Nuez, Miguel Ángel Gentil Govantes; Aragon Renal Registry: José M. Abad Diez, José Ignacio Sánchez Miret; Asturias Renal Registry: Ramón Alonso de la Torre, José Ramón Quirós García; Balearic Islands Renal Registry: Catalina Garrigó; Valencia Renal Registry (REMRENAL): Manuel Ferrer-Alamar, Oscar Zurriaga Llorens; Cantabria Renal Registry: Manuel Arias, Óscar García Ruiz; Castilla-La Mancha Renal Registry: Gonzalo Gutierrez Ávila, Inmaculada Moreno Alía; Castilla y León Renal Registry: Raquel Gonzalez Fernández, José María Monfá Bosch; Catalonia Renal Registry: Jordi Comas Farnes, Emma Arcos Fuster; Extremadura Renal Registry: María A. García Bazaga, Julian Mauro Ramos Aceitero; Galicia Renal Registry: Encarnación Bouzas Caamaño, Teresa García Falcón, Jacinto Sánchez Ibañez; La Rioja Renal Registry: Enma Huarte-Loza, Marta Artamendi Larrañaga; Madrid Renal Registry (REMER): Manuel Aparicio Madre, José A. Herrero; Murcia Renal Registry: Carmen Santiuste de Pablos; Navarra Renal Registry: Jesús Arteaga Coloma; Basque Country Renal Registry: Angela Magaz Lago, Iñigo Moina Eguren.
Please cite this article as: Martín Escobar E. Registro Español de Enfermos Renales. Informe 2013 y evolución 2007-2013. Nefrologia. 2016;36:97–120.
The names of the components of the Registro Español de Enfermos Renales (REER) are listed in Annex 1.


AL DÍA

