

Mortality among hemodialysis patients remains high. An elevated ultrafiltration rate adjusted by weight (UFR/W) has been associated with hypotension and higher risk of death and/or cardiovascular events.
MethodsWe evaluated the association between UFR/W and mortality in 215 hemodialysis patients. The mean follow-up was 28 ± 6.12 months. We collected patients’ baseline characteristics and mean UFR/W throughout the follow-up.
ResultsMean UFR/W was 9.0 ± 2,4 and tertiles 7.1 y 10.1 mL/kg/h. We divided our population according to the percentage of sessions with UFR/W above the limits described in the literature associated with increased mortality (10.0 ml/kg/h and 13.0 mL/kg/h). Patients with higher UFR/W were younger, with higher interdialytic weight gain and weight reduction percentage but lower dry, pre and post dialysis weight. Throughout the follow-up, 46 (21.4%) patients died, the majority over 70 years old, diabetic or with cardiovascular disease. There were neither differences regarding mortality between groups nor differences in UFR/W among patients who died and those who did not. Contrary to previous studies, we did not find an association between UFR/W and mortality, maybe due to a higher prevalence in the use of cardiovascular protection drugs and lower UFR/W.
ConclusionsThe highest UFR/W were observed in younger patients with lower weight and were not associated with an increased mortality.
La mortalidad de los pacientes en hemodiálisis es alta. Una tasa de ultrafiltración horaria ajustada por peso (UFR/W) elevada se ha asociado a episodios de hipotensión arterial y mayor riesgo de muerte y/o eventos cardiovasculares.
Material y métodosHemos evaluado la asociación entre UFR/W y mortalidad en 215 pacientes en hemodiálisis prevalentes seguidos durante 28 ± 6,12 meses. Se estimaron características clínicas basales y UFR/W media a lo largo del seguimiento.
ResultadosLa UFR/W media fue 9,0 ± 2,4 y los terciles 7,1 y 10,1 mL/kg/h. Se categorizó a la población en función del tiempo que habían estado con UFR/W igual o superior a los puntos de corte descritos en la literatura como asociados a mayor mortalidad (10,0 mL/kg/h y 13,0 mL/kg/h). Los pacientes con mayor UFR/W fueron más jóvenes, con mayor ganancia de peso interdiálisis y porcentaje de reducción de peso, pero con menor peso seco, inicial y final. Durante el seguimiento, fallecieron 46 (21,4%) pacientes de los cuales la mayoría eran >70 años, diabéticos o con enfermedad cardiovascular. No hubo diferencias en mortalidad entre los grupos de UFR/W ni diferencias en la UFR/W entre los fallecidos y no fallecidos. En comparación con estudios previos donde describieron la asociación entre UFR/W y mortalidad, en nuestra población había más prevalencia de medicación protectora cardiovascular y no se observaron UFR/W tan altas.
ConclusiónEn nuestro medio, la UFR/W más elevada se observó en pacientes más jóvenes y de menor peso y no se asoció a mayor mortalidad.
Chronic kidney disease (CKD) is a health problem that in Spain affects more than 60,000 patients undergoing renal replacement therapy, including dialysis and kidney. transplantation.1 The survival of people with CKD, especially those on dialysis, is lower than that of the general population.2,3 The main cause of the high mortality is the increased risk of cardiovascular disease,4,5 which is due both to the high prevalence of classic cardiovascular risk factors (cardiovascular disease, hypertension, diabetes mellitus),6 and to specific factors of uremia, known as emerging, among which are anemia,7 bone mineral disease and loss of residual kidney function, as well as complications associated with factors of the dialysis technique itself, among which we find excessive ultrafiltration (UF) and intradialysis hypotension.8,9
The cardiovascular risk factors related to the hemodialysis technique itself are potentially modifiable. Although urea kinetics (KT/Vurea) is a marker of adequate dialysis, in some centers it conditions the duration of each therapy,10 which could lead to short sessions if based only on this indicator. This model is common in the United States where by following a correct KT/Vurea, short dialysis sessions are frequent increasing cardiovascular risk,11 among other reasons, short dialysis requires high hourly UFs that may increase the risk of hypotension.12
UF is a modifiable parameter and it has been described that it has a direct impact on the survival of the patient.13 It is determined by the amount of fluid removed or ultrafiltered, and varies with the interdialytic weight gain (IWG) and the rapidity in which it is removed. A high hourly weight-adjusted ultrafiltration rate (UFR/W) increases the probability of arterial hypotension and the risk of cardiovascular mortality in conventional hemodialysis.14,15,16–18 An increase in mortality has been described in patients with an hourly ultrafiltration ratio (UFR) of 6 mL/kg/h, and the increased mortality is being significant with UFR above 10 mL/kg/h.19
Episodes of hypotension intradialysis are associated with higher cardiovascular mortality,20 arrhythmias, myocardial microinfarctions21 which are the cause of “myocardial stunning”,22 in addition to cerebral microinfarctions. The greater susceptibility to myocardial ischemia is due to the high prevalence of coronary atheromatosis and ventricular hypertrophy in these patients,23 even in the absence of significant coronary lesion.24,25 Hypotension is also associated with an increased risk of thrombosis of the vascular access.26
Presently, the UFR has been adjusted to the patient's weight, and it is expressed as mL/kg/h26 and different studies have established a threshold of UFR/W of 10–13 mL/kg/h as the maximum rate, more fluid removal will require an increased in the duration of dialysis sessions, since above these limits there has been described an association with excess mortality.19,27,28 However, many of these studies come from populations where the standards of health care (dialysis guidelines, access to health care and medication) or the characteristics of the population are not equivalent to Spain. Therefore, we have addressed the relationship between UFR/W and mortality in a dialysis unit in Spain.
MethodsObservational studyWe conducted a prospective observational study in 215 prevalent hemodialysis patients at the Fundación Jiménez Díaz Hospital (FJD) and the Santa Engracia hemodialysis center. The study was presented in the FJD Ethics Committee, it complies with the Helsinki Declaration of Ethical Principles for Medical Research in Human Beings and the European Union Directive on Clinical Trials (2001/20/CE). The exclusion criteria were being on dialysis for less than three months and those receiving dialysis incremental hemodialysis. The data were collected between January 1, 2017 and June 30, 2019. At the beginning of the study, the following information was collected from the clinical history: (a) demographic: age, sex, hypertension, diabetes mellitus, peripheral vascular disease, heart failure and ischemic heart disease; (b) medication; (c) blood analytical data: albumin, total proteins, sodium, potassium and troponin I; (d) characteristics of dialysis at the beginning of the study and during the follow-up time collected through the Nefrosoft program: duration of the session, total weekly duration, dry weight (calculated by clinical assessment and bioimpedance, which was repeated monthly), IWG, total volume of UF, hourly UFR (mL/h) and adjusted by dry weight (UFR/W, mL/kg/h), percentage of weight reduction and total time on dialysis. Regarding the hemodialysis regimen, none of the patients included in the study were on an incremental dialysis program, the percentage of online hemodialysis was 50%, and all individuals were treated with high-flow devices. Furthermore, the UF rates were constant throughout the session, without using automatic UF guidelines, thus maintaining a constant UF. UF profiles were used very rarely, as we preferred an increase in sessions or sodium profiles. Also, the type of vascular access, the characteristics of the dialysis bath (calcium and potassium), the blood pressure before and after hemodialysis, as well as the percentage of reduction in intradialysis blood pressure and the ventricular ejection fraction have been taken into account. left (LVEF). During the follow-up time, mortality and cause of death were recorded. Data on residual diuresis were not collected.
We analyzed the association between mortality and the mean UFR/W of all hemodialysis sessions during the study period. It was also evaluated whether ≥25 or ≥50% of sessions had UFR/W ≥ 10 and ≥13 mL/kg/h, since this is the maximum safe UFRs widely defined in the literature.19,27,28 In our unit, the UF rate tend to be low, especially in those patients with reduced tolerance, who are usually those with a higher cardiovascular risk or more fragile. Thus, we increase the duration or the frequency of sessions which is an important difference with countries like the USA where dialysis is carried out in short times enough, to obtain sufficient KT/Vurea, without taking into account other factors. The economic aspects are fundamental, so unstable patients may have high UFs. This concept of individualization may reduce mortality.
Literature analysisIn order to understand the divergence of the results obtained in this study with those published, we have compared the characteristics of the population studied with that of the two largest studies carried out in a western population that have provided the cut-off points generally used in literature.
Statistical analysisQuantitative variables were described by means and standard deviation or by median and interquartile range. The qualitative variables were defined by absolute and relative frequencies. To compare the different groups based on the UFR/W ranges and mortality, the Student’s t test or the Mann–Whitney U test were used in the quantitative variables, and the X 2 test or Fisher’s F in the quantitative variables. qualitative variables. In order to assess the ability of UFR/W values to discriminate between living and deceased patients, the receiver operating characteristic (ROC) curve and the area under it were obtained, along with its 95% confidence interval.
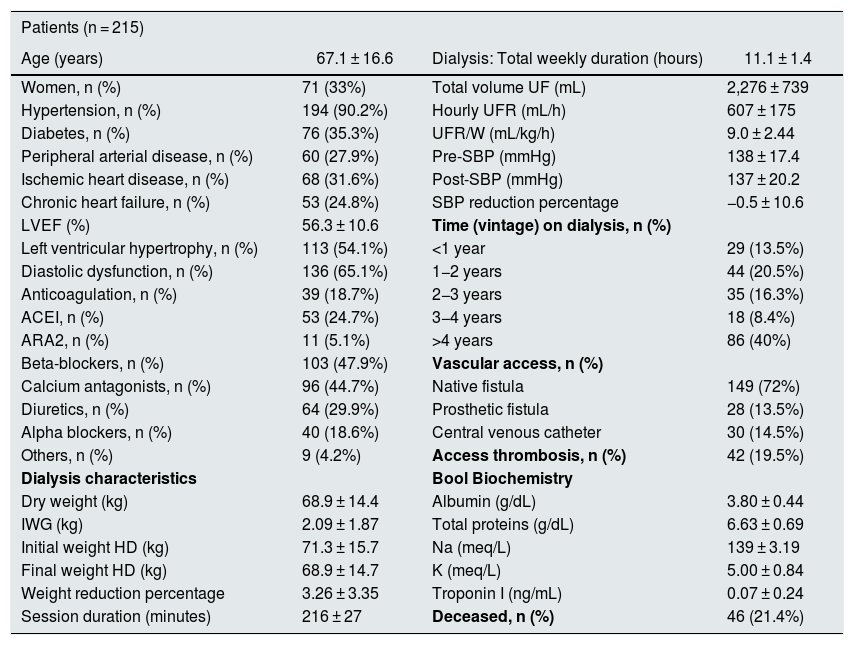
ResultsDescription of the population studiedThe baseline characteristics of the 215 patients analyzed are represented in Table 1. This is a population with a majority of men, of a similar age to the mean of the Spanish dialysis population, with frequent comorbidity and use of diuretics in almost 30%. The mean UFR/W was 9.0 ± 2.4 mL/kg/h and the tertiles 7.1 and 10.1 mL/kg/h.
Baseline characteristics of the studied population.
| Patients (n = 215) | |||
|---|---|---|---|
| Age (years) | 67.1 ± 16.6 | Dialysis: Total weekly duration (hours) | 11.1 ± 1.4 |
| Women, n (%) | 71 (33%) | Total volume UF (mL) | 2,276 ± 739 |
| Hypertension, n (%) | 194 (90.2%) | Hourly UFR (mL/h) | 607 ± 175 |
| Diabetes, n (%) | 76 (35.3%) | UFR/W (mL/kg/h) | 9.0 ± 2.44 |
| Peripheral arterial disease, n (%) | 60 (27.9%) | Pre-SBP (mmHg) | 138 ± 17.4 |
| Ischemic heart disease, n (%) | 68 (31.6%) | Post-SBP (mmHg) | 137 ± 20.2 |
| Chronic heart failure, n (%) | 53 (24.8%) | SBP reduction percentage | −0.5 ± 10.6 |
| LVEF (%) | 56.3 ± 10.6 | Time (vintage) on dialysis, n (%) | |
| Left ventricular hypertrophy, n (%) | 113 (54.1%) | <1 year | 29 (13.5%) |
| Diastolic dysfunction, n (%) | 136 (65.1%) | 1−2 years | 44 (20.5%) |
| Anticoagulation, n (%) | 39 (18.7%) | 2−3 years | 35 (16.3%) |
| ACEI, n (%) | 53 (24.7%) | 3−4 years | 18 (8.4%) |
| ARA2, n (%) | 11 (5.1%) | >4 years | 86 (40%) |
| Beta-blockers, n (%) | 103 (47.9%) | Vascular access, n (%) | |
| Calcium antagonists, n (%) | 96 (44.7%) | Native fistula | 149 (72%) |
| Diuretics, n (%) | 64 (29.9%) | Prosthetic fistula | 28 (13.5%) |
| Alpha blockers, n (%) | 40 (18.6%) | Central venous catheter | 30 (14.5%) |
| Others, n (%) | 9 (4.2%) | Access thrombosis, n (%) | 42 (19.5%) |
| Dialysis characteristics | Bool Biochemistry | ||
| Dry weight (kg) | 68.9 ± 14.4 | Albumin (g/dL) | 3.80 ± 0.44 |
| IWG (kg) | 2.09 ± 1.87 | Total proteins (g/dL) | 6.63 ± 0.69 |
| Initial weight HD (kg) | 71.3 ± 15.7 | Na (meq/L) | 139 ± 3.19 |
| Final weight HD (kg) | 68.9 ± 14.7 | K (meq/L) | 5.00 ± 0.84 |
| Weight reduction percentage | 3.26 ± 3.35 | Troponin I (ng/mL) | 0.07 ± 0.24 |
| Session duration (minutes) | 216 ± 27 | Deceased, n (%) | 46 (21.4%) |
ARA2: angiotensin receptor 2 antagonists; LVEF, left ventricular ejection fraction; IWG: interdialysis weight gain; ACEI: angiotensin converting enzyme inhibitor; SBP: systolic blood pressure; Pre-SBP: predialysis SBP; Post-SBP: post-dialysis SBP; UF: ultrafiltration; UFR: hourly ultrafiltration; UFR/W: hourly ultrafiltration adjusted by weight. IWG and mean hourly UFR of all follow-up period; HD: hemodialysis.
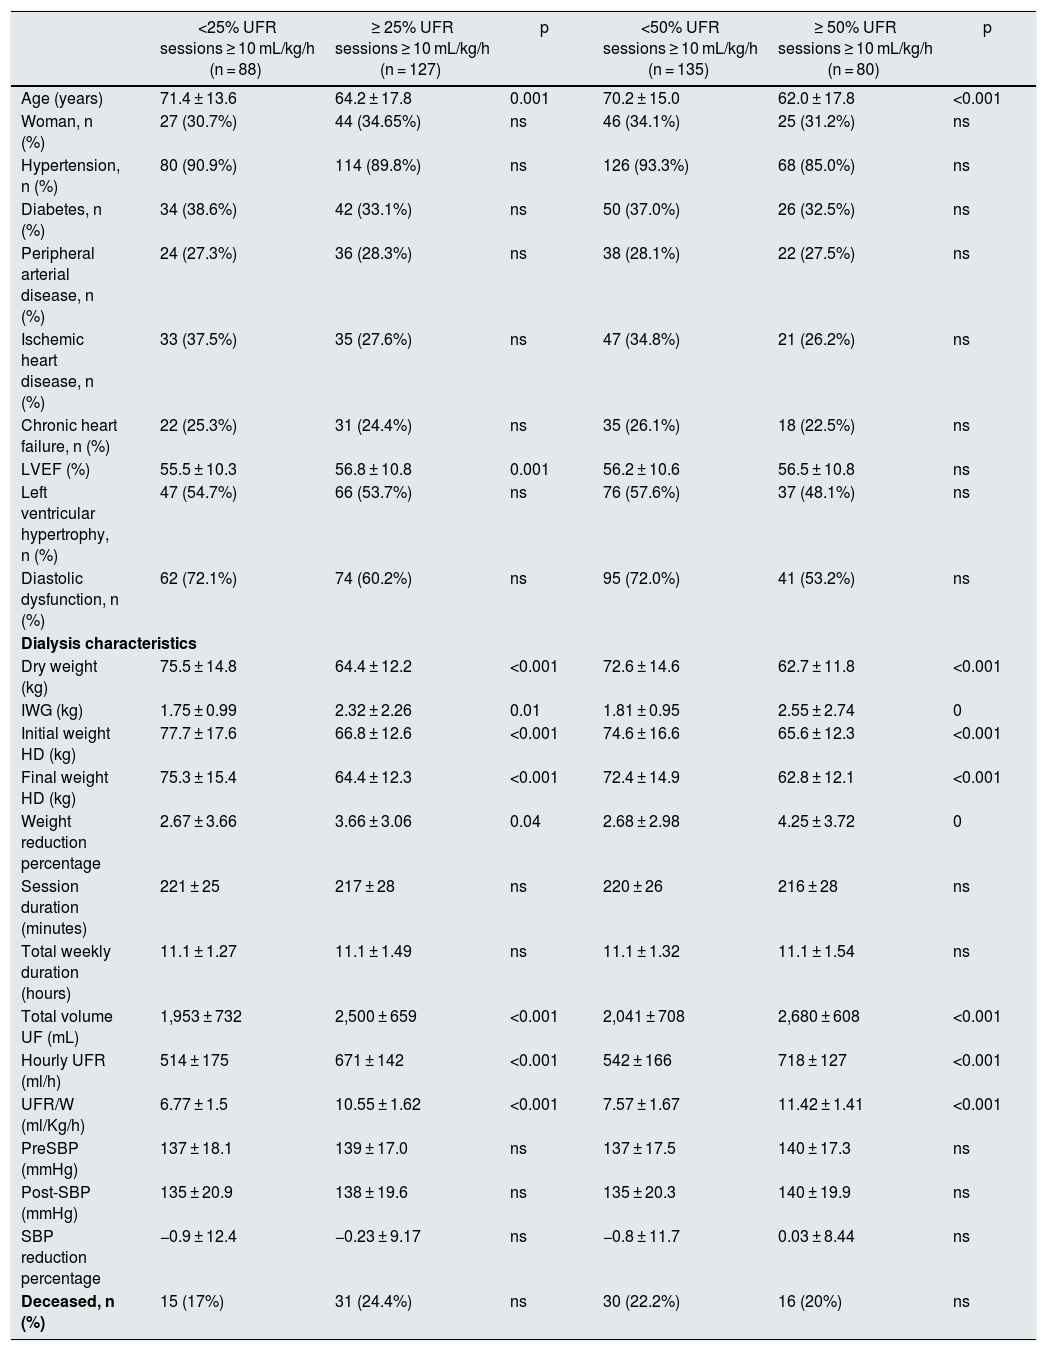
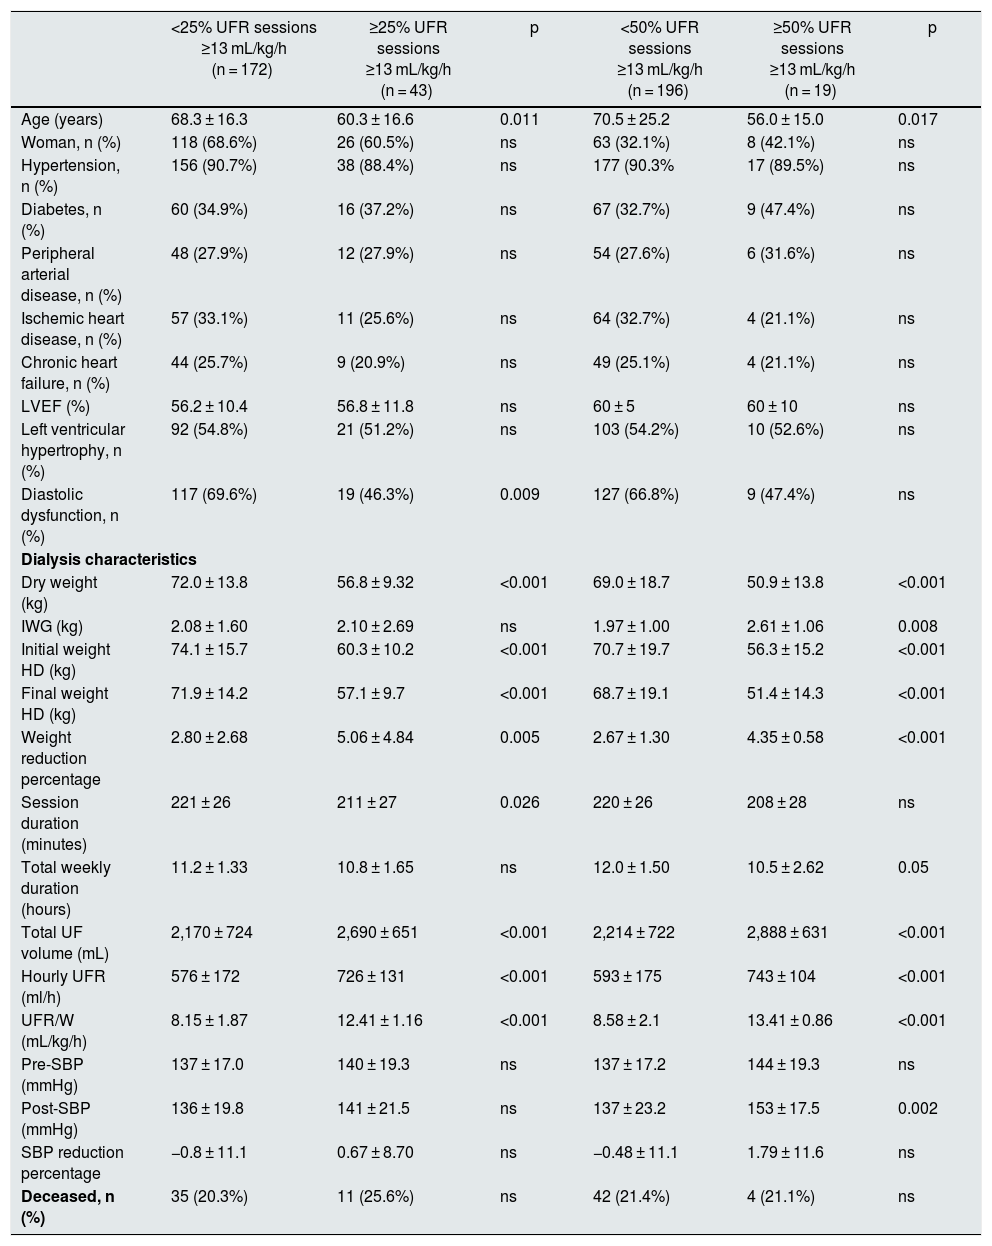
In Tables 2 and 3 shows the characteristics of the patients separated in different groups of UFR/W according to percentages of sessions with UFR/W greater than 10 or 13 mL/kg/h. Individuals with higher UFR/W were younger, with higher IWG, and had a higher percentage of weight reduction during dialysis, but with a lower initial and final dry weight. There were no variations in antihypertensive medication, anticoagulant use, time on dialysis, type of vascular access, or laboratory parameters. No significant differences were found in mortality between the groups analyzed.
Baseline characteristics of the studied population as a function of UFR/W using the cut-off point of 10 mL/kg/h.
| <25% UFR sessions ≥ 10 mL/kg/h (n = 88) | ≥ 25% UFR sessions ≥ 10 mL/kg/h (n = 127) | p | <50% UFR sessions ≥ 10 mL/kg/h (n = 135) | ≥ 50% UFR sessions ≥ 10 mL/kg/h (n = 80) | p | |
|---|---|---|---|---|---|---|
| Age (years) | 71.4 ± 13.6 | 64.2 ± 17.8 | 0.001 | 70.2 ± 15.0 | 62.0 ± 17.8 | <0.001 |
| Woman, n (%) | 27 (30.7%) | 44 (34.65%) | ns | 46 (34.1%) | 25 (31.2%) | ns |
| Hypertension, n (%) | 80 (90.9%) | 114 (89.8%) | ns | 126 (93.3%) | 68 (85.0%) | ns |
| Diabetes, n (%) | 34 (38.6%) | 42 (33.1%) | ns | 50 (37.0%) | 26 (32.5%) | ns |
| Peripheral arterial disease, n (%) | 24 (27.3%) | 36 (28.3%) | ns | 38 (28.1%) | 22 (27.5%) | ns |
| Ischemic heart disease, n (%) | 33 (37.5%) | 35 (27.6%) | ns | 47 (34.8%) | 21 (26.2%) | ns |
| Chronic heart failure, n (%) | 22 (25.3%) | 31 (24.4%) | ns | 35 (26.1%) | 18 (22.5%) | ns |
| LVEF (%) | 55.5 ± 10.3 | 56.8 ± 10.8 | 0.001 | 56.2 ± 10.6 | 56.5 ± 10.8 | ns |
| Left ventricular hypertrophy, n (%) | 47 (54.7%) | 66 (53.7%) | ns | 76 (57.6%) | 37 (48.1%) | ns |
| Diastolic dysfunction, n (%) | 62 (72.1%) | 74 (60.2%) | ns | 95 (72.0%) | 41 (53.2%) | ns |
| Dialysis characteristics | ||||||
| Dry weight (kg) | 75.5 ± 14.8 | 64.4 ± 12.2 | <0.001 | 72.6 ± 14.6 | 62.7 ± 11.8 | <0.001 |
| IWG (kg) | 1.75 ± 0.99 | 2.32 ± 2.26 | 0.01 | 1.81 ± 0.95 | 2.55 ± 2.74 | 0 |
| Initial weight HD (kg) | 77.7 ± 17.6 | 66.8 ± 12.6 | <0.001 | 74.6 ± 16.6 | 65.6 ± 12.3 | <0.001 |
| Final weight HD (kg) | 75.3 ± 15.4 | 64.4 ± 12.3 | <0.001 | 72.4 ± 14.9 | 62.8 ± 12.1 | <0.001 |
| Weight reduction percentage | 2.67 ± 3.66 | 3.66 ± 3.06 | 0.04 | 2.68 ± 2.98 | 4.25 ± 3.72 | 0 |
| Session duration (minutes) | 221 ± 25 | 217 ± 28 | ns | 220 ± 26 | 216 ± 28 | ns |
| Total weekly duration (hours) | 11.1 ± 1.27 | 11.1 ± 1.49 | ns | 11.1 ± 1.32 | 11.1 ± 1.54 | ns |
| Total volume UF (mL) | 1,953 ± 732 | 2,500 ± 659 | <0.001 | 2,041 ± 708 | 2,680 ± 608 | <0.001 |
| Hourly UFR (ml/h) | 514 ± 175 | 671 ± 142 | <0.001 | 542 ± 166 | 718 ± 127 | <0.001 |
| UFR/W (ml/Kg/h) | 6.77 ± 1.5 | 10.55 ± 1.62 | <0.001 | 7.57 ± 1.67 | 11.42 ± 1.41 | <0.001 |
| PreSBP (mmHg) | 137 ± 18.1 | 139 ± 17.0 | ns | 137 ± 17.5 | 140 ± 17.3 | ns |
| Post-SBP (mmHg) | 135 ± 20.9 | 138 ± 19.6 | ns | 135 ± 20.3 | 140 ± 19.9 | ns |
| SBP reduction percentage | −0.9 ± 12.4 | −0.23 ± 9.17 | ns | −0.8 ± 11.7 | 0.03 ± 8.44 | ns |
| Deceased, n (%) | 15 (17%) | 31 (24.4%) | ns | 30 (22.2%) | 16 (20%) | ns |
LVEF, left ventricular ejection fraction; IWG: interdialysis weight gain; HD: hemodialysis; ns: not significant; SBP: systolic blood pressure; Pre-SBP: predialysis SBP; Post-SBP: post-dialysis SBP; UF: ultrafiltration; UFR: hourly ultrafiltration ratio; UFR/W: hourly ultrafiltration adjusted by weight.
Baseline characteristics of the studied population as a function of UFR/W using the cut-off point of 13 mL/kg/h.
| <25% UFR sessions ≥13 mL/kg/h (n = 172) | ≥25% UFR sessions ≥13 mL/kg/h (n = 43) | p | <50% UFR sessions ≥13 mL/kg/h (n = 196) | ≥50% UFR sessions ≥13 mL/kg/h (n = 19) | p | |
|---|---|---|---|---|---|---|
| Age (years) | 68.3 ± 16.3 | 60.3 ± 16.6 | 0.011 | 70.5 ± 25.2 | 56.0 ± 15.0 | 0.017 |
| Woman, n (%) | 118 (68.6%) | 26 (60.5%) | ns | 63 (32.1%) | 8 (42.1%) | ns |
| Hypertension, n (%) | 156 (90.7%) | 38 (88.4%) | ns | 177 (90.3% | 17 (89.5%) | ns |
| Diabetes, n (%) | 60 (34.9%) | 16 (37.2%) | ns | 67 (32.7%) | 9 (47.4%) | ns |
| Peripheral arterial disease, n (%) | 48 (27.9%) | 12 (27.9%) | ns | 54 (27.6%) | 6 (31.6%) | ns |
| Ischemic heart disease, n (%) | 57 (33.1%) | 11 (25.6%) | ns | 64 (32.7%) | 4 (21.1%) | ns |
| Chronic heart failure, n (%) | 44 (25.7%) | 9 (20.9%) | ns | 49 (25.1%) | 4 (21.1%) | ns |
| LVEF (%) | 56.2 ± 10.4 | 56.8 ± 11.8 | ns | 60 ± 5 | 60 ± 10 | ns |
| Left ventricular hypertrophy, n (%) | 92 (54.8%) | 21 (51.2%) | ns | 103 (54.2%) | 10 (52.6%) | ns |
| Diastolic dysfunction, n (%) | 117 (69.6%) | 19 (46.3%) | 0.009 | 127 (66.8%) | 9 (47.4%) | ns |
| Dialysis characteristics | ||||||
| Dry weight (kg) | 72.0 ± 13.8 | 56.8 ± 9.32 | <0.001 | 69.0 ± 18.7 | 50.9 ± 13.8 | <0.001 |
| IWG (kg) | 2.08 ± 1.60 | 2.10 ± 2.69 | ns | 1.97 ± 1.00 | 2.61 ± 1.06 | 0.008 |
| Initial weight HD (kg) | 74.1 ± 15.7 | 60.3 ± 10.2 | <0.001 | 70.7 ± 19.7 | 56.3 ± 15.2 | <0.001 |
| Final weight HD (kg) | 71.9 ± 14.2 | 57.1 ± 9.7 | <0.001 | 68.7 ± 19.1 | 51.4 ± 14.3 | <0.001 |
| Weight reduction percentage | 2.80 ± 2.68 | 5.06 ± 4.84 | 0.005 | 2.67 ± 1.30 | 4.35 ± 0.58 | <0.001 |
| Session duration (minutes) | 221 ± 26 | 211 ± 27 | 0.026 | 220 ± 26 | 208 ± 28 | ns |
| Total weekly duration (hours) | 11.2 ± 1.33 | 10.8 ± 1.65 | ns | 12.0 ± 1.50 | 10.5 ± 2.62 | 0.05 |
| Total UF volume (mL) | 2,170 ± 724 | 2,690 ± 651 | <0.001 | 2,214 ± 722 | 2,888 ± 631 | <0.001 |
| Hourly UFR (ml/h) | 576 ± 172 | 726 ± 131 | <0.001 | 593 ± 175 | 743 ± 104 | <0.001 |
| UFR/W (mL/kg/h) | 8.15 ± 1.87 | 12.41 ± 1.16 | <0.001 | 8.58 ± 2.1 | 13.41 ± 0.86 | <0.001 |
| Pre-SBP (mmHg) | 137 ± 17.0 | 140 ± 19.3 | ns | 137 ± 17.2 | 144 ± 19.3 | ns |
| Post-SBP (mmHg) | 136 ± 19.8 | 141 ± 21.5 | ns | 137 ± 23.2 | 153 ± 17.5 | 0.002 |
| SBP reduction percentage | −0.8 ± 11.1 | 0.67 ± 8.70 | ns | −0.48 ± 11.1 | 1.79 ± 11.6 | ns |
| Deceased, n (%) | 35 (20.3%) | 11 (25.6%) | ns | 42 (21.4%) | 4 (21.1%) | ns |
LVEF, left ventricular ejection fraction; IWG: interdialysis weight gain; HD: hemodialysis; ns: not significant; SBP: systolic blood pressure; Pre-SBP: predialysis SBP; Post-SBP: post-dialysis SBP UF: ultrafiltration; UFR: hourly ultrafiltration ratio; UFR/W: hourly ultrafiltration adjusted by weight.
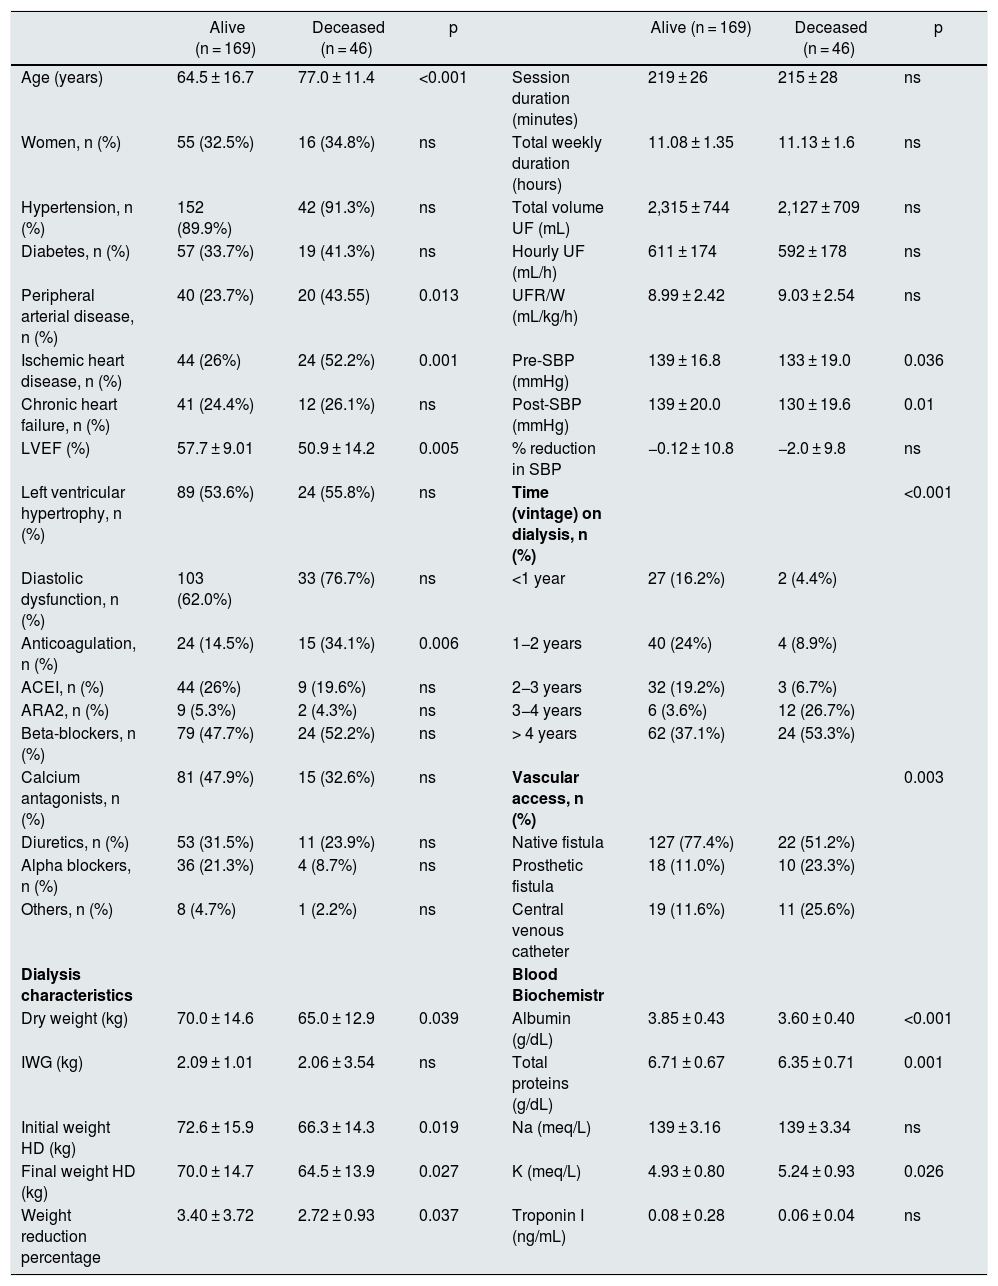
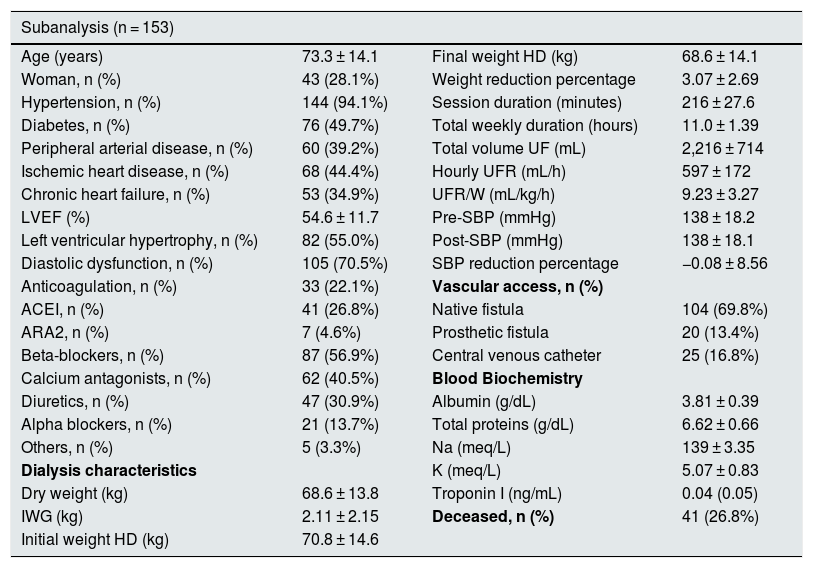
During the two and a half years of follow-up, 46 of the 215 patients (21.4%) died. The differences between the living and the deceased patients are shown in Table 4. There were no significant differences in UFR/W between both groups. In a logistic regression model, analyzing mortality based on age and UFR/W, the association between age and mortality was statistically significant (OR 1.06 95% CI 1.03–1.09 p < 0.001). Given that the main cause of mortality in hemodialysis patients is cardiovascular, a sub-analysis of the 153 individuals with high baseline risk was performed by having one or more of the following characteristics: age > 70 years, diabetes or cardiovascular disease (peripheral vascular disease, ischemic heart disease or heart failure) (Table 5). Among these patients, 41 (26.8%) died, while in the rest, mortality was 8%.
Comparison between alive and deceased patients.
| Alive (n = 169) | Deceased (n = 46) | p | Alive (n = 169) | Deceased (n = 46) | p | ||
|---|---|---|---|---|---|---|---|
| Age (years) | 64.5 ± 16.7 | 77.0 ± 11.4 | <0.001 | Session duration (minutes) | 219 ± 26 | 215 ± 28 | ns |
| Women, n (%) | 55 (32.5%) | 16 (34.8%) | ns | Total weekly duration (hours) | 11.08 ± 1.35 | 11.13 ± 1.6 | ns |
| Hypertension, n (%) | 152 (89.9%) | 42 (91.3%) | ns | Total volume UF (mL) | 2,315 ± 744 | 2,127 ± 709 | ns |
| Diabetes, n (%) | 57 (33.7%) | 19 (41.3%) | ns | Hourly UF (mL/h) | 611 ± 174 | 592 ± 178 | ns |
| Peripheral arterial disease, n (%) | 40 (23.7%) | 20 (43.55) | 0.013 | UFR/W (mL/kg/h) | 8.99 ± 2.42 | 9.03 ± 2.54 | ns |
| Ischemic heart disease, n (%) | 44 (26%) | 24 (52.2%) | 0.001 | Pre-SBP (mmHg) | 139 ± 16.8 | 133 ± 19.0 | 0.036 |
| Chronic heart failure, n (%) | 41 (24.4%) | 12 (26.1%) | ns | Post-SBP (mmHg) | 139 ± 20.0 | 130 ± 19.6 | 0.01 |
| LVEF (%) | 57.7 ± 9.01 | 50.9 ± 14.2 | 0.005 | % reduction in SBP | −0.12 ± 10.8 | −2.0 ± 9.8 | ns |
| Left ventricular hypertrophy, n (%) | 89 (53.6%) | 24 (55.8%) | ns | Time (vintage) on dialysis, n (%) | <0.001 | ||
| Diastolic dysfunction, n (%) | 103 (62.0%) | 33 (76.7%) | ns | <1 year | 27 (16.2%) | 2 (4.4%) | |
| Anticoagulation, n (%) | 24 (14.5%) | 15 (34.1%) | 0.006 | 1−2 years | 40 (24%) | 4 (8.9%) | |
| ACEI, n (%) | 44 (26%) | 9 (19.6%) | ns | 2−3 years | 32 (19.2%) | 3 (6.7%) | |
| ARA2, n (%) | 9 (5.3%) | 2 (4.3%) | ns | 3−4 years | 6 (3.6%) | 12 (26.7%) | |
| Beta-blockers, n (%) | 79 (47.7%) | 24 (52.2%) | ns | > 4 years | 62 (37.1%) | 24 (53.3%) | |
| Calcium antagonists, n (%) | 81 (47.9%) | 15 (32.6%) | ns | Vascular access, n (%) | 0.003 | ||
| Diuretics, n (%) | 53 (31.5%) | 11 (23.9%) | ns | Native fistula | 127 (77.4%) | 22 (51.2%) | |
| Alpha blockers, n (%) | 36 (21.3%) | 4 (8.7%) | ns | Prosthetic fistula | 18 (11.0%) | 10 (23.3%) | |
| Others, n (%) | 8 (4.7%) | 1 (2.2%) | ns | Central venous catheter | 19 (11.6%) | 11 (25.6%) | |
| Dialysis characteristics | Blood Biochemistr | ||||||
| Dry weight (kg) | 70.0 ± 14.6 | 65.0 ± 12.9 | 0.039 | Albumin (g/dL) | 3.85 ± 0.43 | 3.60 ± 0.40 | <0.001 |
| IWG (kg) | 2.09 ± 1.01 | 2.06 ± 3.54 | ns | Total proteins (g/dL) | 6.71 ± 0.67 | 6.35 ± 0.71 | 0.001 |
| Initial weight HD (kg) | 72.6 ± 15.9 | 66.3 ± 14.3 | 0.019 | Na (meq/L) | 139 ± 3.16 | 139 ± 3.34 | ns |
| Final weight HD (kg) | 70.0 ± 14.7 | 64.5 ± 13.9 | 0.027 | K (meq/L) | 4.93 ± 0.80 | 5.24 ± 0.93 | 0.026 |
| Weight reduction percentage | 3.40 ± 3.72 | 2.72 ± 0.93 | 0.037 | Troponin I (ng/mL) | 0.08 ± 0.28 | 0.06 ± 0.04 | ns |
ARA2: angiotensin receptor 2 antagonists; LVEF, left ventricular ejection fraction; IWG: interdialysis weight gain; HD: hemodialysis; ACEI: angiotensin converting enzyme inhibitor; ns: not significant; SBP: systolic blood pressure; Pre-SBP: predialysis SBP; Post-SBP: post-dialysis SBP; UF: ultrafiltration; UFR: hourly ultrafiltration ratio; UFR/W: hourly ultrafiltration adjusted by weight.
Characteristics of the high-risk subgroup: patients aged > 70 years and/or type 2 diabetes mellitus and/or cardiovascular disease (peripheral vascular disease, ischemic heart disease, or heart failure).
| Subanalysis (n = 153) | |||
|---|---|---|---|
| Age (years) | 73.3 ± 14.1 | Final weight HD (kg) | 68.6 ± 14.1 |
| Woman, n (%) | 43 (28.1%) | Weight reduction percentage | 3.07 ± 2.69 |
| Hypertension, n (%) | 144 (94.1%) | Session duration (minutes) | 216 ± 27.6 |
| Diabetes, n (%) | 76 (49.7%) | Total weekly duration (hours) | 11.0 ± 1.39 |
| Peripheral arterial disease, n (%) | 60 (39.2%) | Total volume UF (mL) | 2,216 ± 714 |
| Ischemic heart disease, n (%) | 68 (44.4%) | Hourly UFR (mL/h) | 597 ± 172 |
| Chronic heart failure, n (%) | 53 (34.9%) | UFR/W (mL/kg/h) | 9.23 ± 3.27 |
| LVEF (%) | 54.6 ± 11.7 | Pre-SBP (mmHg) | 138 ± 18.2 |
| Left ventricular hypertrophy, n (%) | 82 (55.0%) | Post-SBP (mmHg) | 138 ± 18.1 |
| Diastolic dysfunction, n (%) | 105 (70.5%) | SBP reduction percentage | −0.08 ± 8.56 |
| Anticoagulation, n (%) | 33 (22.1%) | Vascular access, n (%) | |
| ACEI, n (%) | 41 (26.8%) | Native fistula | 104 (69.8%) |
| ARA2, n (%) | 7 (4.6%) | Prosthetic fistula | 20 (13.4%) |
| Beta-blockers, n (%) | 87 (56.9%) | Central venous catheter | 25 (16.8%) |
| Calcium antagonists, n (%) | 62 (40.5%) | Blood Biochemistry | |
| Diuretics, n (%) | 47 (30.9%) | Albumin (g/dL) | 3.81 ± 0.39 |
| Alpha blockers, n (%) | 21 (13.7%) | Total proteins (g/dL) | 6.62 ± 0.66 |
| Others, n (%) | 5 (3.3%) | Na (meq/L) | 139 ± 3.35 |
| Dialysis characteristics | K (meq/L) | 5.07 ± 0.83 | |
| Dry weight (kg) | 68.6 ± 13.8 | Troponin I (ng/mL) | 0.04 (0.05) |
| IWG (kg) | 2.11 ± 2.15 | Deceased, n (%) | 41 (26.8%) |
| Initial weight HD (kg) | 70.8 ± 14.6 | ||
ARA2: angiotensin receptor 2 antagonists; LVEF, left ventricular ejection fraction; IWG: interdialysis weight gain; HD: hemodialysis; ACEI: angiotensin converting enzyme inhibitor; SBP: systolic blood pressure; Pre-SBP: predialysis SBP; Post-SBP: post-dialysis SBP; UF: ultrafiltration; UFR: hourly ultrafiltration ratio; UFR/W: hourly ultrafiltration adjusted by weight.
Finally, given that UFR/W is a continuous variable, we performed a ROC curve to determine the cut-off point for UFR/W that is associated with an increase in mortality in our population. However, the UFR/W did not predict mortality (area under the curve 0.509, 95% CI 0.415 to 0.602) (Fig. 1).
Comparison with previous studies and mortality.")
Given that the results obtained on the relationship between UFR/W and mortality do not coincide with the previous reports in the literature, we analyzed whether there were differences in the characteristics of the different populations being evaluated.
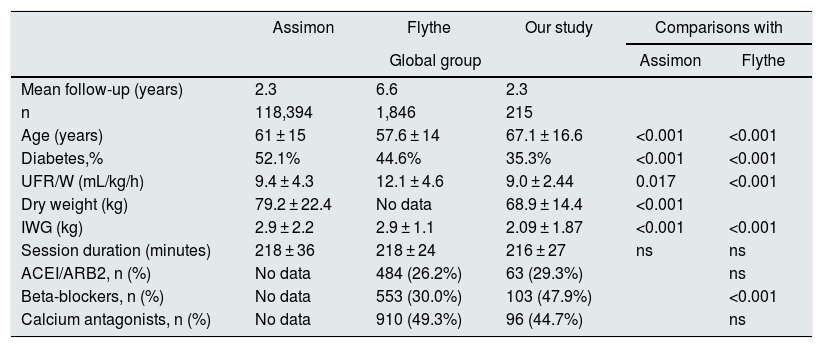
Assimon et al.19 concluded that a cut-off point of UFR/W > 13 mL/kg/h is associated with higher mortality, despite the fact that, like us, they observed higher UFR/W in younger patients with lower weight. However, comparing our results with those of this study, we found that our patients with UFR > 13 mL/kg/h in ≥50% of the sessions had lower dry weight (50.9 vs. 73.5 kg; p < 0.001), lower IWG (2.61 vs. 3.6 kg; p = 0.001) and a not so high mean UFR (13.41 mL/kg/h vs. 16.0 mL/kg/h; p < 0.001). There were no differences regarding age or duration of the sessions (Table 6).
Main studies on the association between UFR/W and mortality in hemodialysis.
| Assimon | Flythe | Our study | Comparisons with | ||
|---|---|---|---|---|---|
| Global group | Assimon | Flythe | |||
| Mean follow-up (years) | 2.3 | 6.6 | 2.3 | ||
| n | 118,394 | 1,846 | 215 | ||
| Age (years) | 61 ± 15 | 57.6 ± 14 | 67.1 ± 16.6 | <0.001 | <0.001 |
| Diabetes,% | 52.1% | 44.6% | 35.3% | <0.001 | <0.001 |
| UFR/W (mL/kg/h) | 9.4 ± 4.3 | 12.1 ± 4.6 | 9.0 ± 2.44 | 0.017 | <0.001 |
| Dry weight (kg) | 79.2 ± 22.4 | No data | 68.9 ± 14.4 | <0.001 | |
| IWG (kg) | 2.9 ± 2.2 | 2.9 ± 1.1 | 2.09 ± 1.87 | <0.001 | <0.001 |
| Session duration (minutes) | 218 ± 36 | 218 ± 24 | 216 ± 27 | ns | ns |
| ACEI/ARB2, n (%) | No data | 484 (26.2%) | 63 (29.3%) | ns | |
| Beta-blockers, n (%) | No data | 553 (30.0%) | 103 (47.9%) | <0.001 | |
| Calcium antagonists, n (%) | No data | 910 (49.3%) | 96 (44.7%) | ns | |
| UFR/W 10−13 mL/kg/h | UFR/W 10−13 mL/kg/h | ≥50% sessions | UFR/W > 10 mL/kg/h | ||
|---|---|---|---|---|---|
| n | 26,794 (22.6%) | 517 (28.0%) | 80 (37.2%) | ||
| Age (years) | 61 ± 15 | 57.9 ± 13.5 | 62 ± 17.8 | ns | ns |
| Diabetes,% | 54.0% | 46.8% | 0.325 | <0.001 | 0.023 |
| UFR/W (mL/kg/h) | 11.4 ± 0.9 | 11.4 ± 8.6 | 11.42 ± 1.41 | ns | ns |
| Dry weight (kg) | 75.6 ± 18.3 | No data | 62.7 ± 11.8 | <0.001 | |
| IWG (kg) | 3.3 ± 2.0 | 3.0 ± 0.9 | 2.55 ± 2.74 | 0.004 | ns |
| Session duration (minutes) | 214 ± 28 | 220 ± 23 | 216 ± 28 | ns | ns |
| ACEI/ARB2, n (%) | No data | 124 (24.0%) | 28 (35.0%) | 0.049 | |
| Beta-blockers, n (%) | No data | 151 (29.2%) | 36 (45.0%) | 0.006 | |
| Calcium antagonists, n (%) | No data | 247 (47.8%) | 41 (51.2%) | ns |
| UFR/W > 13 mL/kg/h | UFR/W > 13 mL/kg/h | ≥50% sessions | UFR/W > 13 mL/kg/h | ||
|---|---|---|---|---|---|
| n | 21,735 (18.4%) | 685 (37.1%) | 19 (8.8%) | ||
| Age (years) | 58 ± 16 | 54.8 ± 14.7 | 56.0 ± 15.0 | ns | ns |
| Diabetes,% | 51.4% | 42.5% | 0.474 | ns | ns |
| UFR/W (mL/kg/h) | 16.0 ± 2.9 | 16.8 ± 3.6 | 13.41 ± 0.86 | <0.001 | <0.001 |
| Dry weight (kg) | 73.5 ± 6.5 | No data | 50.9 ± 13.8 | <0.001 | |
| IWG (kg) | 3.6 ± 2.2 | 3.6 ± 1 | 2.61 ± 1.06 | 0.001 | <0.001 |
| Session duration (minutes) | 205 ± 28 | 209 ± 23 | 208 ± 28 | ns | ns |
| ACEI/ARB2, n (%) | No data | 208 (30.4%) | 7 (36.8%) | ns | |
| Beta-blockers, n (%) | No data | 222 (32.4%) | 9 (47.7%) | ns | |
| Calcium antagonists, n (%) | No data | 371 (54.2%) | 12 (63.2%) | ns |
ARA2: angiotensin receptor 2 antagonists; IWG: interdialytic weight gain; ACEI: angiotensin converting enzyme inhibitor; ns: not significant; UFR/W: hourly ultrafiltration adjusted by weight.
We also compare our results with those of Flythe et al.29 and we observed that our patients had lower IWG (2. 6 vs. 3.6 kg; p < 0.001) and lower UFR (13.4 vs. 16.8 mL/kg/h; p < 0.001) (Table 6).
Regarding the use of drugs, we compared our results with those of the Flythe study.29 It is noteworthy that our patients, globally, have more use of beta-blockers, but this significant difference disappears in the group with ≥ 50% sessions with UFR > 13 mL/kg/h, perhaps due to our low “n” value of 19 subjects. There are no differences in the use of angiotensin converting enzyme inhibitor/angiotensin II receptor antagonists (ACEI/ARA2) or calcium antagonists (Table 6). Our patients had a higher prevalence of cardioprotective medication, specifically beta-blockers, which reduce mortality on dialysis,30 and improve the control of blood pressure: our mean systolic blood pressure (SBP) was 144 ± 19.3 mmHg in the group of ≥ 50% of sessions with UFR/W > 13 mL/kg/h, while in the other groups with higher UFR, 49.1% had SBP > 151 mmHg and 40.9% had SBP > 160 mmHg.19,29
DiscussionIn the present study, we did not find statistically significant differences in mortality in relation to the UFR/W. As expected, we observed an association between mortality and the presence of more und basic comorbidities. The with mortality is higher in older patients, patients with a history of ischemic heart disease and peripheral arterial disease, use of anticoagulants, a reduced LVEF, longer time of permanence in chronic hemodialysis, lower pre and post-dialysis SBP, poor nutritional status, lower weight, lower percentage weight reduction during dialysis and high potassium (Table 4).
High UFRs are often an obligatory consequence of high IWG and short hemodialysis sessions, with a relationship between high UFR and cardiovascular mortality.14–19 By increasing the duration of hemodialysis sessions and decreasing the IWG, a reduction of UFRs could be achieved. Currently, strategies based on long dialysis sessions for better blood volume control have fallen into disuse in certain countries, although not in ours B. Thus are remarkable results of the study by the group of Tassin in which, with long hemodialysis sessions (eight hours) achieve beneficial effects, accomplishing a tight control of blood volume, with reduced antihypertensive drugs and gradual reduction of body weight.31,32 By increasing the time or frequency of hemodialysis sessions (dialysis doses), the aim is to reduce the risk of arterial hypotension. The most important determinant of intradialysis hypotension is the decrease in plasma volume below a critical threshold as a result of an imbalance between UF and refilling (vascular filling with water from the extravascular space).
Factors that predispose to intradialysis hypotension include diastolic dysfunction, atrial fibrillation, baroreceptor dysfunction, low sodium and calcium concentrations in the dialysate, high dialysate temperature, and hypotensive drugs, among others. The classic strategy to reduce the number of intradialysis hypotensive episodes is to adjust or decrease the UFR/W. UFR/W rates greater than 10 mL/kg/h are associated with an increased risk of intradialysis hypotension and mortality.33 Some authors suggest that using low UFR/W (3–4 mL/kg/h) should allow a safe reduction in body weight and good blood pressure control even without drugs.34 The UFR/W rate has been defined in different ways, which means that the results of the different studies cannot be extrapolated. Based on previous literature, a high UFR/W rate can be defined as the mean over a period or a percentage of sessions with a high UFR/W, usually greater than 10 mL/kg/h, as discussed below.
Among the main studies analyzing the relationship between mortality and UF are four observational studies. In the Dialysis Outcomes and Practice Patterns Study (DOPPS), Saran et al.33 demonstrated an association between UFR/W > 10 mL/kg/h and total mortality (hazard ratio [HR] 1.09, p = 0.02) in 22,000 hemodialysis patients. In this study, longer sessions and higher Kt/Vurea were associated with lower mortality, while UFR/W > 10 mL/kg/h were associated with higher mortality. Hemodialysis sessions of more than 240 min were significantly associated with a lower relative risk (RR) of mortality (every 30 min of the hemodialysis session decreased the RR of mortality by 7%). Furthermore, they suggest that long hemodialysis sessions could reduce cardiovascular morbidity and mortality. In addition, Movilli et al.9 conducted a prospective study in 287 hemodialysis patients, and described that survival decreases with high UF rates, especially with UFR/W greater than 12.4 mL/kg/h, for which they recommend increasing the time or frequency of hemodialysis sessions to avoid high UFR/W and improve survival. In a post hoc analysis of 1,846 patients from the HEMO study (Hemodialysis Study), Flythe et al.29 found that UFR/W > 10 mL/kg/h were associated with an increase in cardiovascular and all-cause mortality, although this effect was more marked with UFR/W > 13 mL/kg/h (mortality of any cause HR 1.59, 95% CI 1.29–1.96; cardiovascular mortality HR 1.71, 95% CI 1.23–2.38). Furthermore, the work of Assimon et al.,19 who analyzed UF in 118,394 hemodialysis patients in a retrospective cohort study, observed that UFR/W > 13 mL/kg/h during hemodialysis sessions of the first 30 days of follow-up was associated with higher mortality, and that an increase in UFR/W of 1 mL/kg/h was associated with an increased risk of death of 3%.
In our work, we studied the mean and the percentage of sessions that reached an excessive UF, defined as UFR/W > 10 mL/kg/h, during the 30 months of the study. Our mean total UFR/W was 9.0 mL/kg/h, but 59% (127) of the patients had a UFR/W > 10 mL/kg/h in more than 25% of the sessions and a 8.8% (19) had a UFR/W > 13 mL/kg/h in ≥50% of the dialysis sessions (Tables 2 and 3). Analysis of these data leads us to conclude that we could have increased the duration or frequency of hemodialysis sessions to avoid high rates of UF and improve survival. This data allows to estimate that, by adjusting the UFR in each session for each patient according to their dry weight, IWG and baseline comorbidities, the potential individual risk associated with the most demanding UFR/W could be reduced. In our sample, patients with higher UFR/W were younger, with lower dry weight, higher IWG, lower initial and final weight, higher UF volume and greater percentage of weight reduction in hemodialysis. The characteristics of this population with higher UFR/W may have influenced the low mortality observed since, even when analyzing separately the group with the highest cardiovascular risk and the oldest, we did not notice statistically significant differences. However, we cannot rule out that they may suffer imperceptible damage that increases mortality in a long follow-up. The high UFR/W in patients with lower dry weight are explained by the fact that, in these people, small IWG in absolute values (kg) represent important increases in blood volume with respect to weight and lead to higher UFR/W. To avoid high UFR/W in patients with lower dry weight, it would be necessary to consider increasing the time and/or frequency of hemodialysis sessions.
Probably, the small sample size of our study compared to that of Assimon (19 patients vs. 21,735 with UFR/W > 13 mL/kg/h) represents an important limitation. Mortality may not have statistical significance in our group with the highest UFR/W because, being people with less weight (dry weight 51.4 kg) and younger, they have a lower cardiovascular risk compared to the American population studied by Assimon, which had a dry weight 22.1 kg higher than ours. As compared to the Assimon study, our patients with a higher UFR/W had a lower IWG and, therefore, a lower UFR/W. This is compounded by a probable lower cardiovascular risk due to being underweight and younger than the individuals in the Assimon study. We consider that this may be the explanation why this group, despite having UFR/W > 13 mL/kg/h in ≥50% of hemodialysis sessions, was not associated with a significant increase in mortality. Our mean follow-up was 2.3 years, this is like in the Assimon study, but it would be interesting to analyze the data regarding mortality in the longer term. Contrasting our results with those of the Assimon and Flythe studies, we found that individuals with higher UFR/W are, in general, younger in all three studies. However, even the highest mean UFR/W and IWG (13.41 mL/kg/h and 2.61 kg) in our patients are lower than those of the other two studies, a fact that we consider has significantly influenced the results of our study, since people with higher UFR/W did not have a significant increase in mortality during the period of follow-up. The differences related to weight and age are probably related to the demographic and socioeconomic characteristics of the different populations, especially weight, given the higher prevalence of obesity in the United States.
An elevated UFR/W promotes the development of intradialysis hypotension, loss of residual renal function, ischemic damage, and possible vascular access thrombosis. In addition, high UFR/W contributes to maintain appropriate euvolemia, which is associated with favorable cardiovascular outcomes, including the improvement in left ventricular hypertrophy35 and prevention of heart failure decompensations, with a better survival.36–39 Therefore, it is important to implement individualized strategies in order to guarantee a specific UFR/W for the hemodynamic and cardiovascular situation of each patient, but not exceeding 13 mL/kg/h.
Intradialysis echocardiographic assessment and measurement of the changes in troponin induced by hypotension have shown that cardiac ischemia is a potential mediator of mortality related with UF.40 Excessive UFR/W should be avoided to allow appropriate refilling in each patient, for which different solutions are proposed. Daugirdas has analyzed how UFR in hemodialysis could be optimized41 and suggests that it might be more appropriate to scale UFR rates in relation to body surface area rather than body weight. Another alternative would be to calculate the “ideal” dry weight of the patient by bioimpedance, and made an individual adjustment of the UFR.42 Other authors are performing UF profiles to assess whether UFR can be intensified at the beginning of the hemodialysis session.43
In conclusion, in the patient population of our dialysis unit, probably representative of Spanish, it was not observed a relationship between UFR/W and mortality. These results differ from those reported in the literature. The differences could be explained by a better baseline situation of the patients with the highest UFR/W, as well as differences in the baseline characteristics of the population and the magnitude of the UFR/W versus previous studies that did associate UFR/W with mortality. Obese patients on hemodialysis (HD) tend to have lower mortality due to the reverse epidemiology, while the thinner patients may be malnourished. This t means that, possibly, extreme weights have to be eliminated from the analysis, since they may aggravate or reduce mortality. Obese people will have a lower rate of UF per weight and it also protects them from mortality. In the United States, obese patients are frequent and they may have an impact on the results. Thus, in our population of patients with an appropriate pharmacological protection of cardiovascular system and in which the upper extremes of UFR/W are avoided, we did not observe a negative impact of UFR/W on mortality. Another possible explanation for not finding differences in mortality between the groups, may be a greater care for more vulnerable patients, who would be treated with longer dialysis and a lower rate of UF/hour/weight, in an attempt to improve tolerance; this strategy would approximate their mortality to that of the healthier group. Given that the sample size was relatively small, it would be interesting to propose a Spanish multicenter study to establish cut-off points for UFR/W of increased risk of death adapted to the Spanish reality.
FinancingProject financed by the health research fund ISC-III and co-financed with FEDER funds PI16/01298.
Conflict of interestsThe authors have no conflicts of interest to declare.
Please cite this article as: Fernandez-Prado R, Peña-Esparragoza JK, Santos-Sánchez-Rey B, Pereira M, Avello A, Gomá-Garcés E, et al. Tasa de ultrafiltración horaria ajustada a peso corporal y mortalidad en hemodiálisis. Nefrologia. 2021;41:426–435.


