

Introduction: Vascular access (VA) is the main difficulty in our hemodialysis Units and there is not adequate update data in our area. Purpose: To describe the vascular access management models of the Autonomous Community of Madrid and to analyze the influence of the structured models in the final results. Material and methods: Autonomous multicenter retrospective study. Models of VA monitoring, VA distribution 2007-2008, thrombosis rate, salvage surgery and preventive repair are reviewed. The centers are clasiffied in three levels by the evaluation the Nephrology Departments make of their Surgery and Radiology Departments and the existence of protocols, and the ends are compared. Main variables: Type distribution of VA. VA thrombosis rate, preventive repair and salvage surgery. Results: Data of 2.332 patients were reported from 35 out of 36 centers. Only 19 centers demonstrate database and annual evaluation of the results. Seventeen centers have multidisciplinary structured protocols. Forty-four point eight percent of the patients started dialysis by tunneled catheter (TC). Twenty-nine point five percent received dialysis by TC in December-08 vs 24.7% in December-07. Forty-four point seven percent of TC were considered final VA due to non-viable surgery, 27% are waiting for review or surgery more than 3 months. For rates study data from 27 centers (1.844 patients) were available. Native AVF and graft-AVF thrombosis rates were 10.13 and 39.91 respectively. Centers with better valued models confirmed better results in all markers: TC rates, 24.2 vs 34.1 %, p: 0.002; native AVF thrombosis rate 5.3 vs 10.7 %; native AVF preventive repair 14.5 vs 10.2%, p: 0.17; Graft- AVF thrombosis rate 19.8 vs 44.4%, p: 0.001; Graft-AVF preventive repair 83.2 vs 26.2, p < 0.001.They also have less patients with TC as a final option (32.2 vs 45.3) and less patients with TC waiting for review or surgery more than 3 months (2.8 vs 0). Limits: Seventy-five percent of patients were reached for the analysis of trhombosis rate. Results are not necessarily extrapolated. Conclusions: For the first time detailed data are available. TC use is elevated and increasing. Guidelines objetives are not achieved. The difference of results observed in differents centers of the same public health area; make it necessary to reevaluate the various models of care and TC follow-up.
Objetivo: Describir los modelos de gestión del acceso vascular (AV) en la Comunidad Autónoma de Madrid (CAM) y analizar su influencia en los resultados. Material y métodos: Estudio retrospectivo multicéntrico autonómico. Se recogen los modelos de seguimiento del AV, distribución del AV 2007- 2008 y las tasas de trombosis, reparación preventiva y cirugía de rescate durante 2008 para FAV autólogas (FAV-Auto) y protésicas (FAV-Prot). Se clasifican los centros en tres niveles de valoración y se comparan los extremos. Resultados: Aportan datos 35 de 36 centros: 2.332 pacientes. Sólo 19 centros tienen bases de datos y evaluación anual reglada y 17 protocolos multidisciplinares formalizados. El 44,8% inició hemodiálisis con catéter (CAT). El 29,5% tenía CAT en 2008 frente al 24,7% en 2007. El 44,17% de CAT se considera electivo sin posibilidad de cirugía, el 27% está pendiente de valoración o con más de 3 meses de espera. La tasa de trombosis fue del 10,13% para FAV-Auto y del 39,91 % para FAV-Prot. Los servicios mejor valorados obtienen resultados mejores en: tasa de CAT: 24,2 frente a 34,1%; tasa de trombosis FAV-Auto: 5,3 frente a 10,7%; reparación preventiva FAV-Auto: 14,5 frente a 10,2%; tasa de trombosis FAV-Prot: 19,8 frente a 44,4%; reparación preventiva FAV-Prot: 83,2 frente a 26,2%. Además, tienen menor número de CAT electivos (32,20 frente a 45,30%) y menor proporción de CAT, con espera superior a 3 meses. Conclusiones: El uso de CAT es excesivo, aumenta progresivamente y no cumple los objetivos de la Guía S.E.N. La diferencia de resultados obtenidos entre centros del sistema sanitaria público hace necesario una revaluación de los modelos de seguimiento del AV.
INTRODUCTION
Vascular Access (VA) continues to be one of the most important challenges in dialysis units worldwide. VA affects patients’ quality of life, efficacy and anaemia intermediate results, and morbidity and mortality final results. As nursing staff and at least 3 different medical specialties are involved in the management of VA, the approach is somewhat complex to organize; therefore, clinical guides drawn up by these aforementioned professionals are necessary to coordinate clinical activities.1 Although it has been accepted that native arteriovenous fistula (native- AVF) is the VA of choice in patients in dialysis,2 the prevalence of central venous catheter (CVC) increases constantly in these patients.3 According to USRDS data, in the USA, in the year 2006, up to 82% of patients began dialysis with a CVC.4 Furthermore, there is a growing number of studies that relate the presence of a catheter with greater mortality and also greater expense.5-7 This widespread use of CVC is due in part to non-modifiable factors, such as age and comorbidities, both progressively increasing in our patients. However, there are other modifiable factors such as the organisation of surgery and radiology services, and their relationship with nephrology services, VA structured follow-up plans or performing dialysis in a certain type of centre, that affect the results of VA. It has been shown that a well coordinated multidisciplinary follow-up of VA by nephrology, nursing, surgery and radiology can achieve satisfactory results.8 However, currently there is little specific data as to how VA is managed in our Community.
The aim of this study was to ascertain how VA was managed in the Autonomous Community of Madrid (CAM) and to determine whether the different models of care in this community influence the results.
MATERIALS AND METHODS
Study Design
This is a retrospective multicentric study, with systematic inclusion of all patients treated by haemodialysis (HD). By means of a survey distributed in January 2009, with the support of the Madrid Society of Nephrology (SOMANE), all dialysis units in the CAM were requested to report the model of VA care used and the results obtained. The questions asked during the survey are classified in three sections:
- Work organisation and classification of centres. In each centre the nephrologists’ tasks were assessed based on the following: structured consultations due to advanced chronic kidney disease (ACKD), complete multidisciplinary protocol and database with routine determination of annual indicators. This model of organisation is scored from 1-3 according to the number of elements present. Furthermore, an assessment of the level of satisfaction of reference surgical and radiology services is requested. This is also scored from 1-3 for each of these two scores (not sufficient = 1, sufficient = 2 and good = 3). Adding up the scores obtained with the three aspects, a global score of between 3-9 points is obtained for each centre. Subsequently these are grouped by reference centre, specifically, the hospitals where radiological and surgical procedures are carried out together with the units or hospitals that depend on them. Globally, reference centres are classified as: good with a maximum score of 9, sufficient from 6-8, and not sufficient from 5 down to a minimum of 3 points.
- Usual VA follow-up method employed to detect malfunctions and system for collecting VA data used in each dialysis unit.
- Basic VA results: a) type of VA with which the patient began dialysis: Auto-AVF, Graft-AVF, tunneled CVC and and temporal CVC; b) type of VA with which the patient was undergoing dialysis in December 2007 and 2008; c) if the patient is undergoing dialysis through a catheter, reason for this; d) number of thrombosis seen in Auto-AVF and Graft-AVF in the year 2008, and e) number of repairs for dysfunction and rescue of thrombosed VAin 2008.
Definitions
- Reference Centre: Hospitals with surgery and radiology services that, therefore, do not refer patients to other health centres. Non-reference centres are those that send their patients to other centres for the creation or maintenance of their VA; generally they are not hospitals.
- Annual thrombosis rate for Auto-AVF. Number of thrombosed Auto-AVF in the year 2008/mean prevalence of Auto-AVF 2007-2008 data are presented as percentages.
- Annual thrombosis rate for Graft-AVF. Number of thrombosed Graft-AVF in the year 2008/mean prevalence of Graft-AVF 2007-2008 data are presented as percentages.
- Annual rate of repair due to dysfunction. Number of both radiological and surgical repairs due to VA dysfunction (before it thrombosed)/mean prevalence of VA 2007- 2008 data are presented as percentages.
- Percentage of AVF rescued after thrombosis. Number of AVF thrombosed and repaired after thrombosis/total number of thrombosis.
Main Variables
The main study variables have been: distribution of types of VA at the beginning of HD and during follow-up, thrombosis rates, rescue surgery and repairs due to dysfunction by type of AV.
A descriptive analysis is made of these variables and a comparison by type of structural centre (reference centre or non-reference centre) and by type of centre according to global score (nephrology, surgery and radiology) described above.
Statistics
All data was collected and loaded on an Access type database in each centre, and later loaded onto a single database. A data manager has carried out depuration tasks with ranges and logical routines and has corrected potentially erroneous data after consulting the centre that originated it. Variables are compared using Chi2. Data are presented as percentages (number of patients or centres). The rates are calculated as has been shown previously, and indicated as the added value of events for 100 patients-year of follow-up and the extreme ranges of the centres are included in each case. The distribution of data according to type of VA is indicated as an aggregate percentage and the extreme ranges of the centres are included in each analysis. The statistical study was performed with SPSS v11.0 software (SPSS Inc.).
RESULTS
The questionnaire was answered by 35 out of 36 centres of the CAM, which represents 2,332 patients distributed in: 12 reference centres (786 patients) and 23 non-reference centres (1,546 patients). Of the 35 centres, 27 have sent in complete individualized information referring to 1,844 patients. Data were collected of 651 patients for 2008 incidence.
Of the total number of centres, 19 have data bases for AVF follow-up and carry out an annual evaluation of indicators. Only 17 of the 35 centres have complete protocols, agreed between the nephrology, surgery and radiology serviced. Nineteen centres have structured ACKD consultations. Surgery is usually ambulatory. In 10 of the 12 centres vascular surgery performs the VA and in 2 centres general surgery does.
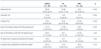
Haemodialysis was begun in 44.8% of the patients in year 2008 by means of a CVC. In December 2008, 29.5% of the patients were using CVC, in comparison with 24.7% in December 2007. Distribution of the type of VA, rate of thrombosis and rate of repair due to global dysfunction, according to type of HD centre, can be seen in Table 1.
The diagnostic methods for VA dysfunction used by the 35 centres were: decrease of dialysis monitor flow pump in 30 centres, increase of dynamic venous pressure on dialysis monitor in 28, increase of negative arterial pressure on dialysis monitor in 24, measurement of Kt/V in 29, recircularisation of VAin 24, measurement of VAflow in 11 and increase of static venous pressure on dialysis monitor in 6.
The nephrological organisation of the centres was considered: good, 16 centres; sufficient, 12 centres; not sufficient, 7 centres. The satisfaction of the nephrologists with the support received from the surgery service has been: good in 5 centres; sufficient in 10 centres and not sufficient in 20 centres. Two centres had a general surgery service carrying out the VA, the others had vascular surgeons performing the VA. In 17 centres satisfaction with the support of vascular radiology was good, in 9 sufficient and in 9 not sufficient. Global assessment scores of the 12 reference centres were good for 2, sufficient for 5 and not sufficient for 5.
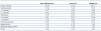
Table 2 shows distribution by type of VA, rate of thrombosis and rate of repair due to dysfunction and percentage of rescue surgery of thrombosed VA according to the global classification of reference centres.
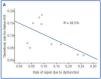
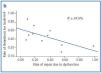
Figures 1a and 1b show an inverse correlation between rate of repair due to VA dysfunction and rate of thrombosis of VA.
The reasons for which patients received dialysis through a catheter at the time of the survey were: AVF exhaustion, 44.17%; pending surgical assessment, 12.97% (less than 3 months, 4.9%; more than 3 months, 8.1%); surgically assessed and on the waiting list, 14.1%; pending VAmaturation, 17.67%; patient refusal, 3.9%; temporary transfer from peritoneal dialysis, 1.5%. Table 3 shows the differences in existent criteria for the use of CVC according to global score of the centres.
DISCUSSION
This study provides updated information on the management of VA in the community with a high level of precision. According to data from the Madrid Register of Renal Diseases (REMER), on 31 December 2008,9 2,462 patients underwent dialysis in Madrid. Therefore, we have available 95% of the patients for obtaining basic data and 74.9% for detailed data on rescue and repair rates.
We confirmed that the current situation of VA in the CAM is not adequate with a high rate of CVC use in return patients (one out of 2). Furthermore, there is an increase in the use of CVC in prevalent cases, which increases from 1 out of 4 in 2007 to almost 1 out of 3 patients in dialysis by the end of 2008. These data are much above the 10% recommended by the S.E.N. vascular access guides of 2005.1 Other studies carried out in centres distributed throughout our national territory have detected an increase in the use of CVC, which increases form 7% in the DOPPS 1 to 21% in DOPPS 3.3 Similarly, the Register of Renal Diseases of Cataluña, in their 2007 report, shows an increase of patients undergoing dialysis through a CVC: 19% in comparison with 12% in 2002.10
In addition, our study identifies large differences between reference centres (hospitals) and non-hospital centres, with a greater use of CVC and Graft-AVF in the first. A possible explanation could be that reference centres dialyse more elderly patients or those with greater comorbidities and, therefore, with a greater probability of dialysis being carried out through a CVC. Previous studies have shown that patients with a CVC have more comorbidities.11 Although it is true that CVC make it possible to continue dialysing, there are many studies that relate the use of CVC with an increase of mortality. A recent publication shows that mortality during the first year of HD is doubled in those that initiate dialysis with CVC.12 Furthermore, the use of CVC at any time during HD is associated with greater mortality, and the time using CVC worsens the prognosis even after correcting the effect due to initial comorbidities.5 Patients with CVC have a higher rate of admissions and infections,13 and this means a higher cost.5 All these reasons make the reduction in the use of CVC a priority objective for greater quality and efficiency, as stated in the S.E.N.1 guides.
Our study also determined for the first time a precise estimation of annual thrombosis rates in our autonomous community. The current objectives of the guides are being complied with, according to these results: Annual rate of thrombosis < 0.25 in Native-AVF and < 0.50 in Graft-AVF1. However, we know that the data obtained may underestimate reality. These values do not include the 8 dialysis units that have not sent complete data, and we may suppose that these centres that do not have structured follow-up systems for VA may have worse results. Other series published in our country report an annual thrombosis rate for Native-AVF of 0.1014 and for Graft-AVF of 0.50 to 0.90.15 The rates of thrombosis have been calculated using the mean prevalence for the time period, according to recommendations of the S.E.N.1 Quality Group. Although the most accurate way of calculating total time at risk is adding time of use of each VA, this is difficult in a retrospective multicentric study of these characteristics.8 Interestingly, we find again differences between reference centres and non-hospital centres, this time related to rates of thrombosis. A possible explanation for these differences lies in the fact that in reference hospitals VA follow-up is less intensive; therefore there is a lower rate of repair due to dysfunction and, therefore, a greater rate of thrombosis for Native-AVF. On the other hand, in the case of Graft-AVF, hospital centres also carry out fewer repairs due to dysfunction, and hospitals could be favoured by the proximity of the Surgery Service and Radiology Service, which allows rescue and repair in less time.
In our study we used a combined assessment method for each centre according to nephrology criteria (existence of CKD consultations, annual information system and VA protocol), surgery and radiology, since results depend on these three factors. Those services better assessed globally present a lower frequency of CVC use, less than half the amount of thrombosis for Native-AVF and Graft-AVF and carry out less early repairs and rescue surgeries due to thrombosed VA. This fact is very relevant, since we are in a universal public health environment, with similar technical and financial resources that provide very different results. There are studies that show that there is a relationship between type of VA and surgical centre; large surgical centres perform more Native-AVF than small surgical centres.16 In our study we found a clearly better score for nephrology and radiology services than for surgical ones. Undoubtedly all three factors influence VA results. The best results have now become quality targets which can be achieved by all, and the differences are mainly of organization and structure.
It has been shown that 80% of thrombosis previously suffer a stenosis which is detectable.17 In our study we found an inverse relationship between rate of repair due to dysfunction and rate of thrombosis for both types of AVF. Therefore, adequate follow-up of AVF is essential to decrease the rate of thrombosis and, in consequence, the probability of requiring a CVC.
Finally, we would like to identify recoverable CVC. We found that 2 out of 5 CVC are considered definitive VA, due to vascular exhaustion. However, this assessment is different in different centres. Therefore, those centres with good global scores consider there is vascular exhaustion in almost 1 out of 3 CVC, in comparison with 1 out of 2 in those with low scores. Furthermore, the teams with the best scores had no patients on the waiting lists or pending assessment for more than 3 months. Each type of centre enters either a vicious or beneficial VA circle, that conditions subsequent results. However, the first cause of permanence of a catheter is AVF exhaustion, both in services with better scores and others. Thus, although there is margin of action to decrease the number of catheters, there are other reasons, such as age and comorbidities that do not permit the performance of a VA. A recent study has shown that, although it is possible to improve the trend in the use of catheters, only a discreet improvement is achieved throughout a prolonged process free from complications.18
In short, in the same environment, a single province autonomous community, with an almost uniform management model, there is great variability in results in relation to VA, depending on the type of centre where the patient undergoes dialysis, the vascular radiology service and, especially, the surgical service responsible for the VA. However, we must not forget that VA management requires a multidisciplinary approach,8 and that, irrespective of the radiology and surgery services, to be able to repair an AVF it is necessary to previously diagnose dysfunction, which will be done by the nursing service and the nephrologists. It is worrying that, in several centres, repairs due to dysfunction are practically inexistent. It is not clear whether this can improve with greater dedication on the part of the nephrologists to early diagnosis, or greater collaboration between the radiology and surgery services.
Everybody knows how their centre works and therefore knows the answer.
In view of the results obtained, an improvement plan has been addressed at a general level for the CAM and at each centre. There has been some previous experience which has shown that the implementation of these improvement plans gives rise to an increase in Native-AVF and preventive repairs of Native-AVF.19,20 The investments made in improving this treatment can be recovered by savings in other items, such as a reduction of admissions, costs of treatments, savings in erythropoietic agents, etc. In fact, the importance of this study lies in the fact that a joint project is underway overseen by the Health Council and sponsored by SOMANE, with the collaboration of ALCER-Madrid.9 For this reason, the results obtained have been made known to the services involved and several joint meetings have been organised to establish a precise diagnosis of the problem and identify possible solutions. We identified 3 key points to improve VA:
-VA management is a continuous process of creation and maintenance that must be regulated by a multidisciplinary protocol in each centre.
-Construction or repair of VA must be a preferential surgery performed in a short period of time, and if necessary, an extraordinary activity.
-The support of the health authorities is necessary to convert VA maintenance in a priority and to allow, if necessary, coordination of tasks between centres when a local solution is not available.

Table 1. Characteristics of vascular access according to type of haemodialysis centre in December 2008

Table 2. Characteristics of vascular access according to global score of the reference centre

Figure 1a. Correlation between rate of repair due to dysfunction and rate of thrombosis in native arteriovenous fistula (native- AVF), grouped by reference centre.

Figure 1b. Correlation between rate of repair due to dysfunction and rate of thrombosis in prosthetic arteriovenous fistula (Graft-AVF), grouped by reference centre.

Table 3. Reasons due to which the patient continues with a catheter according to the global score of the centre


