

Fluid overload is an important factor of morbidity and mortality in hemodialysis patients. Today correct determination of dry weight (DW) remains an important issue of hemodialysis practice. Within this context, it is subjected to new method searching. The objective of this study was to calculate estimated pulmonary capillary wedge pressure (ePCWP) with Tissue Doppler Imaging (TDI) in hemodialysis patients and to evaluate its correlation with the other volume markers and to evaluate whether it can be a new method for detection of DW.
Materials and methodsEchocardiographic, hemodynamic, and biochemical volume markers of 41 hemodialysis patients were evaluated in the pre- and post-dialysis periods. Patients were divided into two groups based on ePCWP values (Group 1 ePCWP<20mmHg, Group 2 ePCWP>20mmHg).
ResultsIn the pre-dialysis period; parameters related to volume load including ePCWP, systolic blood pressure, mean arterial pressure, pulse pressure, left atrial diameter, left atrial volume, E/é, ratio and E/Vp ratio were statistically significantly higher in Group2 compared to Group1. On the other hand, strong correlations were found between pre-dialysis ePCWP and systolic blood pressure, mean arterial pressure, pulse pressure, NT-ProBNP, left atrial diameter, E/é ratio and E/Vp ratio.
ConclusionsStrong correlations found between ePCWP which was calculated with TDI and the other volume markers both in pre-dialysis and post-dialysis periods. These findings can provide a significant contribution to routine evaluating of DW in hemodialysis patients. From this aspect, the prediction of ePCWP with TDI can be a new practical and reproducible method for the determination of DW.
La hipervolemia es un factor importante de morbimortalidad en pacientes en hemodiálisis. Actualmente, la determinación correcta del peso seco (PS) sigue siendo un aspecto importante en la práctica de la hemodiálisis. Por este motivo se siguen buscando nuevos métodos. El objetivo de este estudio fue calcular la presión capilar pulmonar (PCPe) mediante ecografía Doppler tisular (EDT) en pacientes en hemodiálisis, con el fin de evaluar su correlación con los demás marcadores de volumen y valorar si podría ser un nuevo método para la determinación del PS.
Materiales y métodosSe evaluaron los marcadores de volumen ecocardiográficos, hemodinámicos y bioquímicos de 41 pacientes en hemodiálisis en los periodos previos y posteriores a la diálisis. Los pacientes se dividieron en 2 grupos en función de los valores de PCPe (PCPe del grupo 1<20mmHg, PCPe del grupo 2>0mmHg).
ResultadosEn el periodo previo a la diálisis, los parámetros relacionados con la carga de volumen, como la PCPe, la presión arterial sistólica, la presión arterial media, la presión diferencial, el diámetro auricular izquierdo, el volumen auricular izquierdo y los cocientes E/é y E/Vp fueron superiores de forma estadísticamente significativa en el grupo 2 en comparación con el grupo 1. Por otro lado, se observaron correlaciones importantes entre la PCPe previa a la diálisis y la presión arterial sistólica, la presión arterial media, la presión diferencial, el NT-proBNP, el diámetro auricular izquierdo y los cocientes E/é y E/Vp.
ConclusionesSe observaron correlaciones importantes entre la PCPe calculada mediante EDT y los demás marcadores de volumen, tanto en el periodo previo a la diálisis como en el posterior. Estos resultados pueden representar una contribución significativa a la evaluación ordinaria del PS en pacientes en hemodiálisis. Desde este punto de vista, la predicción de la PCPe mediante EDT puede ser un método práctico y reproducible para la determinación del PS.
Fluid overload is an important factor of morbidity and mortality in hemodialysis patients, and providing normovolemia is an important component of the prescription and sufficiency of hemodialysis. Also known as “dry weight”, normovolemia is attempted to be estimated with several methods such as clinical evaluation, echocardiography, the diameter of the inferior vena cava, lung ultrasonography, and bioimpedance, and through measurement of biochemical parameters such as brain natriuretic peptide (BNP) or N-terminal-pro brain natriuretic peptide (NT-proBNP). Because overestimated dry weight may lead to serious morbidities such as fluid load, pulmonary oedema, cardiac failure, and hypertension, while underestimated dry weight may cause muscle cramps, intradialytic hypotension and associated ischemic attacks, resulting in increased mortality in hemodialysis patients.1–5 Today dry weight which is attempted to be predicted by clinic evaluation and combination of these methods remains an important issue of hemodialysis practice. Within this context, it is subjected to new method searching. Tissue Doppler Imaging (TDI) technique analyzes myocardial velocities, providing an evaluation of the cardiac functions. In clinical practice, it allows evaluating systolic and diastolic functions of the ventricles regionally or as a whole. Positive or negative Doppler waves are obtained according to the movement direction of myocardium at systole and diastole (Fig. 1). Since the obtained data belong only to the region of sampling, systolic and diastolic functions of the myocardium can be evaluated individually for each segment. TDI can detect diastolic and systolic dysfunctions that are resulted from ageing, hypertension, ischemic heart disease, aortic stenosis, hypertrophic cardiomyopathy and various diseases showing myocardial involvement. Parameters obtained with TDI can be used not only for diagnosis but also for the prediction of prognosis and evaluation of the effects of treatment. Early diastolic myocardial peak velocity (é) has been shown to have a linear association with the decrease rate of left ventricular pressure at early diastole.6 Regional systolic dysfunction can be detected with tissue Doppler imaging in ischemic heart diseases. Ventricular systolic myocardial peak velocity (S′) was found lower in the infarction areas with TDI.7 Although heart catheterization is the gold standard method in measurement of the ventricular filling pressure which is an important marker of the volume status, its use in the practice is limited since this method is expensive and not reproducible. With the TDI technique, left ventricular end-diastole pressure can be calculated by evaluating the transmitral flow. The relationship between ventricular filling pressure changes and Doppler velocity changes has been shown with simultaneously made invasive left ventricular pressure measurements and Doppler measurements.8 The ratio of mitral flow early diastolic velocity (E) to early diastolic myocardial peak velocity obtained from the mitral annulus with TDI (é), ie (E/é) is correlated with invasively measured left ventricular end-diastole pressure. When E/é>10, left ventricular end diastole pressure was found to be>15mmHg with 85% sensitivity, and 77% specificity. Again using these data, estimated pulmonary capillary wedge pressure can be calculated using the formula of ePCWP=1.9+1.24 (E/é).9

Positive or negative waves in pulsed wave doppler and tissue doppler imaging. Abbreviations: A; mitral late diastolic peak velocity, A′; late diastolic myocardial peak velocity, DT; deceleration time, E; early mitral diastolic peak velocity, é; early diastolic myocardial peak velocity, IVC; isovolumetric contraction, IVRT; isovolumetric relaxation time, S′; systolic myocardial peak velocity.
Studies evaluating cardiac function with this method in chronic kidney patients are limited and quite new. It is possible to obtain important data for the evaluation of volume load in the cases of end-stage renal disease (ESRD) with TDI because of the detailed information about ventricular filling pressure provided by this method. In this study, we aimed to evaluate the relationship between ePCWP calculated with TDI and the other parameters that are related to volume load.
Materials and methodsStudy design and patientsThe study included 41 patients aged over 18 years who were receiving HD for at least three months for ESRD which was developed due to any reason. All patients were informed about the study and gave written consent.
Exclusion Criteria: Patients with malignant disease, uncontrolled psychiatric disease, patients with poor general status and paralytic patients, pregnancy, patients with alcohol, intravenous drug and substance addiction, branch block, rhythm disorder, patients with severe heart failure, and valvular damage, patients receiving HD for the first time, and those with chronic obstructive pulmonary disease and pulmonary hypertension were excluded from the study.
Detailed histories and physical examination findings of all patients included in the study were recorded. Ambulatory blood pressure monitoring device was inserted one hour before the HD procedure. Basal echocardiography was performed before hemodialysis, and control echocardiography was taken at the end of the 4-h HD session. Again, blood samples were collected for electrolyte levels and other biochemical analyses before HD and at the end of the 4-h HD session. Routine procedures and previous treatments of the patients were continued during hemodialysis sessions.
Ambulatory blood pressure monitoringBeginning one hour before HD, blood pressure was measured at 15-min intervals using an ambulatory blood pressure monitoring (ABPM) device (Mobil-Q-Graph New Generation 24h ABP-Control, I.E.M. GmbH. Stolberg, Germany) during HD and subsequent one hour. The records were analyzed using Hypertension Management Software of Windows analyzer software (I.E.M. GmbH. Stolberg, Germany) by the same physician.
NT-ProBNP measurementBlood samples were collected from the antecubital vein into EDTA tubes for NT-ProBNP measurements before hemodialysis, and following a 15-min resting period after hemodialysis. Plasma NT-ProBNP level was used with an enzyme immunoassay method using Biomedica (Slovakia) brand NT-proBNP kit is fully automated Triturus (Italy) device.
Echocardiographic examination protocolTDI and two-dimensional echocardiographic examinations were performed in all patients using 3.5MHz transducers with echocardiography device (Vivid 7, GE Healthcare, USA) before and after hemodialysis following a resting period of 10min. Echocardiograms of all patients were recorded in the left lateral lying position as standard parasternal and apical images. The measurements and recordings were made as normal inhalation and end-exhalation. M-mode, pulse, and continuous-wave Doppler records were obtained for each patient. All measures were made by a single cardiologist based on the standards of the American Society of Echocardiography. Left atrial volumes were measured with the modified Simpson methods on two planes. All echocardiographic measurements were performed in 5 consecutive cycles, and averages of them were used. M-mode records were made at 50mm/s and Doppler records at 100mm/s.
Left atrial diameter (LAD), left ventricular end-diastolic diameter (LVEDD), left ventricular end-systolic diameter (LVESD), pulse volume, left atrial volume (LAV), cardiac output and ejection fraction (EF) was determined from the records obtained with conventional echocardiography. Transmitral flow velocities were recorded from the apical window using 1–3mm sampling volume among ends of the mitral leaflets lying along diastole. In the pulse wave, echocardiographic transmitral flow screenings; early diastolic filling peak velocity (E), late diastolic peak velocity at atrial contraction (A) and transmitral flow propagation velocity (Vp) were measured based on apical 4-chamber window reference images. Left ventricular systolic myocardial peak velocity (LV S′), right ventricular systolic myocardial peak velocity (RV S′), early diastolic myocardial peak velocity (é) and late diastolic myocardial peak velocity (A′) were recorded with tissue Doppler echocardiography in the septal and lateral mitral and tricuspid lateral region using 5mm sampling volume from apical 4-chamber window images. All Doppler measurements were made manually. The ratio of early diastolic mitral peak velocity (E)/early diastolic myocardial peak velocity (é) was calculated as a marker of the left ventricular filling pressure using the formula of ePCWP=1.9+1.24 (E/é). E/A, E/é and E/Vp rates were calculated from the data we obtained, E/é as a parameter of left ventricular filling and ePCWP from the formula of ePCWP=1.9+1.24 (E/é).9,10 Patients were divided into two groups based on ePCWP values calculated with TDI (Group 1 ePCWP<20mmHg, Group 2 ePCWP>20mmHg). The correlations between volume status-related markers such as estimated PCWP and left atrial diameter (LAD), left atrial volume (LAV), systolic blood pressure (SBP) and NT pro-BNP levels were studied.
Statistical analysisStatistical analysis of all data obtained in the study was carried out using SPSS (Statistical Package for Social Sciences) for Windows 18 software. Descriptive statistics are expressed as mean and standard deviation values. Evaluation of the data was performed using Chi-square, Mann–Whitney U test, and Spearman's correlation analysis. Data are expressed as arithmetic mean±standard deviation and number of subjects in the tables, and p values<0.05 were considered statistically significant.
EthicsThe study was approved by the Cumhuriyet University Human Ethics Committee. The study adhered to the tenets of the Declaration of Helsinki. Written informed consent was obtained from all participants before their enrollment.
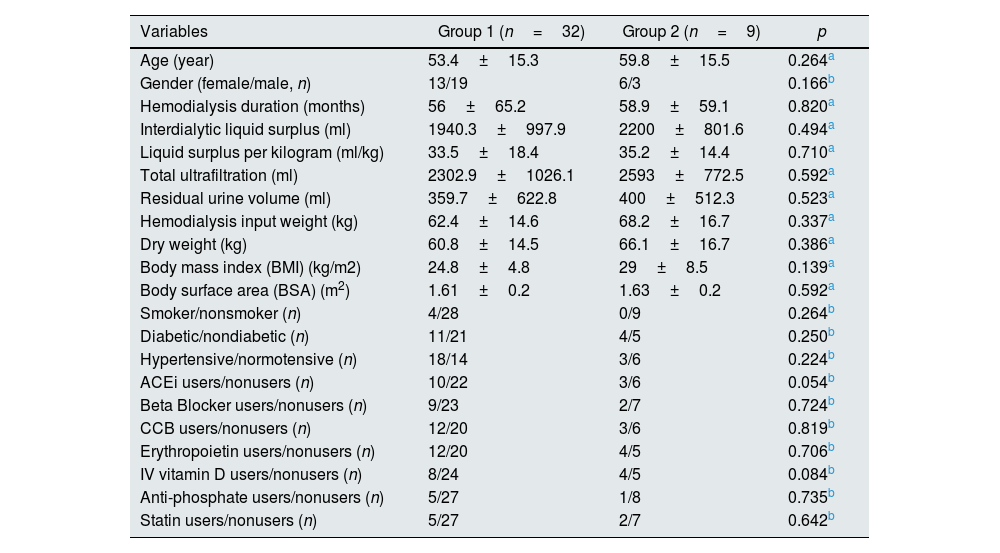
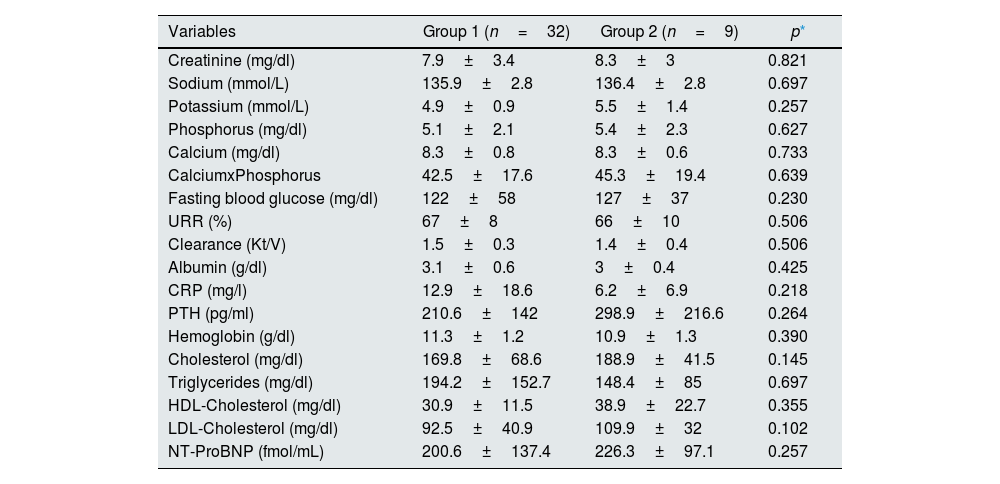
ResultsNo significant difference was found between the groups in terms of demographics and biochemical analyses (Tables 1 and 2).
Demographic charactheristics of the study groups.
| Variables | Group 1 (n=32) | Group 2 (n=9) | p |
|---|---|---|---|
| Age (year) | 53.4±15.3 | 59.8±15.5 | 0.264a |
| Gender (female/male, n) | 13/19 | 6/3 | 0.166b |
| Hemodialysis duration (months) | 56±65.2 | 58.9±59.1 | 0.820a |
| Interdialytic liquid surplus (ml) | 1940.3±997.9 | 2200±801.6 | 0.494a |
| Liquid surplus per kilogram (ml/kg) | 33.5±18.4 | 35.2±14.4 | 0.710a |
| Total ultrafiltration (ml) | 2302.9±1026.1 | 2593±772.5 | 0.592a |
| Residual urine volume (ml) | 359.7±622.8 | 400±512.3 | 0.523a |
| Hemodialysis input weight (kg) | 62.4±14.6 | 68.2±16.7 | 0.337a |
| Dry weight (kg) | 60.8±14.5 | 66.1±16.7 | 0.386a |
| Body mass index (BMI) (kg/m2) | 24.8±4.8 | 29±8.5 | 0.139a |
| Body surface area (BSA) (m2) | 1.61±0.2 | 1.63±0.2 | 0.592a |
| Smoker/nonsmoker (n) | 4/28 | 0/9 | 0.264b |
| Diabetic/nondiabetic (n) | 11/21 | 4/5 | 0.250b |
| Hypertensive/normotensive (n) | 18/14 | 3/6 | 0.224b |
| ACEi users/nonusers (n) | 10/22 | 3/6 | 0.054b |
| Beta Blocker users/nonusers (n) | 9/23 | 2/7 | 0.724b |
| CCB users/nonusers (n) | 12/20 | 3/6 | 0.819b |
| Erythropoietin users/nonusers (n) | 12/20 | 4/5 | 0.706b |
| IV vitamin D users/nonusers (n) | 8/24 | 4/5 | 0.084b |
| Anti-phosphate users/nonusers (n) | 5/27 | 1/8 | 0.735b |
| Statin users/nonusers (n) | 5/27 | 2/7 | 0.642b |
Abbreviations; ACEi, angiotensin-converting enzyme inhibitors; CCB, calcium channel blocker.
Biochemical analysis of study groups.
| Variables | Group 1 (n=32) | Group 2 (n=9) | p* |
|---|---|---|---|
| Creatinine (mg/dl) | 7.9±3.4 | 8.3±3 | 0.821 |
| Sodium (mmol/L) | 135.9±2.8 | 136.4±2.8 | 0.697 |
| Potassium (mmol/L) | 4.9±0.9 | 5.5±1.4 | 0.257 |
| Phosphorus (mg/dl) | 5.1±2.1 | 5.4±2.3 | 0.627 |
| Calcium (mg/dl) | 8.3±0.8 | 8.3±0.6 | 0.733 |
| CalciumxPhosphorus | 42.5±17.6 | 45.3±19.4 | 0.639 |
| Fasting blood glucose (mg/dl) | 122±58 | 127±37 | 0.230 |
| URR (%) | 67±8 | 66±10 | 0.506 |
| Clearance (Kt/V) | 1.5±0.3 | 1.4±0.4 | 0.506 |
| Albumin (g/dl) | 3.1±0.6 | 3±0.4 | 0.425 |
| CRP (mg/l) | 12.9±18.6 | 6.2±6.9 | 0.218 |
| PTH (pg/ml) | 210.6±142 | 298.9±216.6 | 0.264 |
| Hemoglobin (g/dl) | 11.3±1.2 | 10.9±1.3 | 0.390 |
| Cholesterol (mg/dl) | 169.8±68.6 | 188.9±41.5 | 0.145 |
| Triglycerides (mg/dl) | 194.2±152.7 | 148.4±85 | 0.697 |
| HDL-Cholesterol (mg/dl) | 30.9±11.5 | 38.9±22.7 | 0.355 |
| LDL-Cholesterol (mg/dl) | 92.5±40.9 | 109.9±32 | 0.102 |
| NT-ProBNP (fmol/mL) | 200.6±137.4 | 226.3±97.1 | 0.257 |
Abbreviations: CRP, C reactive protein; HDL, High-density lipoprotein; LDL, low-density lipoprotein; NT-ProBNP, N-terminal of the prohormone brain natriuretic peptide; PTH, parathyroid hormone; URR, urea reduction ratio.
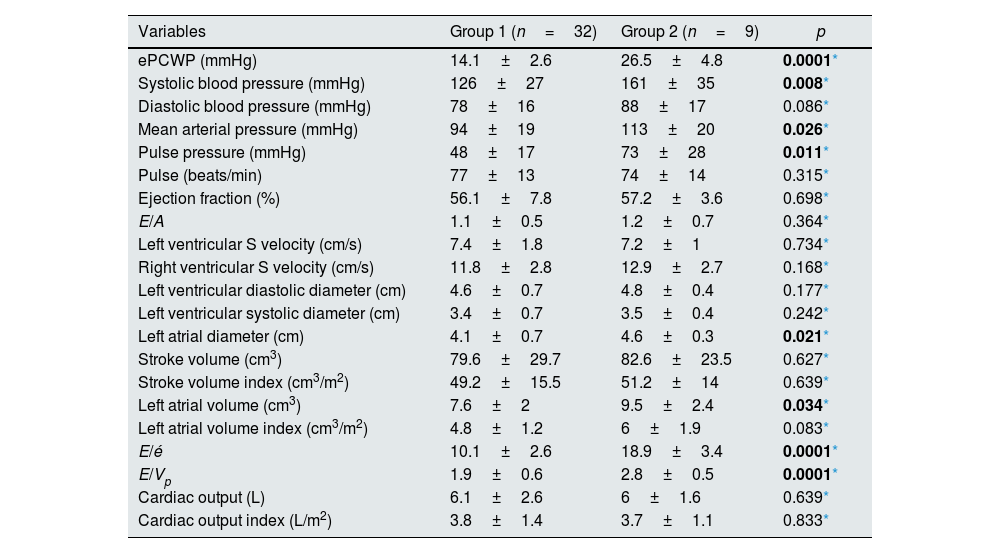
When the groups were compared before dialysis; ePCWP (26.5±4.8 vs 14.1±2.6, p=0.0001), systolic blood pressure (161±35 vs 126±27mmHg, p=0.008), mean arterial pressure (113±20 vs 94±19mmHg, p=0.026) and pulse pressure (73±28 vs 48±17mmHg, p=0.011) values were statistically significantly higher in the second group. Comparing the echocardiographic data; parameters related to volume load including left atrial diameter (4.6±0.3 vs 4.1±0.7cm, p=0.021), left atrial volume (9.5±2.4 vs 7.6±2cm3, p<0.034), E/é ratio (18.9±3.4 vs 10.1±2.6, p=0.0001) and E/Vp (2.8±0.5 vs 1.9±0.6, p=0.0001) ratio was statistically significantly higher in Group 2 (Table 3).
Hemodynamic and echocardiographic features in the pre-dialysis period.
| Variables | Group 1 (n=32) | Group 2 (n=9) | p |
|---|---|---|---|
| ePCWP (mmHg) | 14.1±2.6 | 26.5±4.8 | 0.0001* |
| Systolic blood pressure (mmHg) | 126±27 | 161±35 | 0.008* |
| Diastolic blood pressure (mmHg) | 78±16 | 88±17 | 0.086* |
| Mean arterial pressure (mmHg) | 94±19 | 113±20 | 0.026* |
| Pulse pressure (mmHg) | 48±17 | 73±28 | 0.011* |
| Pulse (beats/min) | 77±13 | 74±14 | 0.315* |
| Ejection fraction (%) | 56.1±7.8 | 57.2±3.6 | 0.698* |
| E/A | 1.1±0.5 | 1.2±0.7 | 0.364* |
| Left ventricular S velocity (cm/s) | 7.4±1.8 | 7.2±1 | 0.734* |
| Right ventricular S velocity (cm/s) | 11.8±2.8 | 12.9±2.7 | 0.168* |
| Left ventricular diastolic diameter (cm) | 4.6±0.7 | 4.8±0.4 | 0.177* |
| Left ventricular systolic diameter (cm) | 3.4±0.7 | 3.5±0.4 | 0.242* |
| Left atrial diameter (cm) | 4.1±0.7 | 4.6±0.3 | 0.021* |
| Stroke volume (cm3) | 79.6±29.7 | 82.6±23.5 | 0.627* |
| Stroke volume index (cm3/m2) | 49.2±15.5 | 51.2±14 | 0.639* |
| Left atrial volume (cm3) | 7.6±2 | 9.5±2.4 | 0.034* |
| Left atrial volume index (cm3/m2) | 4.8±1.2 | 6±1.9 | 0.083* |
| E/é | 10.1±2.6 | 18.9±3.4 | 0.0001* |
| E/Vp | 1.9±0.6 | 2.8±0.5 | 0.0001* |
| Cardiac output (L) | 6.1±2.6 | 6±1.6 | 0.639* |
| Cardiac output index (L/m2) | 3.8±1.4 | 3.7±1.1 | 0.833* |
Abbreviations: A, late diastolic mitral peak velocity; E, early diastolic mitral peak velocity; é, early diastolic myocardial peak velocity; ePCWP, estimated pulmonary capillary wedge pressure; Vp, transmitral flow propagation velocity.
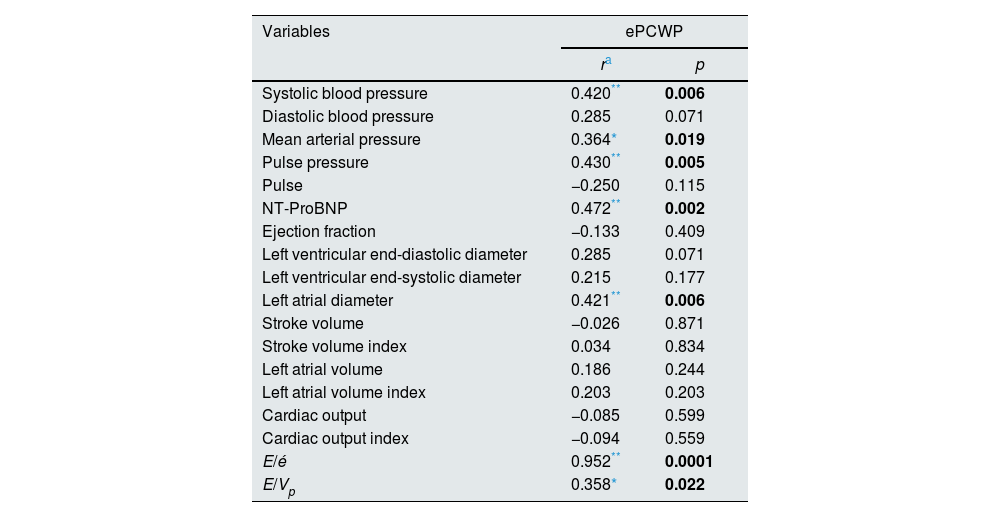
On the other hand, a strong correlation was found between predialysis ePCWP and volume related hemodynamic parameters including systolic blood pressure (r=0.420, p=0.006), mean arterial pressure (r=0.364, p=0.019) and pulse pressure (r=0.430, p=0.005), biochemical parameters such as NT-ProBNP (r=0.472, p=0.002), and echocardiographic parameters such as left atrial diameter (r=0.421, p=0.006), E/é ratio (r=0.952, p=0.0001) and E/Vp ratio (r=0.358, p=0.022) (Table 4).
Correlation of the other parameters that relationship to volume overload with ePCWP in the pre-dialysis period.
| Variables | ePCWP | |
|---|---|---|
| ra | p | |
| Systolic blood pressure | 0.420** | 0.006 |
| Diastolic blood pressure | 0.285 | 0.071 |
| Mean arterial pressure | 0.364* | 0.019 |
| Pulse pressure | 0.430** | 0.005 |
| Pulse | −0.250 | 0.115 |
| NT-ProBNP | 0.472** | 0.002 |
| Ejection fraction | −0.133 | 0.409 |
| Left ventricular end-diastolic diameter | 0.285 | 0.071 |
| Left ventricular end-systolic diameter | 0.215 | 0.177 |
| Left atrial diameter | 0.421** | 0.006 |
| Stroke volume | −0.026 | 0.871 |
| Stroke volume index | 0.034 | 0.834 |
| Left atrial volume | 0.186 | 0.244 |
| Left atrial volume index | 0.203 | 0.203 |
| Cardiac output | −0.085 | 0.599 |
| Cardiac output index | −0.094 | 0.559 |
| E/é | 0.952** | 0.0001 |
| E/Vp | 0.358* | 0.022 |
Abbreviations; E, early diastolic mitral peak velocity; é, early diastolic myocardial peak velocity; NT-ProBNP, N-terminal of the prohormone brain natriuretic peptide; ePCWP, estimated pulmonary capillary wedge pressure; Vp, transmitral flow propagation velocity.
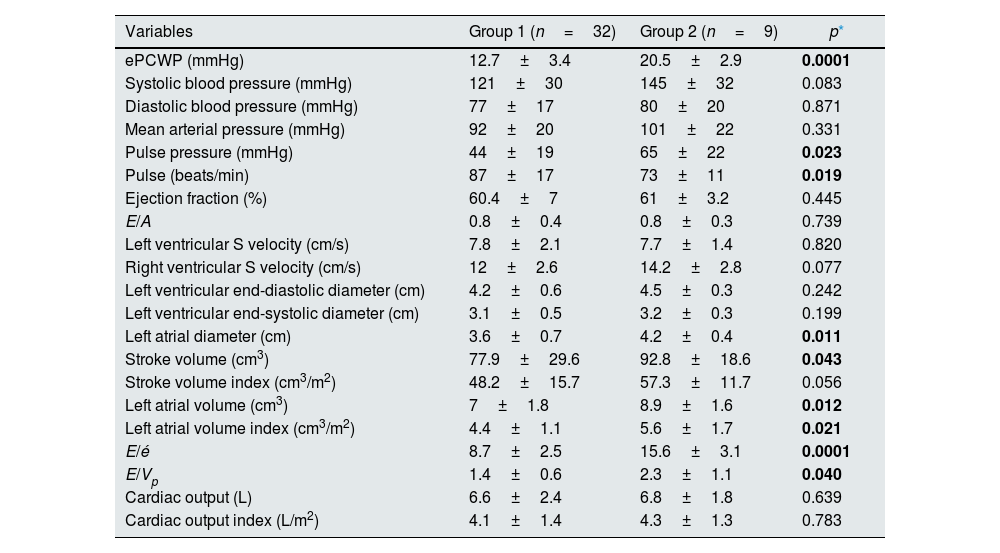
When the groups were compared in the post-dialysis period; ePCWP (20.5±2.9 vs 12.7±3.4, p=0.0001), and pulse pressure (65±22 vs 44±19, p=0.023) were significantly higher, and pulse (73±11 vs 87±17, p=0.019) was significantly lower in the second group.
No significant difference was found between the groups in terms of the other hemodynamic parameters evaluated. Comparing echocardiographic data in the post-dialysis period; left atrial diameter (4.2±0.4 vs 3.6±0.7, p=0.011), left atrial volume (8.9±1.6 vs 7±1.8, p=0.012), left atrial volume index (5.6±1.7 vs 4.4±1.1, p=0.021), stroke volume (92.8±18.6 vs 77.9±29.6, p=0.043), E/é ratio 15.6±3.1 vs 8.7±2.5, p=0.0001), and E/Vp ratio (2.3±1.1 vs 1.4±0.6, p=0.040) were significantly higher in Group 2 (Table 5).
Hemodynamic and echocardiographic features in the post-dialysis period.
| Variables | Group 1 (n=32) | Group 2 (n=9) | p* |
|---|---|---|---|
| ePCWP (mmHg) | 12.7±3.4 | 20.5±2.9 | 0.0001 |
| Systolic blood pressure (mmHg) | 121±30 | 145±32 | 0.083 |
| Diastolic blood pressure (mmHg) | 77±17 | 80±20 | 0.871 |
| Mean arterial pressure (mmHg) | 92±20 | 101±22 | 0.331 |
| Pulse pressure (mmHg) | 44±19 | 65±22 | 0.023 |
| Pulse (beats/min) | 87±17 | 73±11 | 0.019 |
| Ejection fraction (%) | 60.4±7 | 61±3.2 | 0.445 |
| E/A | 0.8±0.4 | 0.8±0.3 | 0.739 |
| Left ventricular S velocity (cm/s) | 7.8±2.1 | 7.7±1.4 | 0.820 |
| Right ventricular S velocity (cm/s) | 12±2.6 | 14.2±2.8 | 0.077 |
| Left ventricular end-diastolic diameter (cm) | 4.2±0.6 | 4.5±0.3 | 0.242 |
| Left ventricular end-systolic diameter (cm) | 3.1±0.5 | 3.2±0.3 | 0.199 |
| Left atrial diameter (cm) | 3.6±0.7 | 4.2±0.4 | 0.011 |
| Stroke volume (cm3) | 77.9±29.6 | 92.8±18.6 | 0.043 |
| Stroke volume index (cm3/m2) | 48.2±15.7 | 57.3±11.7 | 0.056 |
| Left atrial volume (cm3) | 7±1.8 | 8.9±1.6 | 0.012 |
| Left atrial volume index (cm3/m2) | 4.4±1.1 | 5.6±1.7 | 0.021 |
| E/é | 8.7±2.5 | 15.6±3.1 | 0.0001 |
| E/Vp | 1.4±0.6 | 2.3±1.1 | 0.040 |
| Cardiac output (L) | 6.6±2.4 | 6.8±1.8 | 0.639 |
| Cardiac output index (L/m2) | 4.1±1.4 | 4.3±1.3 | 0.783 |
Abbreviations: A, late diastolic mitral peak velocity; E, early diastolic mitral peak velocity; é, early diastolic myocardial peak velocity; ePCWP, estimated pulmonary capillary wedge pressure; Vp, transmitral flow propagation velocity.
* Mann–Whitney U test.
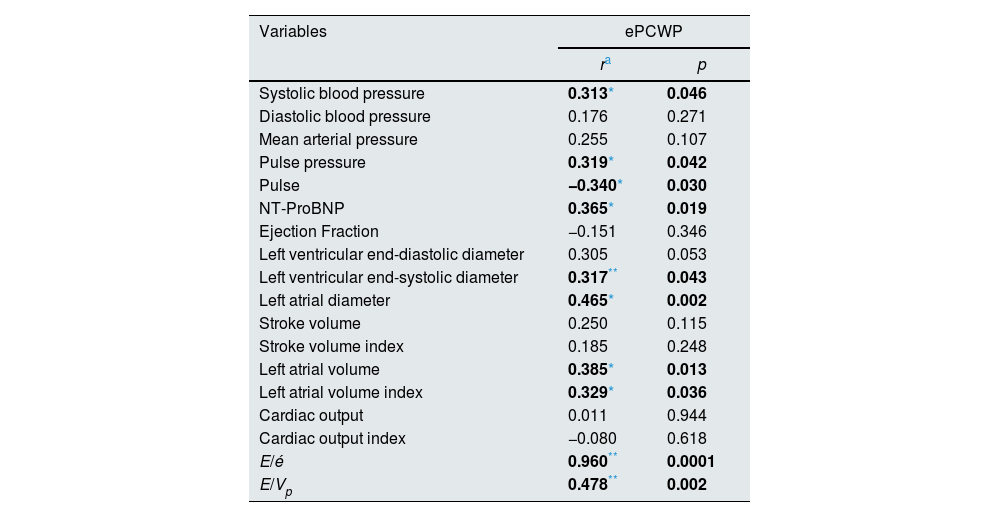
On the other hand, it was found that the correlation between ePCWP and volume status related biochemical, hemodynamic, and echocardiographic parameters such as systolic blood pressure (r=0.313, p=0.046), pulse pressure (r=0.319, p=0.042), pulse (r=−0.340, p=0.030), NT-ProBNP (r=0.365, p=0.019), left ventricular end-systolic diameter (r=0.317, p=0.043), left atrial diameter (r=0.46521, p=0.002), left atrial volume (r=0.385, p=0.013), left atrial volume index (r=0.329, r=0.036) E/é ratio (r=0.960, p=0.0001) and E/Vp ratio (r=0.478, p=0.002) was continued in the post-dialysis period, similar to the pre-dialysis period (Table 6).
Correlation of the other parameters that relationship to volume overload with ePCWP in the post-dialysis period.
| Variables | ePCWP | |
|---|---|---|
| ra | p | |
| Systolic blood pressure | 0.313* | 0.046 |
| Diastolic blood pressure | 0.176 | 0.271 |
| Mean arterial pressure | 0.255 | 0.107 |
| Pulse pressure | 0.319* | 0.042 |
| Pulse | −0.340* | 0.030 |
| NT-ProBNP | 0.365* | 0.019 |
| Ejection Fraction | −0.151 | 0.346 |
| Left ventricular end-diastolic diameter | 0.305 | 0.053 |
| Left ventricular end-systolic diameter | 0.317** | 0.043 |
| Left atrial diameter | 0.465* | 0.002 |
| Stroke volume | 0.250 | 0.115 |
| Stroke volume index | 0.185 | 0.248 |
| Left atrial volume | 0.385* | 0.013 |
| Left atrial volume index | 0.329* | 0.036 |
| Cardiac output | 0.011 | 0.944 |
| Cardiac output index | −0.080 | 0.618 |
| E/é | 0.960** | 0.0001 |
| E/Vp | 0.478** | 0.002 |
Abbreviations; E, early diastolic mitral peak velocity; é, early diastolic myocardial peak velocity; NT-ProBNP, N-terminal of the prohormone brain natriuretic peptide; ePCWP, estimated pulmonary capillary wedge pressure; Vp, transmitral flow propagation velocity.
A new method based on estimated PCWP by tissue doppler has been presented which provides an objective prediction of optimal volume status or dry weight in this paper. The annual rate of mortality from cardiovascular diseases in end-stage renal failure is 9%, accounting for 50% of deaths.11 Cardiovascular problems largely begin in the predialysis period and continues with an increase in size during dialysis. A high portion such as 25–50% of patients who newly starts to dialysis had a cardiac failure, and this causes a dramatic decrease in survival rates. Hypervolemia induced increase in the left ventricular pressure and volume is an important factor which significantly increases mortality and morbidity.12–14 Hypertension (HT) which is a very important cardiac risk factor varies according to the cause and stage of CKD (chronic kidney disease), although it is seen between 60% and 100% with the most important cause being increased intravascular volume.15,16 On the other hand, increased volume load increases ventricular diastolic pressure, decreasing coronary perfusion pressure.
Over fluid load is one of the most common, and reversible risk factors associated with a high mortality rate in HD patients.17 With this regard, the determination of dry weight correctly is important. On the other hand, the correct estimate of dry weight is an important and challenging issue of hemodialysis practice, and remain a great problem for nephrologists. It is attempted to be predicted with a combination of clinical evaluation and the data obtained with many old and new methods. None of the physical and other methods gives definite results.18 Today there is not gold standard to evaluate volume status in ESRD patients, and also there is no a uniform standard for the definition of dry weight. Alternative methods used for prediction of dry weight have significant limitations. This brings new seeking together.
Brain natriuretic peptide (BNP) levels are widely used to estimate fluid overload in hemodialysis patients.19,20 Similarly to BNP, NT proBNP levels are strongly associated with fluid overload, and thus functions as guidelines for fluid load in HD patients.21–24 However, BNP levels also increase with the other causes of myocardial stress.25 BMP levels were persistently high in patients with chronic heart failure despite a basal dry weight.26 These factors limit the reliability of BNP in the prediction of dry weight.
Bioimpedance spectroscopy (BIS) is a promising application which has been come into prominence recently the correct determination of dry weight. It has been reported that heart rate variability and blood pressure parameters can be used together with BIS in the determination of dry weight.27–29 However, skin changes, inadequate adhesion to the electrodes, electrical parasites and obesity limit the use of the BIS method for determination of dry weight.28,30 Lung ultrasonography (LUS) is a new and simple method which appropriately evaluates extravascular lung water (EVLW).31 In the presence of interstitial–alveolar fluid transition, vertical artefacts resulted from the pleura appear. These are called B-lines. The number of B-lines depends on the degree of pulmonary ventilation loss. Because a positive linear correlation has been shown between the amount of B-lines and EVLW.32–34 As EVLW increases, air content decreases and the number of B-lines increases in the lungs.35 These observations indicate that early-onset pulmonary congestion can be detected with LUS. It has been shown that B-lines significantly decrease as the result of decreased pulmonary congestion with the treatment of acute cardiac failure.36 It has been reported that LUS is a reliable method in the detection of the rapid changes in extravascular lung fluid in hemodialysis patients.37,38 On the other hand, it has been stated that LUS may be a more suitable method together with BIS in the determination of dry weight.39 Within this context, LUS comes into prominence with being a non-invasive method which can be performed at the bedside, rapidly and in every patient position, and its use is increasingly becoming widespread.
However, being person dependent, obesity, presence of emphysema and rib artefacts limit its suitability. The fluid load is an important cause of increased blood pressure in hemodialysis patients. The volume increase is significantly correlated with 24-h arterial pressure and randomized pre-dialysis blood pressure measurements, and blood pressure values are decreased with normalization of the hydration status of the patient.40 From this point of view, it has been proposed that blood pressure parameters, and especially pre-dialysis pulse pressure, post-dialysis pulse pressure, and systolic blood pressure can be used as a reference in predicting dry weight.41 However, besides volume status many factors change hemodynamic parameters including hemodialysis procedure itself,42 limiting blood pressure parameters to be used as appropriate criteria.
Inferior vena cava diameter (IVCD) and collapse index have been shown to reflect individual fluid status.43 Although there are numerous studies showing the validity of IVCD in the determination of dry weight, optimal timing for a rebalancing of interstitial and intravascular compartments, and post-HD after some time of HD is not clear, measurements show personal variability and are influenced by the right heart valve pathologies, limiting its reliability.44 Again in a study with BIS, no correlation could be demonstrated between IVCD and BIS volume parameters.18,45,46
Blood volume monitoring (BVM) is a commonly used technique in guiding ultrafiltration (UF) in HD. However, percent change in blood volume (BV) during HD sessions depends not only on the amount of extracellular fluids but also on several factors such as oncotic pressure and more importantly rate of UF. Therefore, BV is a weak marker of volume load in HD patients.47 Besides a correct prediction, an important factor in these methods is practicability and reproducibility.48
In summary, many methods have been developed in the evaluation of dry weight, and are currently being developed. In the present study, a method with high practicability and reproducibility which could be an alternative to the above-mentioned methods was presented. It has been reported that acute volume changes in ESRD patients is associated with é velocity determined by TDI, and E/é ratio is an important parameter in evaluating the left ventricular (LV) functions.49 Also, a high E/é ratio has been shown to better predict cardiovascular events compared to the other echocardiographic parameters in hemodialysis patients.50 Within this context, it has been suggested that only conventional evaluation of LV systolic and diastolic functions would not be sufficient, and they should also be further evaluated with TDI. In their TDI study with HD patients, Drighil et al. reported a significant decrease in post-HD LV é velocity, which was associated with the amount of UF. At the end of that study, the authors reported that LV and RV systolic and diastolic myocardial velocities are preload dependent.51 In another study, a direct linear correlation has been shown between E/Vp and E/é ratios and left ventricular filling pressure52. In their TDI study with 220 HD patients, Wang et al. reported that E/é ratio was increased in 62% of the cases, this increase showed substantial correlations with LV volume index, residual GFR loss, advanced age, and poor EF, and that the increase in E/é ratio during a median follow-up of 48 months was an independent predictor of cardiovascular mortality and all-cause mortality.53 Recent studies have shown that E/é ratio is associated with high levels of NT-pro BNP and troponin T, and correlated with BIS data.54,55
In the present study, we found statistically significantly higher volume load related parameters such as left atrial diameter (p=0.021), left atrial volume (p=0.034), E/é (p=0.0001), E/Vp (p=0.0001), systolic blood pressure (p=0.008), mean arterial pressure (p=0.026) and pulse pressure (p=0.011) in the group with high ePCWP value in the pre-dialysis period. In addition, we found as statistically significant correlation between ePCWP and volume load related parameters such as systolic blood pressure (r=0.420, p=0.006), mean arterial pressure (r=0.364, p=0.019), pulse pressure (r=0.430, p=0.005), NT-ProBNP (r=0.472, p=0.002), left atrial diameter (r=0.421, p=0.006), E/é ratio (r=0.952, p=0.0001) and E/é ratio (r=0.358, p=0.022). It was found that, similar to pre-dialysis period, the correlation between ePCWP and systolic blood pressure (r=0.313, p=0.046), pulse pressure (r=0.319, p=0.042), pulse (r=−0.340, p=0.030), NT-ProBNP (r=0.365, p=0.019), left ventricular end-systolic diameter (r=0.317, p=0.043), left atrial diameter (r=0.46521, p=0.002), left atrial volume (r=0.385, p=0.013), left atrial volume index (r=0.329, r=0.036) E/é ratio (r=0.960, p=0.0001) and E/Vp ratio (r=0.478, p=0.002) parameters continued also in the post-dialysis period. Even in the post-dialysis period pulse was significantly lower in the group with high ePCWP. This was evaluated as a reflection of improved myocardial stress depending on the decrease in volume load. From this aspect, ePCWP can be used as a novel method in determination of dry weight.
In the light of our results, it can be predicted that TDI method could provide a significant contribution in prediction of dry weight by giving information about ventricular filling pressures, and its ability to estimate PCWP, which is the gold standard of volume load.
LimitationsThe major limitations of this study is being a single-centre study with a relatively small number of patients. Nevertheless, these efforts and results are statistically significant.
ConclusionPrediction and maintenance of dry weight are important in hemodialysis patients because of its short term effects on morbidity and mortality. From this aspect, the combined use of inferior vena cava diameter, BIS, blood volume monitoring, and methods such as ePCWP which is estimated by PUS or TDI together with physical examination findings would be appropriate for a prediction of more correct dry weight. On the other hand, further large clinical studies are needed to determine the effectiveness and benefits of TDI method and whether it is superior over the other methods.
Conflicts of interestThe authors declare no conflicts of interest.
Funding institutions had no role in the design of the study and collection, analysis, and interpretation of data and in writing the manuscript.


