


This study aims to identify risk factors for thrombosis in arteriovenous grafts and construct a predictive model to assess thrombosis risk in patients undergoing maintenance hemodialysis (MHD).
MethodsA total of 160 MHD patients with arteriovenous graft were included and divided into a thrombosis group (n=39) and a control group (n=121). Univariate and multivariate logistic regression analyses were performed to identify independent risk factors. A nomogram prediction model was developed using R software, and its predictive performance was evaluated through calibration curves and C-index validation.
ResultsMultivariate analysis identified diabetes, hypotension during dialysis, arteriovenous graft stenosis, compression hemostasis>30min, and calcium-phosphorus product>55mg2/dL2 as independent risk factors for arteriovenous graft thrombosis. The nomogram model demonstrated good predictive accuracy, with an initial C-index of 0.753 and a validated C-index of 0.735.
ConclusionThe established nomogram effectively predicts arteriovenous graft thrombosis risk, aiding early identification and targeted intervention for high-risk patients.
Este estudio tiene como objetivo identificar los factores de riesgo de trombosis en injertos arteriovenosos y construir un modelo predictivo para evaluar el riesgo de trombosis en pacientes en hemodiálisis de mantenimiento (MHD).
MétodosSe incluyeron un total de 450 pacientes con MHD y AVG, divididos en grupo trombótico (n = 79) y grupo control (n = 371). Se realizó un análisis de regresión logística univariable y multivariable para determinar los factores de riesgo independientes. Se desarrolló un modelo de predicción utilizando un nomograma con el software R y se evaluó su rendimiento predictivo a través de la curva de calibración y la validación del índice C.
ResultadosEl análisis multivariable determinó que la diabetes, la hipotensión durante la diálisis, la estenosis de AVG, la hemostasia por compresión durante más de 30 minutos y el producto de calcio y fósforo > 55 mg2/dL2 fueron factores de riesgo independientes para la trombosis de AVG. El modelo de nomograma mostró una buena precisión de predicción, con un índice C inicial de 0.753 y un índice C verificado de 0.735.
ConclusiónEl nomograma establecido puede predecir eficazmente el riesgo de trombosis de AVG y ayudar a la identificación temprana y la intervención específica en pacientes de alto riesgo.
End-stage renal disease (ESRD) and renal failure are among the leading causes of disability and death worldwide and have gradually become a major public health problem worldwide.1,2 The primary treatment for end-stage renal disease is hemodialysis.3 Establishing and maintaining a functioning, stable, and open vascular pathway is critical in the treatment process.4 For patients whose vascular condition is good, autologous arteriovenous fistula is currently recognized as the best hemodialysis access in the world.5,6 However, for patients with poor vascular conditions of their own, such as superficially thin or deeply located veins, impaired maturation after arteriovenous fistula establishment, insufficient puncturable sites after prolonged use, and complications that cannot be repaired, the option of arteriovenous graft may be considered. The technique has gradually been widely used in China, but with the accumulation of cases, it has also been observed that complications may occur after arteriovenous graft and the long-term patency rate is much lower than that of arteriovenous fistula, of which thrombosis is the most common cause of endovascular fistula function abnormality.7 The incidence of thrombosis in arteriovenous graft has been reported in the literature to be 9–19.8%, and thrombolytic intervention is 16 times more common than in arteriovenous fistula.7 arteriovenous graft thrombosis shortens the life of the fistula, increases physical and psychological suffering, and has a dramatic impact on dialysis outcomes and quality of life for patients.8,9 Therefore, it is important to identify patients at high risk of arteriovenous graft thrombosis as early as possible and to help patients with endovascular fistula thrombosis to undergo individualized intervention at an early stage. At present, the assessment of arteriovenous graft thrombosis risk is limited to the analysis and screening of some specific risk factors. There is still no individualized risk prediction model for predicting the probability of arteriovenous graft thrombosis that can be used as a reference by clinical staff. Therefore, the present study was designed to construct a line graph model for predicting the risk of arteriovenous graft thrombosis, to screen out high-risk groups, and provide guidance for the early prevention of arteriovenous graft thrombosis.
Materials and methodsPatients160 patients with arteriovenous graft who were dialyzed in our hospital between 01/2018 and 06/2024 were selected for the study. The relevant data of patients were collected retrospectively Inclusion Criteria: (1) Patients aged ≥18 years; (2) Patients on maintenance hemodialysis treatment for more than 3 months; (3) Patients who can undergo long-term outpatient dialysis; (4) Those who did not receive renal transplantation or peritoneal dialysis treatment for the first time of fistulas; Exclusion Criteria: (1) Patients with long-term application of anticoagulant drugs; (2) Patients who have been treated with recent major surgical operations; (3) Patients suffering from psychiatric or psychological illnesses; and (4) People with cognitive dysfunctions. The inclusion of patients and the methodology of the study were approved by the Ethics Committee of our hospital.
Collection of dataPatients with long-term outpatient MHD were categorized into a thrombosis group (n=39) and a control group (n=121) based on whether or not they developed an arteriovenous graft thrombus during follow-up. Information on patient characteristics was collected separately, including (1) general characteristics: age, sex, smoking history, comorbid diabetes mellitus, comorbid cardiovascular disease, arrhythmia; (2) Whether the arteriovenous graft is stenotic, Preoperative imaging examination confirmed the occlusion of arteriovenous graft or the degree of stenosis>70%; (3) Hypotensive reactions during dialysis: During dialysis, systolic blood pressure decreased by more than 20mmhg, or mean arterial pressure decreased by more than 10mmhg, accompanied by symptoms of hypotension, such as blurred vision, dizziness, yawns, fatigue, muscle cramps, nausea and vomiting; (4) Laboratory parameters: By accessing the electronic medical record system to obtain the patient's hematological indicators, Including hemoglobin, platelets, serum proteins, total cholesterol, triglycerides, parathyroid hormone, calcium-phosphorus product, uric acid, CRP; (5) Post-dialysis compression hemostasis time.
Definitions and diagnostic criteriaArteriovenous graft is aimed at the arteriovenous fistula that cannot be established in the patient's own blood vessels. The corresponding arteries and veins are anastomosed through the artificial blood vessels to form a hemodialysis access that can be repeatedly punctured. The diagnostic criteria for arteriovenous graft thrombosis were: The thrombosis of arteriovenous fistula was confirmed by color Doppler ultrasound.
Statistical analysisR software was used for statistical analysis. Continuous variables conforming to normal distribution were expressed as (x±s); continuous variables not conforming to normal distribution were expressed as Median (Q1–Q3); count data were expressed as n (%), and t-test, Wilcoxon rank-sum test, or Chi-square test was used to compare the clinical characteristics between groups according to the characteristics of the variables. Variables that were eventually introduced into the columnar graphical model were screened based on univariate and multivariate logistic regression analyses. Model discrimination was examined using the subject work characteristics (ROC) curve, i.e., the consistency index C-index. In addition, a calibration curve comparing the predicted incidence of arteriovenous graft thrombosis in MHD patients with the actual incidence of arteriovenous graft thrombosis in maintenance hemodialysis patients was plotted to evaluate the consistency of the model, and the closer the curve was to the reference line, the higher the consistency was. p<0.05 was taken as the statistically significant difference.
ResultsPatient's general conditionOf the 160 MHD patients, 51 were male and 109 were female, aged 46–91 yrs. Thrombosis of the arteriovenous graft occurred in 39 cases.
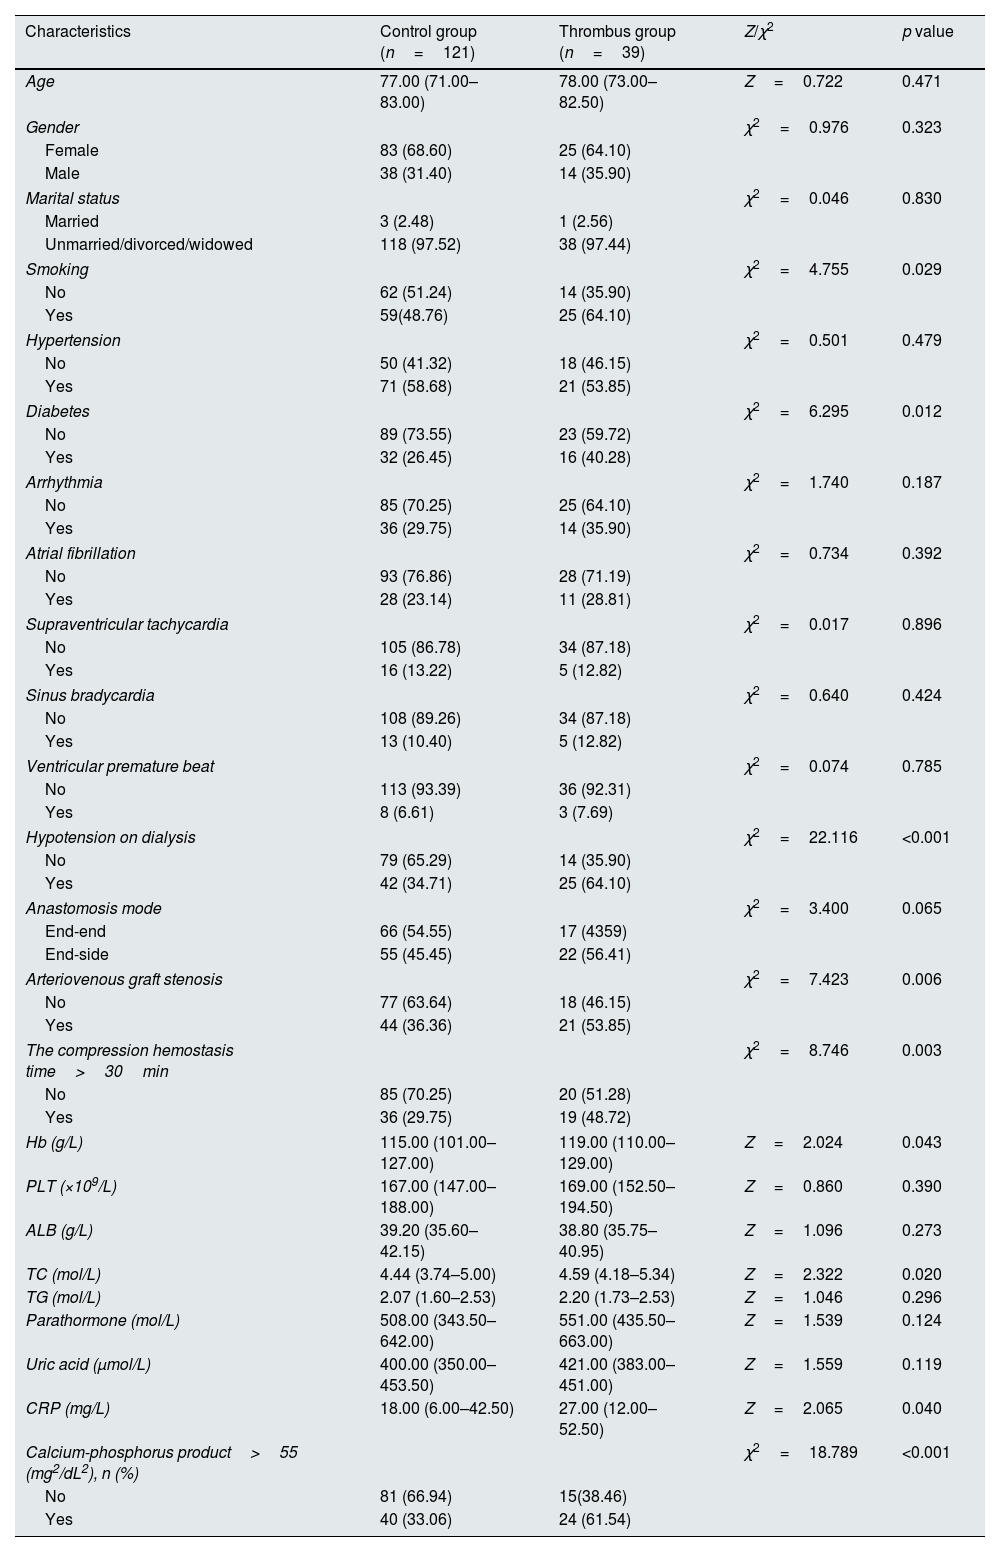
Univariate analyses of factors related to thrombosis in arteriovenous graftUsing the occurrence of thrombosis in arteriovenous graft in patients with MHD as the dependent variable, univariate analysis showed statistically significant differences in smoking history, comorbid diabetes mellitus, hypotension on dialysis, arteriovenous graft stenosis, hemoglobin, and calcium-phosphorus product>55 (mg2/dL2), as shown in Table 1.
Univariate analyses of factors related to thrombosis in arteriovenous graft between the control group and the Thrombus group.
| Characteristics | Control group (n=121) | Thrombus group (n=39) | Z/χ2 | p value |
|---|---|---|---|---|
| Age | 77.00 (71.00–83.00) | 78.00 (73.00–82.50) | Z=0.722 | 0.471 |
| Gender | χ2=0.976 | 0.323 | ||
| Female | 83 (68.60) | 25 (64.10) | ||
| Male | 38 (31.40) | 14 (35.90) | ||
| Marital status | χ2=0.046 | 0.830 | ||
| Married | 3 (2.48) | 1 (2.56) | ||
| Unmarried/divorced/widowed | 118 (97.52) | 38 (97.44) | ||
| Smoking | χ2=4.755 | 0.029 | ||
| No | 62 (51.24) | 14 (35.90) | ||
| Yes | 59(48.76) | 25 (64.10) | ||
| Hypertension | χ2=0.501 | 0.479 | ||
| No | 50 (41.32) | 18 (46.15) | ||
| Yes | 71 (58.68) | 21 (53.85) | ||
| Diabetes | χ2=6.295 | 0.012 | ||
| No | 89 (73.55) | 23 (59.72) | ||
| Yes | 32 (26.45) | 16 (40.28) | ||
| Arrhythmia | χ2=1.740 | 0.187 | ||
| No | 85 (70.25) | 25 (64.10) | ||
| Yes | 36 (29.75) | 14 (35.90) | ||
| Atrial fibrillation | χ2=0.734 | 0.392 | ||
| No | 93 (76.86) | 28 (71.19) | ||
| Yes | 28 (23.14) | 11 (28.81) | ||
| Supraventricular tachycardia | χ2=0.017 | 0.896 | ||
| No | 105 (86.78) | 34 (87.18) | ||
| Yes | 16 (13.22) | 5 (12.82) | ||
| Sinus bradycardia | χ2=0.640 | 0.424 | ||
| No | 108 (89.26) | 34 (87.18) | ||
| Yes | 13 (10.40) | 5 (12.82) | ||
| Ventricular premature beat | χ2=0.074 | 0.785 | ||
| No | 113 (93.39) | 36 (92.31) | ||
| Yes | 8 (6.61) | 3 (7.69) | ||
| Hypotension on dialysis | χ2=22.116 | <0.001 | ||
| No | 79 (65.29) | 14 (35.90) | ||
| Yes | 42 (34.71) | 25 (64.10) | ||
| Anastomosis mode | χ2=3.400 | 0.065 | ||
| End-end | 66 (54.55) | 17 (4359) | ||
| End-side | 55 (45.45) | 22 (56.41) | ||
| Arteriovenous graft stenosis | χ2=7.423 | 0.006 | ||
| No | 77 (63.64) | 18 (46.15) | ||
| Yes | 44 (36.36) | 21 (53.85) | ||
| The compression hemostasis time>30min | χ2=8.746 | 0.003 | ||
| No | 85 (70.25) | 20 (51.28) | ||
| Yes | 36 (29.75) | 19 (48.72) | ||
| Hb (g/L) | 115.00 (101.00–127.00) | 119.00 (110.00–129.00) | Z=2.024 | 0.043 |
| PLT (×109/L) | 167.00 (147.00–188.00) | 169.00 (152.50–194.50) | Z=0.860 | 0.390 |
| ALB (g/L) | 39.20 (35.60–42.15) | 38.80 (35.75–40.95) | Z=1.096 | 0.273 |
| TC (mol/L) | 4.44 (3.74–5.00) | 4.59 (4.18–5.34) | Z=2.322 | 0.020 |
| TG (mol/L) | 2.07 (1.60–2.53) | 2.20 (1.73–2.53) | Z=1.046 | 0.296 |
| Parathormone (mol/L) | 508.00 (343.50–642.00) | 551.00 (435.50–663.00) | Z=1.539 | 0.124 |
| Uric acid (μmol/L) | 400.00 (350.00–453.50) | 421.00 (383.00–451.00) | Z=1.559 | 0.119 |
| CRP (mg/L) | 18.00 (6.00–42.50) | 27.00 (12.00–52.50) | Z=2.065 | 0.040 |
| Calcium-phosphorus product>55 (mg2/dL2), n (%) | χ2=18.789 | <0.001 | ||
| No | 81 (66.94) | 15(38.46) | ||
| Yes | 40 (33.06) | 24 (61.54) | ||
Abbreviations: arteriovenous graft, arteriovenous graft; Hb, hemoglobin; PLT, platelet; ALB, albumin; TC, total cholesterol; TG, triglyceride; CRP, C-reactive protein.
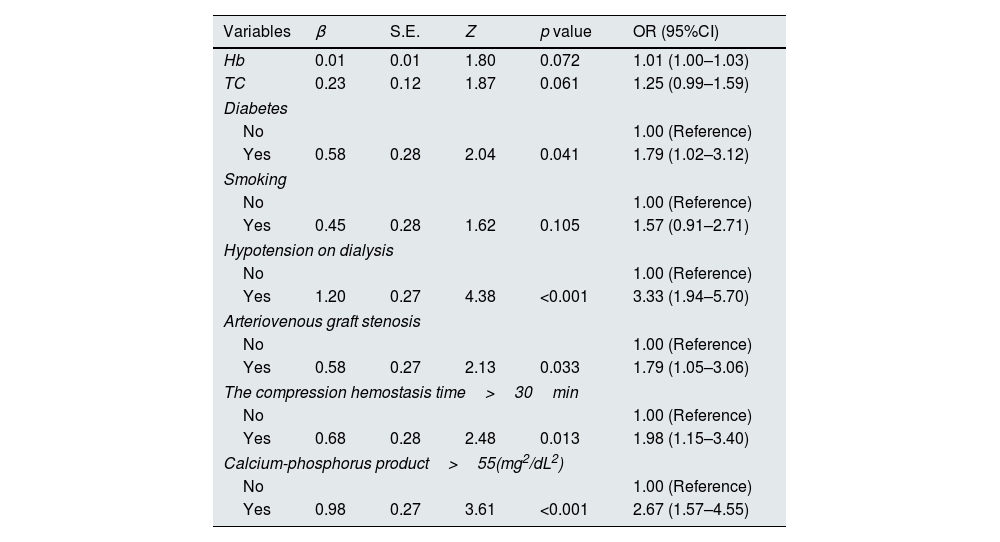
The statistically significant variables in the univariate analysis were used as independent variables for logistic regression analysis. The results showed that diabetes, Hypotension on dialysis, arteriovenous graft stenosis, compression hemostasis time>30min, and calcium-phosphorus product>55 (mg2/dL2) were independent risk factors for thrombosis in arteriovenous graft, as shown in Table 2.
Multivariate logistic regression analysis of factors related to thrombosis in arteriovenous graft between the control group and the thrombus group.
| Variables | β | S.E. | Z | p value | OR (95%CI) |
|---|---|---|---|---|---|
| Hb | 0.01 | 0.01 | 1.80 | 0.072 | 1.01 (1.00–1.03) |
| TC | 0.23 | 0.12 | 1.87 | 0.061 | 1.25 (0.99–1.59) |
| Diabetes | |||||
| No | 1.00 (Reference) | ||||
| Yes | 0.58 | 0.28 | 2.04 | 0.041 | 1.79 (1.02–3.12) |
| Smoking | |||||
| No | 1.00 (Reference) | ||||
| Yes | 0.45 | 0.28 | 1.62 | 0.105 | 1.57 (0.91–2.71) |
| Hypotension on dialysis | |||||
| No | 1.00 (Reference) | ||||
| Yes | 1.20 | 0.27 | 4.38 | <0.001 | 3.33 (1.94–5.70) |
| Arteriovenous graft stenosis | |||||
| No | 1.00 (Reference) | ||||
| Yes | 0.58 | 0.27 | 2.13 | 0.033 | 1.79 (1.05–3.06) |
| The compression hemostasis time>30min | |||||
| No | 1.00 (Reference) | ||||
| Yes | 0.68 | 0.28 | 2.48 | 0.013 | 1.98 (1.15–3.40) |
| Calcium-phosphorus product>55(mg2/dL2) | |||||
| No | 1.00 (Reference) | ||||
| Yes | 0.98 | 0.27 | 3.61 | <0.001 | 2.67 (1.57–4.55) |
According to the results of multivariate Logistic regression analysis, a nomogram clinical prediction model for thrombosis in arteriovenous graft was constructed, as shown in Fig. 1. Diabetes (46 points), hypotension on dialysis (100 points), arteriovenous fistula stenosis (47 points), compression hemostasis time (60 points), calcium-phosphorus product (84 points), each risk factor score was added to obtain the total score, and the corresponding probability of the total score was the incidence of arteriovenous graft predicted by the model.
Evaluation of a nomogram model for thrombosis risk of arteriovenous graft in MHD patients
The predictive ability of the nomogram model was evaluated by drawing the ROC curve. The results showed that the AUC value of the nomogram prediction model was 0.753 (95%CI: 0.695–0.810), as shown in Fig. 2. Bootstrap self-sampling internal verification was performed on the nomogram prediction model, and the corrected C-index was 0.735 after repeated sampling internal verification. The calibration curve showed that the predicted results of the nomogram model had a good consistency with the actual results, as shown in Fig. 3.


Internal validation of bootstrap self sampling using Nomogram prediction model. The 45° dotted line indicates perfect prediction by an ideal model. The Apparent line is the performance of model training, and the Bias-corrected line indicates the performance of the model trained after repeated self-sampling, which corrects the overfitting.
In recent years, with the extension of dialysis age, the number of elderly patients and the incidence of diabetes, hypertension, obesity, and other diseases are increasing, and the self-vascular conditions limit the establishment of arteriovenous fistula. arteriovenous graft, as the preferred alternative form of arteriovenous fistula, plays an increasingly important role in clinical practice. However, arteriovenous graft has a short life expectancy and many complications, which not only increase medical costs but also affect the quality of life of patients. Thrombosis is the most common cause of arteriovenous graft dysfunction. Therefore, it is particularly important to identify the risk factors of arteriovenous graft thrombosis and to intervene in the risk factors. The thrombosis risk nomogram of arteriovenous graft established in maintenance hemodialysis patients can screen the high-risk population of vivid venous arteriovenous graft thrombosis, and guide the early prevention of acute thrombosis of arteriovenous fistula.
Literature reports that the incidence of thrombosis of arteriovenous graft is 9–19.8%, and thrombolytic intervention is 16 times that of arteriovenous fistula.7 However, this study showed that the incidence of thrombosis in arteriovenous fistula in arteriovenous graft patients was 14.2%. The results indicate that the incidence of thrombosis in arteriovenous graft is high in China. Multivariate logistic regression analysis showed that the predictive factors of arteriovenous graft thrombosis included diabetes, hypotension on dialysis, arteriovenous graft stenosis, compression hemostasis time>30min, and calcium-phosphorus product>55 (mg2/dL2).
Our findings are consistent with previous studies10,11 that showed higher rates of acute thrombosis of arteriovenous graft in patients with diabetes than in MHD patients without diabetes. Mechanistic studies have shown that hyperglycemia-induced vascular intimal injury plays an important role in this process. The increase of advanced glycation end products can lead to the disorder of secretion of a series of biologically active substances in the body such as nitric oxide, interleukin-6, and C-reactive protein, and then cause intimal damage of blood vessels, the deposition of vessel wall substances to form atherosclerotic plaques, which gradually make the arterial blood vessels hardening, and eventually lead to vascular occlusion.10 However, other studies have shown that diabetes has no significant effect on the arteriovenous graft patency rate.12
The results of this study show that hemodialysis patients with hypotension are prone to thrombosis of arteriovenous graft. The reason may be that low blood pressure can lead to the reduction of blood flow in the pathway, and the blood flow in the circulation is slow, which is prone to platelet aggregation and increased blood viscosity, so it is easy to form thrombosis.
However, studies13 have shown that hemodialysis patients with higher systolic blood pressure are prone to arteriovenous fistula thrombosis. It may be because the higher systolic blood pressure is, the greater pulse pressure is, which leads to blood fluctuation or instability and causes vascular endothelial cell damage, increases inflammatory response, and then increases vascular permeability. Therefore, for hemodialysis patients with high systolic blood pressure and hypotension, medical staff need to strictly evaluate, closely monitor and record blood pressure changes before hemodialysis, and make early warnings in advance.
Internal fistula stenosis is prone to occur at the anastomotic site or the site of repeated puncture. Li et al.14 believe that stenosis of the arteriovenous fistula is an important cause of thrombosis and an independent risk factor for the failure of the arteriovenous graft. If clinically significant stenosis is confirmed, this pathology should be treated before thrombosis occurs in the arteriovenous graft. The possible reason is that arteriovenous graft, under the action of oxidative stress and mechanical damage, causes vascular endothelial damage, and then induces intimal hyperplasia, accompanied by the production of a variety of vasoactive substances and extracellular matrix, leading to anastomotic stenosis, and finally causes thrombosis.
This study found that compression hemostasis time>30min was a risk factor for thrombosis in arteriovenous graft. A prolonged hemostasis time may also indicate that the graft could have some form of dysfunction, typically stenosis. Therefore, it is recommended to assess the arteriovenous graft using imaging techniques to detect any underlying pathology.
Our study also confirmed that a calcium-phosphorus product> 55 (mg2/dL2) was closely related to the thrombosis of the arteriovenous fistula. This elevated calcium-phosphorus product may indicate the presence of pathology in the graft or that the patient is not being dialyzed adequately. It may also be related to the influence of vascular calcification on the vasomotor function of patients.15,16 Therefore, it is recommended to adjust the calcium-phosphorus product of MHD patients to the normal range as much as possible during dialysis, and to perform imaging techniques to detect any underlying pathology.
Single factors have very limited predictive value compared to constructing predictive models. Therefore, this study constructed a prediction model based on the above factors and found that The AUC of the prediction model in predicting the thrombosis risk of arteriovenous graft patients was above 0.6, and the calibration curve showed that it had good consistency, suggesting that the prediction model has high application value in the prediction of thrombosis in arteriovenous graft patients, and can be used as the preferred way to early predict the thrombosis risk of arteriovenous graft patients in clinical practice, which not only ensures the prediction accuracy but also ensures the prediction accuracy It can provide a comprehensive and reliable reference for taking targeted preventive measures.
However, this study has certain limitations, including the limited sample size included in the construction of the prediction model due to the actual clinical conditions and time, which may affect the accuracy of the prediction model to a certain extent. In addition, due to the retrospective study, some measures, such as blood flow and interdialytic venous pressure, may not be available. It is necessary to continue to collect cases for in-depth analysis and discussion in the future.
In conclusion, the nomogram constructed by the presence of diabetes mellitus, hypotension on dialysis, arteriovenous graft stenosis, compression hemostasis time>30min, and calcium-phosphorus product>55 (mg2/dL2) can accurately predict the risk of acute thrombosis in arteriovenous graft patients.
Author contributionsThe author solely conducted the study, including its design, data collection, analysis, model development, manuscript drafting, and final approval for publication.
Ethical approval and informed consentThe study was approved by the Ethics Committee of The First People's Hospital of Hangzhou Lin’an District (No. 20251).
FundingThis research was not funded by any organization or legal entity.
Conflict of interestsThe author declared no conflict of interest.
Data availabilityAll data generated or analyzed during this study are included in this published article.


