


To evaluate renal impairment in type 2 diabetic patients with normoalbuminuria or microalbuminuria by detection of serum cystatin C and serum and urinary TGF-β levels.
MethodsCross-sectional study conducted at the Department of Endocrinology in Baskent University School of Medicine. Patients with type 2 diabetes mellitus without known overt diabetic nephropathy were included in the study. Recruited patients were stratified into four groups, matched in terms of age, gender, microalbuminuria level and estimated GFR calculated with MDRD.
Results78 patients were enrolled. They were categorized into four groups depending on their urinary albumin excretion and estimated glomerular filtration rate.
Macrovascular complication was found to be higher in patients with microalbuminuria than in other patients (p<0.01), but there were no differences in terms of other diabetic complications. Serum cystatin C level was significantly higher in normoalbuminuric group one patients, while serum and urinary TGF-β1 levels were higher in microalbuminuric group two patients. The serum level of cystatin C was found to negatively correlate with eGFR in group two patients (r=−0.892, p<0.001). Finally, there was a negative correlation between eGFR and cystatin C in all the patient groups (r=−0.726, p=0.001).
ConclusionsAlthough urinary albumin excretion is recommended for the detection of type two diabetic nephropathy, there is a group of patients with decreased eGFR but without increased urinary albumin excretion, in which serum cystatin C level was indicated to be used as an early biomarker of diabetic nephropathy.
Evaluar la insuficiencia renal en pacientes con diabetes tipo 2 con normoalbuminuria o microalbuminuria mediante la detección de la concentración de cistatina C en suero y de TGF-β en suero y orina.
MétodosEstudio transversal realizado en el Departamento de Endocrinología de la Facultad de Medicina de la Universidad de Baskent. En el estudio, se incluyó a pacientes con diabetes mellitus tipo 2 sin nefropatía diabética manifiesta conocida. Los pacientes seleccionados se estratificaron en 4 grupos, agrupados en términos de edad, sexo, grado de microalbuminuria y filtración glomerular estimada (FGe) calculada mediante la fórmula MDRD.
ResultadosSe incluyó a 78 pacientes. Se clasificaron en 4 grupos dependiendo de la excreción urinaria de albúmina y de la FGe.
Se observó que la complicación macrovascular era mayor en los pacientes con microalbuminuria que en otros (p<0,01), pero no hubo diferencias con relación a otras complicaciones diabéticas. La concentración sérica de cistatina C fue significativamente mayor en los pacientes del grupo 1 con normoalbuminuria, mientras que las concentraciones de TGF-β1 en suero y orina fueron mayores en los pacientes del grupo 2 con microalbuminuria. Se observó una correlación negativa entre la concentración sérica de cistatina C y la FGe en los pacientes del grupo 2 (r=−0,892, p<0,001). Por último, se observó una correlación negativa entre la FGe y la cistatina C en todos los grupos de pacientes (r=−0,726, p=0,001).
ConclusionesAunque se recomienda la excreción urinaria de albúmina para la detección de la nefropatía diabética tipo 2, hay un grupo de pacientes con disminución de la FGe, pero sin aumento de la excreción urinaria de albúmina, en los que estaba indicado usar la concentración de cistatina C en suero como un biomarcador temprano de nefropatía diabética.
Diabetic nephropathy (DN) is the leading cause of chronic kidney disease.1,2 Albumin excretion rate (AER) and glomerular filtration rate (GFR) are used to stage DN. However, these measurements are not sufficient in early diagnosis and monitoring the progression of DN. Therefore early markers should be devised for these purposes. Although microalbuminuria is accepted as a risk factor and marker for DN and progressive renal insufficiency,3 some patients, especially type 2 diabetics, may have normoalbuminuric chronic kidney disease.4
This shows that both normoalbuminuric and albuminuric pathways are at work.5 While some patients with MA present with normal kidney structure, some other normoalbuminuric diabetics have well-determined nephropathic lesion.6,7
Cystatin C which is used for measurement of GFR, is produced in all nucleated cells and filtered freely from the glomerulus. It is reabsorbed totally and catabolised in the proximal tubules. Cystatin C is a suitable marker for GFR measurement owing to not being affected by age, weight, gender and protein intake.8–10
Transforming growth factor-beta (TGF-β1) is one of the growth factors which are implicated in DN pathogenesis. TGF-β1 causes mesangial extension by promoting renal cellular hypertrophy and by inducing the extracellular matrix expansion.11 Urinary TGF-β1 levels are increased as proportional to the severity of the nephropathy.12
We aimed to determine the value of serum Cystatin C and TGF-β1 in early detection of diabetic nephropathy in normoalbuminuric patients with type-2 diabetes mellitus.
Material and methodsPatientsThis was a cross-sectional study which was conducted at the Department of Endocrinology in Baskent University School of Medicine, Istanbul, Turkey, during 2009–2011, who agreed to participate in the study. Baskent University Ethical Committee approved the study protocol (Approval no: KA09/308). Patients with type 2 diabetes mellitus without known overt diabetic nephropathy were included in the study. Recruited patients were stratified into four groups, matched in terms of age, gender, microalbuminuria level and estimated GFR calculated with MDRD. We tried to exclude apparent causes of nondiabetic renal disease based on data obtained with urinary system ultrasonography, urine microscopy and urine culture. Patients who have history of nondiabetic renal disease, uncontrolled hypertension, liver disease, NYHA stage 3–4 heart failure, thyroid disease, malignity and steroid usage were excluded from the study. All participants were included in the study after signing informed consent forms.
Laboratory evaluationFollowing thorough medical history and detailed physical examination, blood samples were taken from all participants for measurement of fasting blood glucose, HbA1c, blood urea, creatinine and electrolytes, lipid profile, serum albumin, high sensitive C reactive protein (hsCRP). Freshly voided early morning urine samples were also collected for urinalysis. Patients also provided 24-h collected urine specimens for measurement of microalbumin.
Serum glucose, creatinine, total cholesterol, HDL and LDL cholesterol, triglyceride were studied by enzymatic colorimetric; serum albumin; bromocresol green (BCG), ure; (BUN) urease, HbA1c; immune-examination (C4000, Abbott, USA), and hsCRP was studied with immunoturbidimetric methods (C8000, Abbott, USA). Microalbumin level in 24-h urine was determined with immunoturbidimetric method (C4000 system, Abbott, USA).
Estimated GFR was calculated with 6 variable MDRD equation using age, race, gender, serum creatinine, blood urea nitrogen and albumin values.13
The serums of patients were stored in −20°C until laboratory analysis. Serum cystathionine C, serum TGF-β1 and urine TGF-β1 levels were determined with enzyme linked immunosorbent assay (ELISA) method. BioVendor (Czech Republic) ELISA kit and eBioscience (North America) ELISA were used for Cystatin C and TGF-β1 measurements, respectively.
Statistical analysisFor statistical evaluation, NCSS (Number Cruncher Statistical System) 2007 and PASS (Power Analysis and Sample Size) 2008 Statistical Software (Utah, USA) programs were used. Oneway Anova test was used in intergroup comparison of the parameters showing normal distribution and Tukey HDS test was used in the determination of the group causing the difference. Kruskal–Wallis test was used in intergroup comparison of the parameters not showing normal distribution and Mann–Whitney U test was used in the group causing the difference. In comparison of the qualitative data, Chi-square test was used. The significance was accepted as p<0.05.
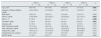
ResultsA total of 78 patients with type 2 DM were included in the study (mean age 57±8. Four groups were described; patients with GFR value <60ml/min/1.73m2 and MA <30mg/day as group 1; patients with GFR value <60ml/min/1.73m2 and MA between 30mg and 300mg/day as group 2; patients with GFR value >120ml/min/1.73m2 and MA <30mg/day as group 3, and patients with GFR value between 90 and 120ml/min/1.73m2 and MA <30mg/day as group 4. There were 10 men and 10 women in group 1 and 4 whereas 10 men and 11 women in group 2 and 15 men and 2 women in group 3. The laboratory parameters of the groups are shown in Table 1. Significant difference was present among groups with regards to mean age, fasting blood glucose, HbA1c and serum creatinine level.
Laboratory parameters of the study groups.
| Group 1 (n=20) | Group 2 (n=21) | Group 3 (n=17) | Group 4 (n=20) | p | |
|---|---|---|---|---|---|
| Age, years | 62.9 (5.8) | 59.7 (6.9) | 49.0 (8.0) | 53.7 (8.3) | 0.001 |
| Duration of Diabetes Mellitus, months | 116.4 (100.1) | 127.4 (96.7) | 96.0 (71.8) | 78.0 (45.1) | 0.243 |
| BMI, kg/m2 | 29.6 (4.2) | 32.0 (5.3) | 32.2 (6.6) | 31.6 (5.4) | 0.430 |
| Glucose, mg/dL | 118.8 (26.6) | 152.1 (62.7) | 143.9 (42.6) | 121.1 (32.7) | 0.043 |
| HbA1c, % | 6.1 (0.7) | 6.9 (1.2) | 7.3 (1.1) | 6.7 (1.3) | 0.028 |
| Creatinine, mg/dL | 1.2 (0.2) | 0.9 (0.3) | 0.6 (0.1) | 0.6 (0.1) | 0.001 |
| Albumin, g/dL | 4.2 (0.3) | 4.2 (0.2) | 4.3 (0.3) | 4.3 (0.3) | 0.559 |
| HDL-Cholesterol, mg/dL | 41.2 (10.1) | 38.4 (7.8) | 39.8 (10.9) | 40.5 (5.7) | 0.774 |
| LDL-Cholesterol, mg/dL | 102.6 (35.5) | 115.3 (34.3) | 129.6 (30.3) | 105.9 (29.6) | 0.079 |
| Triglyceride, mg/dL | 148.3 (91.1) | 174.8 (79.9) | 175.9 (50.9) | 184.6 (68.1) | 0.074 |
| Sedimentation rate, mm/hour | 22.3 (14.8) | 15.1 (10.8) | 13.4 (5.2) | 14.2 (8.0) | 0.412 |
| hsCRP, mg/dL | 5.1 (4.5) | 6.0 (7.7) | 5.5 (5.5) | 5.6 (5.2) | 0.969 |
Body mass index (BMI), hemoglobin A1c (HbA1c), high density lipoprotein (HDL), low density lipoprotein (LDL), high sensitive c reactive protein (hsCRP).
Mean (standard deviation).
No significant difference was found among groups in terms of the presence of HT which has a major role in DN pathogenesis. The evaluation of the groups in terms of micro and macrovascular complications of diabetes is depicted in Table 2. Highest rate of coronary artery disease (CAD) was seen Groups 1 and 2. No significance difference was evident among the groups regarding prevalence of retinopathy, diabetic foot and neuropathy (p>0.05).
Evaluation of micro and macro vascular complications according to groups.
| Group 1 (n=20) | Group 2 (n=21) | Group 3 (n=17) | Group 4 (n=20) | p | |
|---|---|---|---|---|---|
| Coronary Artery Disease | 9 (45%) | 10 (47.6%) | 1 (5.9%) | 2(10%) | 0.003 |
| Retinopathy | 5 (25%) | 7 (33.3%) | 2 (11.8%) | 4 (20%) | 0.454 |
| Diabetic Foot | 0 (%0) | 1 (4.8%) | 0 (%0) | 0 (%0) | 0.432 |
| Neuropathy | 9 (45%) | 9 (42.9%) | 2 (11.8%) | 5 (25%) | 0.096 |
Results of GFR, cystatin C, serum and urine TGF-β1, MA measurements are shown in Table 3. Significant difference was present among the groups in terms of cystatin C, serum and urine TGF-β1 (p<0.05). Post Hoc Tukey HSD test which was performed to determine the intragroup significance, showed that cystatin C level of groups 1 and 2 was significantly higher compared with those of groups 3 and 4 (for Group 1; p=0.001, p=0.001; for Group 2; p=0.002, p=0.01). For the serum and urine TGF-β1, we found that the levels in group 2 were significantly higher than group 4 (p=0.012; p=0.012). No significant association was determined between TGF-β1 and any of the studied variables.
Estimated GFR, cystatin C, serum and urine TGF-β1, and MA levels in study groups.
| Group 1 (n=20) | Group 2 (n=21) | Group 3 (n=17) | Group 4 (n=20) | p | |
|---|---|---|---|---|---|
| eGFR, mL/m/1.73m2 | 54.7 (7.6) | 78.2 (23.5) | 125.7 (6.9) | 106.1 (29.8) | 0.001 |
| Cystatin C, mg/L | 1.4 (0.6) | 1.1 (0.4) | 0.6 (0.1) | 0.7 (0.1) | 0.001 |
| sTGF-β1, ng/mL | 16.7 (6.9) | 18.9 (3.0) | 16.1 (6.1) | 13.2 (6.4) | 0.022 |
| uTGF-β1, pg/mgcre | 558.6 (23.0) | 633.2 (100.6) | 539.3 (204.3) | 442.2 (214.3) | 0.022 |
| MA, mg/24h | 18.0 (5.9) | 89.8 (37.7) | 22.2 (8.9) | 16.3 (5.1) | 0.001 |
Estimated glomerular filtration rate (eGFR), serum transforming growth factor-beta 1 (sTGF-β1), urine transforming growth factor-beta 1 (uTGF-β1), microalbuminuria (MA).
Mean (standard deviation).
Cystatin C showed a significant and positive correlation with age, duration of diabetes, and serum uric acid in group 2 (for age: r=0.477, p=0.029; for duration of diabetes: r=0.437, p=0.048; for serum uric acid: r=0.465, p=0.039). As expected, serum cystatin C level was negatively associated with estimated GFR level (r=−0.892, p=0.001) only in group 2 (Fig. 1). In group 3, only a negative significant correlation was present between LDL and cystatin C (r=−0.72, p=0.002). In group 4, cystatin C had a positive correlation with duration of diabetes (r=0.453, p=0.045) and a negative correlation with MA (r=−0.520, p=0.019) (Fig. 2).


When all the patients which are taken to the study are evaluated, statistically significant relation in negative direction and in % 72.6 level is detected (r=−0.726, p=0.001). Significant negative correlation is detected between GFR and creatinine (r=−0.806, p=0.001). Positive significant correlation is detected between age, hypertension and CAD and cystatin C levels (for age r=0.534, p=0.001; for hypertension r=0.347, p=0.002; for CAD r=0.382, p=0.001, respectively).
When 60ml/min/1.73m2 is selected for GFR as the cut-off value, it is observed that the cystatin C levels are significantly different between the patients who have eGFR values over and below this cut-off point (GFR<60ml/min: 1548.6±613.8; GFR≥60ml/min mean: 816.8±310.8; p=0.001). ROC analysis for cystatin C, in the cases where cystatin C is C≥1064mg/L, catch-up sensitivity of GFR in <60ml/m was calculated as 80%, specificity as 86.21%; positive conjecture value as 66.67% and negative conjecture value is calculated as 92.59% (Fig. 3). The area under the curve in ROC analysis was found as 85.4% and standard error was calculated as 6%.
Discussion
The albumin excretion rate (AER) which is used in staging of DN and GFR, is not sufficient for explaining the disease progress. While albumin excretion through urine is normal, GFR can decrease without any increase in AER. By considering that DN may have normoalbuminuric stage,11 this situation is reported in type 1 diabetic patients who show typical specifications in favor of DN in renal biopsy.11 In our study, when detecting the early stage diabetic nephropathy, cystatin C levels are detected as higher in the groups which have normoalbuminuric eGFR <60ml/m/1.73m2 and as independent from eGFR serum and urine TGF-β1 level is detected as higher in microalbuminuria group.
In AER and GFR relation age is an important factor. GFR is type 2 diabetics over 70 years old, is approximately 60ml/m/1.73m2. In our study, eGFR was the lowest and the age was the oldest in normoalbuminuric group (average 62±5 years).
Today, GFR is accepted as the best index reflecting kidney function.13 GFR can be directly measured with the infusion of the exogenous markers such as inulin or 51Cr-EDTA. However these methods are not practical and not used in daily practice. Therefore, for the sake of practicality, American Diabetes Association (ADA) and National Kidney Foundation suggest the formula of Cockcroft-Gault (CG) and Modification of Diet in Renal Disease four-variable (MDRD) equations to estimate GFR.14,15 Particularly MDRD equation is accepted as superior than CG owing to not depend on body weight measurement.13
Serum creatinine concentration is an imperfect measure of GFR. In our study, the creatinine level in the patient groups whose GFR was <60ml/m/1.73m2, has not increased yet and the patients were normoalbuminuric. Since serum creatinine level is affected by muscle mass and diet, it is not an ideal marker for GFR calculation. Novel methods are needed for early and accurate detection of DN.
Cystatin C is an endogenic marker used for GFR determination because its serum level is dependent to almost whole of eGFR particularly it is seen more valuable in normal and mild decreased eGFR.8
Laterza et al.5 have attributed cystatin C to be an important reagent in early stage kidney damage to its stabile production, muscle mass, not being dependent to age and gender or not showing reverse tendency to kidney secretion or blood circulation.
In our study, the difference in cystatin C levels showed that even in normoalbuminuria stage, the diabetic renal disease can be identified.
In early diabetic kidney disease, there are contradictory results related to the role of cystatin C. As pursuant to our study, two studies show that cystatin C is not more sensitive than creatinine.16,17 Contrary to our results, in the study where cystatin C based equations and creatinine based equations like Schwartz, MDRD and CG formulas are compared and in a meta-analysis where 46 studies included, cystatin C is considered superior than creatinine in determination of decreased GFR.18,19 Although a negative weak relation is detected in cystatin C and eGFR in our study, it was not statistically significant. We think that this situation might be due to the limited number of cases in the patient group. In the study where Mussap and colleagues have examined 52 type 2 diabetic patients,20 eGFR has decreased from 120ml/m/1.73m2 to 20ml/m/1.73m2 and cystatin C has increased more than the serum creatinine has. The association between Cystatin C and eGFR was detected stronger than the serum creatinine.
In the study of Surendar et al. in Indians who have glucose intolerance, it was determined that cystatin C levels have increased as comparative with glucose intolerance and the highest cystatin C levels were found in the group which had microalbuminuria and retinopathy.21 In our study, no difference was detected in terms of retinopathy among the groups and cystatin C levels were found highest in the normoalbuminuric group.
In the previous study, ROC analysis made for identifying the diagnostic profile of serum cystatin C in predicting eGFR <60ml/dk/1.73m2 in the type 2 diabetic patients and as similar to our study, cut-off value is detected as 1.06mg/dl, the sensitivity of serum cystatin C level is 81% and the specificity is detected as.22 As pursuant to our study, serum cystatin C level of the normoalbuminuric is detected as significantly higher than the patients with GFR of ≤60ml/dk/1.73m2. This makes us think that cystatin C levels of serum and urine are related with the subclinical failure and may be the kidney uptake reagents which are measurable in the period earlier than the onset of albuminuria. In the study of Yang and friends, serum cystatin C level showed correlation with MA level.23
When we consider the relation between serum cystatin C and serum creatinine levels and MDRD in whole study population we determined that the predictive ability of serum creatinine for GFR was higher. This result, which is discordant with the majority of the literature, can be connected to the insufficiency of the cases in patient groups, selecting the case from the patients who have early period DN and formation of 25% of the total patient population by microalbuminuric patient group.
In the microalbuminuric patient group and in the patient group with GFR <60ml/m/1.73m2 or >60ml/m/1.73m2, negative and significant association was found. This patient group was the sole patient group with MA. This group was made up from older patients than normoalbuminuric and two other patient groups with GFR >90ml/m/1.73m2. It is known that the serum cystatin C level increases with advancing age. The presence of significant difference among the patient groups in terms of age, can be seen as another factor which limits our study.
In both studies, high serum cystatin C level is associated with the previous coronary heart disease.24,25 As similar to these studies, we have found positive significant correlation between CAD and serum cystatin C in the whole patient cohort.
One of the cytokines which is responsible for DN initiation and progression is TGF-β. It is proven that TGF-β intervenes to all pathological changes which depend on the diabetic kidney disease.26 TGF-β causes kidney cell hypertrophy and excessive extracellular matrix production in interstitial fibroblasts, glomerular and tubular cells.
In experimental DM, glomerular and tubule-interstitial compartments, expresses TGF-β or TGF-β type II receptor. Although the kidney of the non-diabetic subject removes TGF-β1 from the blood, kidney of a diabetic patient releases TGF-β1 protein into the circulation. TGF-β1 level which has increased in urine is associated with adverse clinical outcomes.27 In 3 patient groups which do not have MA in our study, we have found the serum and urine TGF-β1 levels were significantly higher in the groups with MA.
Increased kidney TGF-β1 production in the diabetic patients was examined and renal vein TGF-β1 concentration was found positive in diabetic patients and negative in non-diabetic patients.27 Urine TGF-β1 level in the diabetic patients increased fourfold than the non-diabetic patients and as contrary to our study, increased urine TGF-β1 excretion was present in all diabetic patients irrespective of MA status.
There are some limitations of our study that need to be mentioned. The most important limitation of our study is the estimation of GFR measurements. All estimates of GFR based on serum creatinine will be affected from physiologic and/or pathologic limitations28 and be far from ideal GFR. On the other hand, recent studies showed the CKD-EPI creatinine equation has similar GFR prediction in different patient population compared with the MDRD Study equation, even in the earlier CKD stages.29,30 In addition, the CKD-EPI creatinine-cystatin C equation is more suitable compared with standard reference for cystatin C and creatinine based equations.31 However, the cost effectiveness of the CKD-EPI creatinine-cystatin C equation for clinical use should be considered. The second important limitation is the sample size of the study groups. But we wanted to be sure about patients with type 2 diabetes mellitus without known overt diabetic nephropathy. Larger new clinical trials are recommended to determine the role of serum cystatin C, serum and urine TGF-β1 level as an early biomarker of diabetic nephropathy. The third, diabetic foot ulcer with or without concomitant peripheral arterial disease is considered as two separate disease.32 In our study, we did not exam the patients whether they have peripheral vascular disease.
ConclusionAlthough urinary albumin excretion is suggested for detection of type 2 diabetic nephropathy, there is group of patients with decreased eGFR but without increased urinary albumin excretion, in which serum cystatin C level was indicated to be used as an early biomarker of diabetic nephropathy. In addition, despite that serum and urine TGF-β1 levels were also significantly higher in patients with MA, only increased urine TGF-β1 excretion was present in all diabetic patients irrespective of MA status.
Conflict of interestThe authors declare no conflict of interest.


