


Prognostic assessment after starting hemodialysis is challenging, with mortality in the first year estimated to be 15%. Clark et al. developed the Recovery and Death Outcome risk score, which accurately predicted the likelihood of renal recovery to dialysis independence and of death within 1 year after in-hospital dialysis initiation, respectively. We aimed to validate the Death Outcome risk score to predict one-year mortality after dialysis start in our population.
MethodsRetrospective analysis of hospitalized patients starting hemodialysis in a tertiary-care hospital from January 1st, 2016, to December 31st, 2019. All-cause mortality risk one year after discharge was calculated according to the ReDO Death score. Patients were classified into death outcome risk groups and Cox regression was used to determine if the risk score was predictive of one-year mortality. The discriminatory ability for the ReDO Death score to predict mortality was determined using the receiver operating characteristic (ROC) curve.
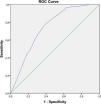
ResultsThree hundred sixty-nine patients were included, mostly male (59.9%), with mean age 71.1±14.3 years and median Charlson score 7±3. The one-year mortality rate was 22.2%. The ReDO Death score accurately predicted the one-year risk of mortality, with an area under the ROC of 0.741 [95% CI (0.687–0.794), p<0.001]. The optimal REDO Death risk cut-off was >30%, with a hazard ratio of 6.57 [95% CI (3.48–12.2), p<0.001] for one-year mortality risk (sensitivity 78.0% and specificity 60.6%).
ConclusionWe validated the ReDO Death score for 1-year mortality prediction after starting hemodialysis during hospitalization in a Portuguese population. This score can be used as a tool to inform goals-of-care discussion at the time of transition to out-of-hospital care.
La evaluación del pronóstico después de iniciar la hemodiálisis es un desafío, y se estima que la mortalidad en el primer año es del 15%. Clark et al. desarrollaron la puntuación de riesgo de resultado de recuperación y muerte, que predijo con precision la probabilidad de recuperación renal hasta la independencia de la diálisis y de Muerte dentro de 1 año después del inicio de la diálisis en el hospital, respectivamente. Nuestro objetivo fue validar la puntuación de riesgo de resultado de muerte para predecir la mortalidad al año después del inicio de la diálisis en nuestra población.
MétodosAnálisis retrospectivo de pacientes hospitalizados que iniciaron hemodiálisis en un hospital de tercer nivel desde el 1 de enero de 2016 hasta el 31 de diciembre de 2019. El riesgo de mortalidad por todas las causas al año del alta se calculó según el score ReDO Death. Los pacientes se clasificaron en grupos de riesgo de muerte y se utilizó la regresión de Cox para determinar si la puntuación de riesgo predecía la mortalidad a un año. La capacidad discriminatoria de la puntuación ReDO Death para predecir la mortalidad se determinó mediante la curva de características operativas del receptor (ROC).
ResultadosSe incluyeron 369 pacientes, en su mayoría varones (59,9%), con edad media de 71,1±14,3 años y mediana del puntaje de Charlson de 7±3. La tasa de mortalidad a un año fue del 22,2%. La puntuación ReDO Death predijo con precisión el riesgo de mortalidad a un año, con un área bajo la curva de 0,741 [IC del 95% (0,687-0,794), p<0,001]. El límite óptimo de riesgo de muerte REDO fue >30%, con un índice de riesgo de 6,57 [IC 95% (3,48-12,2), p<0,001] para el riesgo de mortalidad a un año (sensibilidad 78,0% y especificidad 60,6%).
ConclusiónValidamos el score ReDO Death para la predicción de mortalidad a 1 año después de iniciar hemodiálisis durante la hospitalización en una población portuguesa. Este score se puede utilizar como herramienta para informar la discusión sobre los objetivos en el momento de la transición extrahospitalar.
The prevalence of kidney disease has reached alarming levels globally, with 850 million people affected, as highlighted by statements from the American Society of Nephrology, European Renal Association, and International Society of Nephrology.1 Chronic kidney disease (CKD) has a global prevalence of around 9.1–13%, underscoring the urgent need for effective management strategies.1–3 In Portugal, CKD prevalence is notably high at 20.9%, double the global average.4
Nearly four million individuals worldwide are undergoing kidney replacement therapy (KRT), with hemodialysis (HD) standing out as the leading modality.5 In Portugal, of the 2705 patients starting KRT in 2022, 82.7% opted for HD.6 Incident hemodialysis patients face a limitation of life expectancy of 5–10 years, with major causes of mortality including infection and cardiovascular disease.7 Furthermore, the mortality rate within the first year of starting HD is around 15.2%.8 To accurately interpret this, consideration must be given to the baseline characteristics of patients at HD start, as these significantly impact treatment outcomes and mortality rates. Prognosis assessment after starting HD is challenging and risk prediction scores can be useful in planning treatment.
In 2023, Clark et al. developed a risk prediction model to effectively assess the one-year likelihood of kidney recovery and mortality in patients starting HD.9 This was a population-based registry study with a derivation and an external validation cohort of patients starting HD during hospitalization from which they were discharged to continue outpatient HD. The risk model is available as an online tool and considers variables such as age, Charlson comorbidities index, cancer, length of hospital admission, intensive care status, discharge disposition, prehospital admission estimated glomerular filtration rate (eGFR), and random urine albumin-to-creatinine ratio, which are routinely available at discharge.
Given the notable number of incident HD patients in Portugal, there is a critical need for a mortality risk predictor. Such a tool is essential for optimizing therapeutic interventions and refining management strategies in this specific patient population.
Acknowledging the potential variability in the accuracy of prediction models across diverse populations, our study aims to validate the Death Outcome risk score in a Portuguese cohort.
Materials and methodsThis study is a retrospective analysis of patients who initiated hemodialysis during hospitalization in Unidade Local de Saúde Santa Maria (ULS-SM) in Lisbon, Portugal. The Ethical Committee approved of this study, in agreement with institutional guidelines. Informed consent was waived, given the retrospective and non-interventional nature of the study.
ParticipantsWe selected as eligible all adult patients (≥18 years of age) who initiated hemodialysis during hospitalization from January 1st of 2016 to December 31st of 2019 and were discharged to outpatient dialysis. Patients were excluded as follows: patients who died before hospital discharge, patients who did not continue dialysis after discharge from hospital, patients who died within one week after hospital discharge, patients with previous kidney replacement therapy, patients without previous laboratory assessment of serum creatinine, and patients lost to follow-up.
Variables, definitions, and outcomesData was obtained from individual electronic clinical records. We collected the following variables: demographic characteristics (age, gender, race); comorbidities [CKD, diabetes mellitus, hypertension, ischemic cardiomyopathy, heart failure, chronic obstructive pulmonary disease (COPD), cerebrovascular disease, dementia, chronic liver disease, and active malignancy (diagnosed within the previous 5 years)]; baseline creatinine (SCr); baseline urine albumin-to-creatinine ratio (ACR); laboratory at hemodialysis start [hemoglobin, serum albumin, SCr, estimated glomerular filtration rate (eGFR)]; time from admission to hemodialysis start; time from hemodialysis start to discharge; discharge status (independent, home care, nursing home).
Presence of CKD was defined as an eGFR lower than 60ml/min/1.73m2.10 The estimated glomerular filtration rate (eGFR) was calculated using the Chronic Kidney Disease Epidemiology Collaboration (CKD-EPI) creatinine equation.11,12 Baseline SCr was considered as the most recent outpatient value 7–365 days before hospitalization. For the remanining comorbidities indication on clinical records of previous diagnosis was considered sufficient. Comorbidity burden was quantified using the Charlson score.13,14
The risk of death within one year of discharge was calculated according to the ReDO score with the online tool available at: https://qxmd.com/calculate/calculator_874.9
We evaluated all-cause mortality within one year of hospital discharge.
Statistical methodsCategorical variables were described as the absolute and relative frequency of each category. Continuous variables were described as the mean±standard deviation. To determine if variables were normally distributed, the Kolmogorov–Smirnov normality test was used. Continuous variables were compared using Student's t-test, whereas categorical variables were compared using Chi-square test.
We classified patients into death outcome risk groups according to the ReDO predictive score. Cox regression method was used to determine if the risk score was predictive of mortality within the first year after discharge. The discriminatory ability for the ReDO score to predict mortality was determined using the receiver operating characteristic (auROC) curve. A cut-off value was defined as that with the highest validity by determining the Youden point. Calibration was tested by the Hosmer–Lemeshow test.
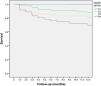
Kaplan–Meier survival analysis was performed to estimate the survival during the first year of hemodialysis according to the ReDO score.
Data were conveyed as hazard ratios (HR) with 95% confidence intervals (CI). Statistical significance was established as a p-value lower than 0.05. Statistical analysis was achieved using the statistical software package SPSS for Windows (version 21.0).
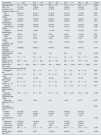
ResultsOur study focused on a cohort of 369 patients with a mean age of 71.1±14.3 years. The majority were male (59.9%, n=221) and 87% were Caucasian (n=321). Baseline characteristics are described in Table 1.
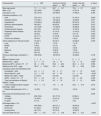
Baseline patient characteristics and according to mortality within the first year.
| Characteristics | n=369 | Survival in the first year(n=287) | Death in the first year(n=82) | p-Value |
|---|---|---|---|---|
| Mean age (years) | 71.1±14.3 | 68.7±14.7 | 79.4±8.7 | <0.001 |
| Male, n (%) | 221 (59.9) | 174 (60.6) | 47 (57.3) | 0.590 |
| Caucasian, n (%) | 321 (87.0) | 244 (85.0) | 77 (93.9) | 0.350 |
| Comorbid conditions, n (%) | ||||
| CKD | 272 (73.7) | 211 (73.5) | 61 (74.4) | 0.893 |
| Diabetes mellitus | 170 (46.1) | 130 (45.3) | 40 (48.8) | 0.577 |
| Hypertension | 319 (86.4) | 254 (88.5) | 65 (79.3) | 0.031 |
| Ischemic cardiomyopathy | 96 (26.0) | 66 (23.0) | 30 (36.6) | 0.013 |
| Heart failure | 161 (43.6) | 112 (39.0) | 49 (59.8) | 0.001 |
| Cerebrovascular disease | 55 (14.9) | 40 (13.9) | 15 (18.3) | 0.329 |
| Peripheral arterial disease | 56 (15.2) | 41 (14.3) | 15 (18.3) | 0.372 |
| Dementia | 23 (6.2) | 14 (4.9) | 9 (11.0) | 0.044 |
| COPD | 43 (11.7) | 31 (10.8) | 12 (14.6) | 0.340 |
| Chronic liver disease | 20 (5.4) | 16 (5.6) | 4 (4.9) | 0.801 |
| Active malignancy in the past 5 years | 74 (20.1) | 52 (18.1) | 22 (26.8) | 0.330 |
| Lung | 2 (0.5) | 1 (0.3) | 1 (1.2) | |
| Breast | 3 (0.8) | 3 (1.0) | 0 (0) | |
| KUB | 16 (4.3) | 12 (4.2) | 4 (4.9) | |
| Myeloma | 25 (6.8) | 18 (6.3) | 7 (8.5) | |
| Other | 28 (7.6) | 18 (6.3) | 10 (12.2) | |
| Previous nephrology consultation, n (%) | 206 (55.8) | 166 (57.8) | 40 (48.8) | 0.145 |
| Median Charlson score | 7±3 | 7±3 | 8±2 | <0.001 |
| Baseline SCr – mg/dL | 3.7±1.5 | 3.8±1.6 | 3.4±1.3 | 0.085 |
| Baseline eGFR – ml/min/1.73m2 | 28±21.8 | 28.3±22.0 | 28.4±21.2 | 0.956 |
| Baseline urine ACR – mg/g | 387.6±1324.2 | 412±1326 | 301±1322 | 0.504 |
| Laboratory values at hemodialysis start | ||||
| Hemoglobin – g/dL | 9.4±1.7 | 9.3±1.7 | 9.5±1.5 | 0.345 |
| Serum albumin – g/dL | 3.3±0.6 | 3.4±0.6 | 3.1±0.6 | <0.001 |
| Median SCr (IQR) – mg/dL | 6.3 (3.01) | 6.4 (3.2) | 5.5 (2.8) | 0.256 |
| eGFR – ml/min/1.73m2 | 8.2±4.4 | 8.0±4.2 | 9.0±4.8 | 0.063 |
| Time from admission to dialysis initiation – days | 5.1±2.9 | 4.9±1.6 | 5.5±1.2 | 0.600 |
| Time from dialysis start to hospital discharge – days | 16.3±7.4 | 15.1±7.3 | 20.4±10.2 | 0.015 |
| Dialysis first performed in ICU, n (%) | 14 (3.8) | 10 (3.5) | 4 (4.9) | 0.635 |
| AV access at hemodialysis start, n (%) | 0.250 | |||
| Catheter | 290 (78.6) | 221 (77.0) | 69 (84.1) | |
| AV fistula | 74 (20.0) | 61 (21.3) | 13 (15.9) | |
| AV graft | 5 (1.4) | 5 (1.7) | 0 (0) | |
| Discharge status, n (%) | <0.001 | |||
| Independent | 240 (65.0) | 204 (71.1) | 36 (43.9) | |
| Home care | 81 (22.0) | 53 (18.5) | 28 (34.1) | |
| Nursing home | 48 (13.0) | 30 (10.4) | 18 (22.0) | |
| One-year death risk (%) | 29.7±14.0 | 27.1±13.9 | 38.8±10.3 | <0.001 |
ACR: albumin-to-creatinine ratio; AV: arterio-venous; CKD: chronic kidney disease; COPD: chronic obstructive pulmonary disease; eGFR: estimated glomerular filtration rate; ICU: intensive care unit; IQR: interquartile range; KUB: kidney, ureter and/or bladder; SCr: serum creatinine.
Eighty six percent of patients had hypertension (n=319), 73.3% had CKD (n=272) and 55.8% were followed in nephrology consults, 46.1% had diabetes mellitus (n=170) and 43.6% had heart failure (n=161). Twenty percent (n=74) of patients had been diagnosed with malignancy in the 5 years prior to this study. Median Charlson score of this population was 7±3.
Mean baseline SCr was 3.7±1.5mg/dL, eGFR was 28±21.8ml/min/1.73m2 and urine ACR was 387.6±1324.2mg/g. Mean time from baseline data collection to hemodialysis initiation was 123.1±101.2 days. Concerning laboratory at hemodialysis start, mean hemoglobin was 9.4±1.7g/dL, albumin was 3.3±0.6g/dL, creatinine was 6.3 (3.01)mg/dL with an eGFR of 8.2±4.4ml/min/1.73m2.
The time from admission to dialysis start was 5.1±8.9 days and from the start of dialysis to hospital discharge 16.3±17.4 days. Most patients started hemodialysis with a central venous catheter (78.6%, n=290). Dialysis was started in the intensive care unit in 14 patients (3.8%).
At discharge all patients were on hemodialysis and 65% were independent (n=240), 22% had home care (n=81), and 13% were discharged to a nursing home (n=48).
The mortality rate within one year after discharge was 22.2% (n=82). Patients who died within the first year after hemodialysis start were older (79.4±8.7 vs 68.7±14.7 years, p<0.001), had a lower prevalence of hypertension (79.3 vs 88.5%, p=0.031), and a higher median Charlson score (8±2 vs 7±3, p<0.001), with more prevalence of heart failure (59.8 vs 39.0%, p=0.001), ischemic cardiomyopathy (36.6 vs 23.0%, p=0.013) and dementia (11.0 vs 4.9%, p=0.044). These patients also had significantly lower serum albumin (3.1±0.6 vs 3.4±0.6g/dL, p<0.001), a longer time from dialysis start to discharge, and were more frequently discharged to home care or nursing home (p<0.001).
The one-year death outcome (DO) risk of the cohort was 29.7±14.0%, and it was significantly higher in the subgroup of patients who died (38.8±10.3 vs 27.1±13.9%, p<0.001).
Concerning the DO risk, patients were divided in four groups, from lowest score or probability of death to highest, from D1 to D4, as shown in Table 2. Thirty percent of patients were D1 (n=112), 21.7% were D2 (n=80), 19.2% were D3 (n=71) and 28.7% were D4 (n=106). The one-year survival was significantly lower in patients with the highest probability of death (D4=61.3% vs D3=67.6% vs D2=81.3% vs D4=97.3%, p<0.001) – Fig. 1. The Kaplan–Meier plot for death of each DO group is displayed in Fig. 2.
ReDO Death score and corresponding death outcome risk groups: observed 1-year death frequency.
| ReDO groups | ReDO score – death | n=369 | Mortality (n=82) | 1-Year survival | p-Value |
|---|---|---|---|---|---|
| D1 | ≤14 | 112 (30.4) | 3 (3.7) | 97.3% | <0.001 |
| D2 | 15–17 | 80 (21.7) | 15 (18.3) | 81.3% | |
| D3 | 18–19 | 71 (19.2) | 23 (28.0) | 67.6% | |
| D4 | 20+ | 106 (28.7) | 41 (50.0) | 61.3% |


Patients in D4 were older (p<0.001), had a higher median Charlson score (p<0.001), higher prevalence of active malignancy (p<0.001), longer time from dialysis start to discharge (p<0.001), and were more often discharged with home care or to a nursing home (p<0.001) (Table 3).
Patient characteristics by death outcome risk group.
| Characteristics | n=369 | D1(n=112) | D2(n=80) | D3(n=71) | D4(n=106) | p-Value |
|---|---|---|---|---|---|---|
| Mean age (years) | 71.1±14.3 | 56.8±14.2 | 73.9±8.2 | 77.4±7.4 | 80.0±9.1 | <0.001 |
| Male, n (%) | 221 (59.9) | 70 (62.5) | 45 (56.3) | 40 (56.3) | 66 (62.3) | 0.710 |
| Caucasian, n (%) | 321 (87.0) | 83 (74.1) | 72 (90.0) | 65 (91.5) | 101 (95.3) | <0.001 |
| Comorbid conditions, n (%) | ||||||
| CKD | 272 (73.7) | 83 (74.1) | 61 (76.3) | 51 (71.8) | 77 (72.6) | 0.926 |
| Diabetes mellitus | 170 (46.1) | 38 (33.9) | 42 (52.5) | 38 (53.5) | 52 (49.1) | 0.019 |
| Hypertension | 319 (86.4) | 97 (86.6) | 69 (86.3) | 63 (88.7) | 90 (84.9) | 0.911 |
| Ischemic cardiomyopathy | 96 (26.0) | 15 (13.4) | 28 (35.0) | 20 (28.2) | 33 (31.1) | 0.003 |
| Heart failure | 161 (43.6) | 28 (25.0) | 32 (40.0) | 41 (57.7) | 60 (56.6) | <0.001 |
| Cerebrovascular disease | 55 (14.9) | 15 (13.4) | 11 (13.8) | 9 (12.7) | 20 (18.9) | 0.598 |
| Peripheral arterial disease | 56 (15.2) | 11 (9.8) | 11 (13.8) | 14 (19.7) | 20 (18.9) | 0.181 |
| Dementia | 23 (6.2) | 2 (1.8) | 6 (7.5) | 4 (5.6) | 11 (10.4) | 0.067 |
| COPD | 43 (11.7) | 8 (7.1) | 11 (13.8) | 13 (18.3) | 11 (10.4) | 0.123 |
| Chronic liver disease | 20 (5.4) | 4 (3.6) | 3 (3.8) | 4 (5.6) | 9 (8.5) | 0.371 |
| Active malignancy in the past 5 years | 74 (20.1) | 5 (4.5) | 5 (6.3) | 16 (22.5) | 48 (45.3) | <0.001 |
| Previous nephrology consultation, n (%) | 206 (55.8) | 68 (60.7) | 50 (62.5) | 38 (53.5) | 50 (47.2) | 0.116 |
| Median Charlson score (IQR) | 7 (2-9) | 5 (3) | 7 (3) | 8 (2) | 9 (3) | <0.001 |
| Baseline SCr – mg/dL | 3.7±1.5 | 4.4±1.8 | 3.8±1.1 | 3.4±1.3 | 3.2±1.3 | <0.001 |
| Baseline eGFR –ml/min/1.73m2 | 28.3±21.8 | 27.4±23.2 | 25.5±20.4 | 29.2±20.9 | 30.8±21.9 | 0.386 |
| Baseline urine ACR – mg/g | 387.6±1324.2 | 381.2±1004.5 | 745.1±2063.2 | 58.9±216.8 | 344.7±1293.2 | 0.015 |
| Laboratory values at hemodialysis start | ||||||
| Hemoglobin – g/dL | 9.4±1.7 | 9.3±1.5 | 9.4±1.6 | 9.7±2.2 | 9.2±1.5 | 0.229 |
| Serum albumin – g/dL | 3.3±0.6 | 3.5±0.6 | 3.4±0.6 | 3.2±0.6 | 3.2±0.7 | 0.002 |
| Median SCr (IQR) – mg/dL | 6.3 (3.01) | 4.3 (1.8) | 4.0 (1.6) | 3.5 (1.7) | 3.3 (1.6) | 0.060 |
| eGFR – ml/min/1.73m2 | 8.2±4.4 | 7.7±5.4 | 7.8±3.4 | 9.4±4.4 | 8.2±3.6 | 0.048 |
| Time from admission to dialysis initiation – days | 5.1±8.9 | 4.1±6.7 | 3.1±6.8 | 7.2±13.0 | 6.1±8.4 | 0.017 |
| Time from dialysis start to hospital discharge – days | 16.3±17.4 | 9.5±8.0 | 13.7±14.4 | 21.3±24.6 | 22.0±18.2 | <0.001 |
| Dialysis first performed in ICU, n (%) | 14 (3.8) | 4 (3.8) | 0 (0) | 4 (5.6) | 6 (5.7) | 0.218 |
| AV access at hemodialysis start, n (%) | 0.923 | |||||
| Catheter | 290 (78.6) | 84 (75) | 63 (78.8) | 59 (83.5) | 84 (79.2) | |
| AV fistula | 74 (20.0) | 26 (23.2) | 16 (20.0) | 11 (15.5) | 21 (19.8) | |
| AV graft | 5 (1.4) | 2 (1.8) | 1 (1.3) | 1 (1.4) | 1 (0.9) | |
| Discharge status, n (%) | <0.001 | |||||
| Independent | 240 (65.0) | 105 (93.8) | 56 (70.0) | 47 (66.2) | 32 (30.2) | |
| Home care | 81 (22.0) | 7 (6.3) | 17 (21.3) | 16 (22.5) | 41 (38.7) | |
| Nursing home | 48 (13.0) | 0 (0) | 7 (8.8) | 8 (11.3) | 33 (31.1) | |
| One-year death risk (%) | 29.7±14 | 12.1±0.7 | 25.9±1.9 | 35.2±1.7 | 47.4±2.2 | <0.001 |
| Mortality within 1 year, n (%) | 82 (22.2) | 3 (2.7) | 15 (18.8) | 23 (32.4) | 41 (38.7) | <0.001 |
ACR: albumin-to-creatinine ratio; AV: arterio-venous; CKD: chronic kidney disease; COPD: chronic obstructive pulmonary disease; eGFR: estimated glomerular filtration rate; ICU: intensive care unit; IQR: interquartile range; KUB: kidney, ureter and/or bladder; SCr: serum creatinine.
The ReDO Death score accurately predicted the one-year risk of mortality, with a hazard ratio of 1.2 [95% CI (1.15–1.31), p<0.001]. The Hosmer–Lemeshow test indicated good fit of this model (p=0.167).
The ReDO Death score predicted the one-year risk of mortality with an auROC of 0.741 [95% CI (0.687–0.794), p<0.001] (Fig. 2), with a sensitivity of 78.9% and specificity of 60.6% (Table 4). The optimal ReDO Death risk cut-off was >30%, with a hazard ratio of 6.57 [95% CI (3.48–12.2), p<0.001] for one year risk of death.
Mortality was significantly higher in older patients (HR 1.1 [95% CI (1.05–1.11), p<0.001]), Caucasians (HR 2.7 [95% CI (1.04–7.09), p=0.042]), patients with heart failure (HR 2.3 [95% CI (1.40–3.83), p=0.001]), patients with ischemic cardiomyopathy (HR 1.9 [95% CI (1.14–3.27), p=0.014]) and higher Charlson score (HR 1.3 [95% CI (1.13–1.39), p<0.001]). Hypertension was associated with lower risk of death (HR 0.49 [95% CI (0.26–0.95), p=0.034]), and so were higher albumin levels at hemodialysis start (HR 0.4 [95% CI (0.27–0.66), p<0.001]).
On a multivariate analysis, older age (adjusted HR 1.08 [95% CI (1.05–1.12), p<0.001]) was the only significant predictor of one-year mortality. Hypertension (adjusted HR 0.29 [95% CI (0.13–0.62), p=0.001]) and higher albumin levels (adjusted HR 0.46 [95% CI (0.28–0.75), p=0.002]) were protective factors for one-year mortality.
DiscussionIn this cohort of patients who initiated hemodialysis during hospitalization, the mortality rate within one year of discharge was 22.2% and the ReDO Death score accurately predicted the one-year risk of mortality. We also identified that a ReDO Death risk >30% was a significant risk predictor for one-year mortality.
Data from the United States Renal Data System shows that although mortality in the first year after dialysis initiation has been decreasing, it remains high (217.3 per 1000 person-years), with over half being due to cardiovascular disease.15 The ERA Registry Annual Report 2021 demonstrated a one-year survival of 87%, corresponding to a 13% mortality rate, which is lower than what we found in our cohort, but still significant.16
As such, it is important to assess patients’ prognosis after hemodialysis start. This is fundamental to tailoring medical care, facilitating shared decision-making, and providing appropriate support and resources. In this setting of significant early mortality risk, understanding and managing patient trajectories enables healthcare professionals to deliver patient-centered care that aligns with the individual needs and goals of each patient while optimizing resource use.
The original ReDO score included a derivation and validation cohort of a total of 9160 Canadian patients, which started dialysis during hospitalization and were discharged to continue outpatient dialysis. The authors created a model to predict kidney recovery to dialysis independence and death (all-cause mortality) within 1 year of hospital discharge, generating the ReDO Kidney Recovery Score and ReDO Death Outcome Score, respectively. Predictive variables included age, comorbidities, health burden (including the Charlson score, and new cancer diagnosed in previous 5 years), length of hospital admission, intensive care status, discharge disposition, prehospital admission eGFR and random urine albumin-to-creatinine ratio. These are easily attained variables at discharge from hospitalization or at patient admission in a Dialysis Unit and using the online tool can easily provide useful information. Compared to the original derivation cohort, our cohort is similar in terms of age, if slightly older (71.1 years vs. 67 years), and of male preponderance (59.9% vs 62%). However, our Portuguese cohort had lower prevalence of diabetes (46.1% vs. 67%) and of heart failure (43.6% vs. 52%), but higher prevalence of active malignancy (20.1% vs. 13%) and ischemic cardiomyopathy (26% vs. 15%). Median Charlson score was higher in our cohort than in the derivation cohort (7 vs. 5).
The ReDO Death Outcome also accounted for a significant interaction between age and Charlson score, and for a lower predicted probability of death with lower baseline GFR. In the derivation cohort, the c-statistic of the DO risk score was 0.65 (95% CI, 0.60–0.69) and although in the validation group model discrimination was modest (c-statistics [95% CI] 0.66 [0.62–0.69]), calibration was good (integrated calibration index [95% CI] was 4% [2–6%] for death). These results were similar in our cohort, in which the DO risk score had an adequate auROC of 0.741, which corroborates the accuracy of this risk score.
To our knowledge, the ReDO Death Outcome Score has not been studied in other populations. Nevertheless, other studies have looked at predicting early mortality after dialysis initiation. Thamer et al. presented a comprehensive risk model (auROC=0.72) to predict all-cause mortality in the first 3 and 6 months after hemodialysis start in patients aged 67 years or older, that assigned points for age, sex, race, serum creatinine, hypoalbuminemia, catheter use, Nephrology referral, functional status and comorbidities as predictors of mortality.17
We found that patients who died within the first year were significantly older, with more prevalent comorbidities such as heart failure, ischemic cardiomyopathy, and dementia, and with a higher median Charlson score.18 They were also more frequently discharged to home care or nursing home settings, had lower serum albumin and longer hospital stays. Indeed, the fact that the Death Outcome risk score incorporates many of these variables render it effective in assessing for early mortality after starting hemodialysis.
A systematic review and meta-analysis of validated risk scores predicting death after dialysis start evaluated 36 studies (of which 31 on hemodialysis and 5 on peritoneal dialysis), and most studies used prognostic variables such as age and comorbidities; five studies also used functional status and one evaluated length of hospital stay.19,20 The Charlson comorbidity index presented the most consistent discrimination performance (auROC=0.74), which is also included in the DO risk score. In a third of the cases no external validation was conducted, contrasting with the ReDO Death score original study.
The ReDO Death score is a simple tool that can be used at the time of hospital discharge, to better tailor medical care to the patients’ needs. An individualized care plan should be discussed with the patient or with their healthcare proxy throughout their entire hospital stay. When the discharge date is presumed to be near, the subject should be revisited and discussed to ensure a smooth transition to out-of-hospital care. The patients’ needs, goals and medical trajectory may need to be reassessed, and decisions such as transition of care to a hemodialysis facility versus best supportive care can be discussed.
When the decision to remain on hemodialysis is made, vascular access planning must also be considered. In most of our cohort, a catheter was used at the start of hemodialysis. Although more than half the patients had previous Nephrology follow-up, the lack of functional fistula or grafts might be in some cases explained by unexpected acute-on-chronic kidney injury, patient option and/or frailty. The most recent guidelines recognize the complexity of decisions regarding hemodialysis access, and promote individualized decisions, taking into account the patient's foreseeable lifespan, functional status, social support, preferences and life goals.21 In this regard, the ReDO Death score might be an additional tool in deciding whether to create a fistula or graft.
As limitations of this study, we recognize its retrospective and single center nature, which limit the generalization of these results. Secondly, the moderate size of this sample also limits further data generalization. Thirdly, although there was a high prevalence of prior CKD in our cohort, we acknowledge that CKD cause was not ascertained which could have implication on patient mortality (e.g. patients may have been under prior immunosuppression). Fourthly, mortality causes were not assessed which could also be important to interpret our results. Additionally, mortality within the first week post-discharge was excluded due to challenges in accurate ascertainment. During the transition to outpatient care, patients may not yet be captured in the receiving dialysis clinic's mortality records. To account for this potential data gap, these cases were excluded from the study population.
Finally, in contrast to the original study, we did not evaluate kidney function recovery to hemodialysis independence.
Future research on outcomes in patients initiating hemodialysis may consider comparing the discriminatory performance of the Charlson comorbidity index to the ReDO Death score.
Nevertheless, our study has several strengths. This is the first study to validate the ReDO Death Outcome risk score as a prognostic tool in a Portuguese population. The necessary variables for its application are routinely recorded information, which allow for important multivariate analysis. In addition, the good discriminatory ability and high sensitivity of this model suggest that many patients may be identified using this tool.
In conclusion, we validated the ReDO Death Outcome risk score for one-year mortality prediction after hemodialysis start in a Portuguese population. This score should be used as a tool to inform goals-of-care discussion at the time of transition to out-of-hospital care, involving the in-hospital nephrology care team, the patient, and, if applicable, the future care team, as it can enlighten clinical decisions and, in some cases, lead to better end-of-life planning.
CRediT authorship contribution statementJG was responsible for study conception and design. TP, BT, MC, JAF, CO, SJ and CR collected the data. TP, BT and JG contributed to data analysis and interpretation and draft elaboration. JAL, CO, SJ, CR, JAL and JG provided significant intellectual content. All authors contributed to revision of the manuscript. All authors have approved the final version of the article.
FundingNone to report.
Conflict of interestOn behalf of all authors, the corresponding author states that there is no conflict of interest.
We thank all colleagues at Unidade Local de Saúde Santa Maria, for their support and contributions to this study.


