

It was aimed to examine the relationship between cognitive impairment (CI) and Aβ40, 42, Aβ42/40 ratio and p-tau181 in chronic kidney disease (CKD) patients at all stages.
PatientsThe patients were divided into four groups; control, the early stage CKD (stage 1–3), the advanced stage CKD (stage 4–5) and the hemodialysis group. All patients completed the MMSE and MoCA tests for CI. The Aβ40, Aβ42, p-tau181 levels of all participants were measured.
ResultThe result of the MMSE was significantly lower in CKD group (p=0.005). There was a significant negative correlation between the MMSE and CKD stages (Spearman's rho=−0.29, p=0.001). The Aβ42 level was significantly lower in the hemodialysis patients. The highest Aβ40 level was observed in the hemodialysis patients, and the Aβ40 level was significantly higher in the advanced CKD group as compared to the early CKD patients and controls (p<0.001). The Aβ42/40 ratio was low in the hemodialysis patients (p=0.001). There was a significant negative correlation between the MMSE and Aβ40 (Spearman's rho=0.18, p=.018), and a positive correlation between the MMSE and the Aβ42/40 ratio (Spearman's rho=−0.360, p<.001). MoCA was negatively correlated with the Aβ40 levels (Spearman's rho=−0.185, p=.019). In the multiple analysis with the MMSE, it was determined high Aβ40 level was correlated with the low MMSE score.
ConclusionIt was found that there was a significant relationship between CI and the Aβ40 level in the CKD patients, that CI increased as the CKD stages progressed, that there was a significant negative correlation between the MMSE and MoCA tests and Aβ40, and there was a significant positive correlation between the MMSE and the Aβ42/Aβ40 ratio.
Se buscó examinar la relación entre el deterioro cognitivo (DC) y el Aβ40, 42, la razón Aβ42/40 y p-tau181 en pacientes con enfermedad renal crónica (ERC) en todas las etapas.
PacientesSe dividió a los pacientes en cuatro grupos: control, ERC en etapa temprana (estadios 1-2-3), ERC en etapa avanzada (estadios 4-5) y grupo de hemodiálisis. Todos los pacientes completaron las pruebas MMSE y MoCA para DC. Se midieron los niveles de Aβ40, Aβ42 y p-tau181 de todos los participantes.
ResultadoEl resultado del MMSE fue significativamente menor en el grupo de ERC (p=0,005). Hubo una correlación negativa significativa entre el MMSE y los estadios de ERC (rho de Spearman=−0,29, p=0,001). El nivel de Aβ42 fue significativamente menor en los pacientes en hemodiálisis, el nivel más alto de Aβ40 se observó en los pacientes en hemodiálisis y el nivel de Aβ40 fue significativamente mayor en el grupo de ERC avanzada en comparación con los pacientes con ERC temprana y los controles (p<0,001). La relación Aβ42/40 fue baja en los pacientes en hemodiálisis (p=0,001). Se observó una correlación negativa significativa entre el MMSE y el Aβ40 (rho de Spearman=0,18; p=0,018), y una correlación positiva entre el MMSE y la relación Aβ42/40 (rho de Spearman=−0,360; p<0,001). La MoCA se correlacionó negativamente con los niveles de Aβ40 (rho de Spearman=−0,185; p=0,019). En el análisis múltiple con el MMSE, se determinó que un nivel alto de Aβ40 se correlacionaba con una puntuación baja en el MMSE.
ConclusiónSe encontró que hubo una relación significativa entre el IC y el nivel de Aβ40 en los pacientes con ERC, que el IC aumentó a medida que progresaron las etapas de la ERC, que hubo una correlación negativa significativa entre las pruebas MMSE y MoCA y Aβ40, y hubo una correlación positiva significativa entre el MMSE y la relación Aβ42/Aβ40.
As the world population ages, CI and Alzheimer's disease increases. CKD is a strong risk factor for the loss of cognitive function, and the CI at a rate up to 60% is observed in CKD patients.1 This increases unintended consequences ranging from deterioration in quality of life to increase in mortality.2
The amyloid hypothesis is a hypothesis that is accepted in the pathogenesis of Alzheimer's disease. This hypothesis suggests misfolding of extracellular Aβ protein accumulated in senile plaques and intracellular accumulation of misfolded tau protein in neurofibrillary glomus as the main cause of the disease, and these accumulations lead to memory loss, personality and cognitive regression.3 In the study carried out by Soldan et al., it was demonstrated that the amyloid beta (Aβ42/Aβ40) and p-tau181 levels change in the early stages of mild loss of cognitive function and dementia.4
The kidney is the organ that plays the main role in the clearance of Aβ and tau, which pass into the plasma. As the glomerular filtration rate (GFR) decreases, the level of these molecules in the blood increases.5 As the GFR decreases, the CI also increases. Each 10ml/min decrease in the GFR increases the CI by 15–25%, and a decrease in the GFR below 45ml/min increases it 2.43 times.6
The effect of many factors on the more frequent CI in CKD was researched. Microvascular and macrovascular changes, hippocampal atrophy, neurotoxic effects of uremic toxins, decreased clearance and accumulation of Aβ are the most important of these factors.7
One of the oldest tests known for the assessment of cognitive function is the mini mental state examination (MMSE) test. It was developed by Felstein et al. in 1975. It takes 5–10min. It focuses on the cognitive aspects of the mental functions.8 The Montreal cognitive assessment (MoCA) test is another test that is used in order to evaluate cognitive function. It was developed by Nasreddine et al. in 2005.9 Both tests were used in order to assess cognitive function in CKD patients.10–12
In this study, the relationship between cognitive function and Aβ40, 42, Aβ42/40 ratio and p-tau181 was assessed in the CKD patients at all stages, including the renal replacement therapy stage, starting from the stage 1.
MethodThis cross-sectional study was initiated after the approval of the local ethics committee (approval number: 2024/291) and the verbal and written consents of the patients were obtained. The control group was selected from the individuals who did not have any health problems and applied to the hospital for general control. The predialysis CKD patients were taken from the patients who applied to our Nephrology outpatient clinic, and those who received renal replacement therapy were taken from the patients who had hemodialysis treatment in our hospital's hemodialysis unit. The patients were divided into four groups, namely the control group, the early stage CKD (stage 1–3), the advanced stage CKD (stage 4–5) and the hemodialysis group. Patients who were under the age of 18 and have history of cerebrovascular disease, psychiatric disease and dementia were excluded from the study. The study was completed with 161 patients. The factors affecting cognitive function; place of residence (village, town, district, provincial center), educational status (unschooled, primary school, secondary school, high school, university graduate), income status (below and above 20,000 Turkish liras) were recorded. The usage status of vitamin D, iron, folic acid, B12, renin angiotensin inhibitor, sodium-glucose cotransporter 2 (SGLT2) inhibitor, and phosphorus binder were searched. Glucose, urea, creatinine, sodium, potassium, calcium, phosphorus, magnesium, albumin, uric acid, white blood cell (wbc), hemoglobin (Hgb), platelet, serum 25 OH-d vit, B12, folate, and ferritin levels were recorded as the laboratory parameters.
Evaluation of cognitive functionIt was assessed by the MMSE and MoCA tests.
The form of the MMSE test which was validated by Güngen et al. was used.13 The test consisted of five parts, namely orientation, recording memory, attention and calculation, recall and language. With the total score of 30, a score of 24 and above was considered as normal and a score below 24 as loss of cognitive function.
The Turkish validation of the MoCA test was made by Selekler et al. in 2010.14 This form was used in the study. With the total score of 30, a score of 24 and above was considered as normal. The main cognitive areas include short-term memory, visual-spatial abilities, managing functions, attention, concentration, working memory, language and orientation to time and space.15
Measurement of plasma Aβ40, 42 and p-tau181The blood samples put into gel tubes were centrifuged at 2000g for 10min and eluted as serum. The serum samples were stored at −80°C until the date of the study.
The serum Aβ1–42 (Catalogue No: E-EL-H0543), Aβ1–40 (Catalogue No: E-EL-H0542) levels were analyzed by using commercial human ELISA kit (Elabscience Biotechnology, Shanghai, China), and the serum T181 (Catalogue No: E7668Hu) levels by using a commercial human ELISA kit (BT LAB, Zhejiang, PRC) according to the manufacturer's instructions. The absorbance of all wells was measured with the CLARIOstar Microplate Reader (BMG LABTECH, Ortenberg, Germany) at 450nm. The serum Aβ1–42, Aβ1–40 and p-tau181 concentrations were determined by using the calibration graph derived from the standards and the serum Aβ1–42, Aβ1–40 concentrations were expressed as pg/mL and the T181 concentration as ng/L. The %CV values of the commercial kit between and within the tests are less than 7%.
Statistical analysisAll statistical analysis was performed using R version 4.2.1 (www.r-project.org). To check the normality and homogeneity of the variances, Shapiro–Wilk's normality test and Levene's test were used. One-way ANOVA followed by Tukey HSD post-hoc test, Welch's F-test followed by Games–Howellpost-hoc test and Kruskal–Wallis test followed by Dunn post-hoc test with Bonferroni correction was applied to compare the study groups regarding the numerical demographical and clinical characteristics, and biochemical data. Also, Pearson chi-square test and Fisher–Freeman–Halton test were conducted to assess the association between study groups and categorical variables. Besides, Spearman's rho correlation analysis was performed to examine the relationship between amyloids and MMSE, and MoCA values. The significance level was set at 5%. The relationships between the high values of the MMSE and MoCA tests and the demographic and biochemical parameters of the patients were examined by means of single and multiple binary logistic regression. The significance level was set at 5%.
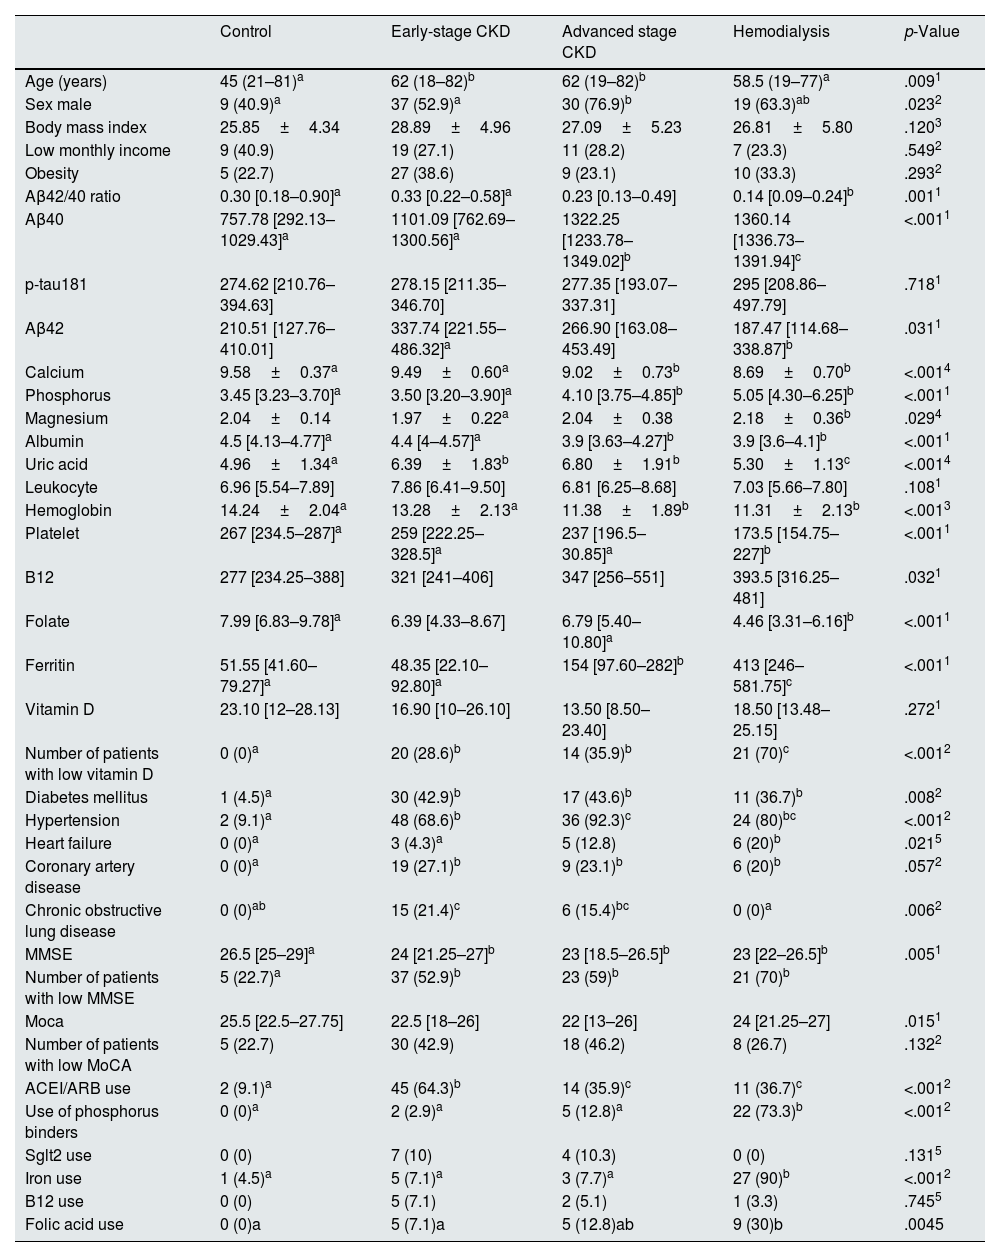
ResultsThe average age of the participants was 55.1±17 years, and 59% of the patients (n=95) were male. The control group consisted of 22 persons (13.7%), there were 19 (11.8%) patients in the stage 1 CKD group, 22 (13.7%) patients in the stage 2 CKD group, 29 (18%) patients in the stage 3 CKD group, 24 (14.9%) patients in the stage 4 CKD group, 15 (9.3%) patients in the stage 5 (predialysis) CKD group, and 30 (18.6%) patients in the hemodialysis group. The early stage CKD group consisted of 70 patients, and the advanced stage CKD group consisted of 39 patients. The patients in the control group and the hemodialysis group were younger than the patients in the predialysis CKD groups. When the groups were compared in terms of cognitive functions, the result of the MMSE was significantly lower in the predialysis CKD and hemodialysis group as compared to the control group (p=0.005). Likewise, the number of the patients with loss of cognitive function was significantly higher in the predialysis CKD and hemodialysis groups as compared to the control group (p=0.007) with the MMSE (Table 1).
Characteristics of the study population.
| Control | Early-stage CKD | Advanced stage CKD | Hemodialysis | p-Value | |
|---|---|---|---|---|---|
| Age (years) | 45 (21–81)a | 62 (18–82)b | 62 (19–82)b | 58.5 (19–77)a | .0091 |
| Sex male | 9 (40.9)a | 37 (52.9)a | 30 (76.9)b | 19 (63.3)ab | .0232 |
| Body mass index | 25.85±4.34 | 28.89±4.96 | 27.09±5.23 | 26.81±5.80 | .1203 |
| Low monthly income | 9 (40.9) | 19 (27.1) | 11 (28.2) | 7 (23.3) | .5492 |
| Obesity | 5 (22.7) | 27 (38.6) | 9 (23.1) | 10 (33.3) | .2932 |
| Aβ42/40 ratio | 0.30 [0.18–0.90]a | 0.33 [0.22–0.58]a | 0.23 [0.13–0.49] | 0.14 [0.09–0.24]b | .0011 |
| Aβ40 | 757.78 [292.13–1029.43]a | 1101.09 [762.69–1300.56]a | 1322.25 [1233.78–1349.02]b | 1360.14 [1336.73–1391.94]c | <.0011 |
| p-tau181 | 274.62 [210.76–394.63] | 278.15 [211.35–346.70] | 277.35 [193.07–337.31] | 295 [208.86–497.79] | .7181 |
| Aβ42 | 210.51 [127.76–410.01] | 337.74 [221.55–486.32]a | 266.90 [163.08–453.49] | 187.47 [114.68–338.87]b | .0311 |
| Calcium | 9.58±0.37a | 9.49±0.60a | 9.02±0.73b | 8.69±0.70b | <.0014 |
| Phosphorus | 3.45 [3.23–3.70]a | 3.50 [3.20–3.90]a | 4.10 [3.75–4.85]b | 5.05 [4.30–6.25]b | <.0011 |
| Magnesium | 2.04±0.14 | 1.97±0.22a | 2.04±0.38 | 2.18±0.36b | .0294 |
| Albumin | 4.5 [4.13–4.77]a | 4.4 [4–4.57]a | 3.9 [3.63–4.27]b | 3.9 [3.6–4.1]b | <.0011 |
| Uric acid | 4.96±1.34a | 6.39±1.83b | 6.80±1.91b | 5.30±1.13c | <.0014 |
| Leukocyte | 6.96 [5.54–7.89] | 7.86 [6.41–9.50] | 6.81 [6.25–8.68] | 7.03 [5.66–7.80] | .1081 |
| Hemoglobin | 14.24±2.04a | 13.28±2.13a | 11.38±1.89b | 11.31±2.13b | <.0013 |
| Platelet | 267 [234.5–287]a | 259 [222.25–328.5]a | 237 [196.5–30.85]a | 173.5 [154.75–227]b | <.0011 |
| B12 | 277 [234.25–388] | 321 [241–406] | 347 [256–551] | 393.5 [316.25–481] | .0321 |
| Folate | 7.99 [6.83–9.78]a | 6.39 [4.33–8.67] | 6.79 [5.40–10.80]a | 4.46 [3.31–6.16]b | <.0011 |
| Ferritin | 51.55 [41.60–79.27]a | 48.35 [22.10–92.80]a | 154 [97.60–282]b | 413 [246–581.75]c | <.0011 |
| Vitamin D | 23.10 [12–28.13] | 16.90 [10–26.10] | 13.50 [8.50–23.40] | 18.50 [13.48–25.15] | .2721 |
| Number of patients with low vitamin D | 0 (0)a | 20 (28.6)b | 14 (35.9)b | 21 (70)c | <.0012 |
| Diabetes mellitus | 1 (4.5)a | 30 (42.9)b | 17 (43.6)b | 11 (36.7)b | .0082 |
| Hypertension | 2 (9.1)a | 48 (68.6)b | 36 (92.3)c | 24 (80)bc | <.0012 |
| Heart failure | 0 (0)a | 3 (4.3)a | 5 (12.8) | 6 (20)b | .0215 |
| Coronary artery disease | 0 (0)a | 19 (27.1)b | 9 (23.1)b | 6 (20)b | .0572 |
| Chronic obstructive lung disease | 0 (0)ab | 15 (21.4)c | 6 (15.4)bc | 0 (0)a | .0062 |
| MMSE | 26.5 [25–29]a | 24 [21.25–27]b | 23 [18.5–26.5]b | 23 [22–26.5]b | .0051 |
| Number of patients with low MMSE | 5 (22.7)a | 37 (52.9)b | 23 (59)b | 21 (70)b | |
| Moca | 25.5 [22.5–27.75] | 22.5 [18–26] | 22 [13–26] | 24 [21.25–27] | .0151 |
| Number of patients with low MoCA | 5 (22.7) | 30 (42.9) | 18 (46.2) | 8 (26.7) | .1322 |
| ACEI/ARB use | 2 (9.1)a | 45 (64.3)b | 14 (35.9)c | 11 (36.7)c | <.0012 |
| Use of phosphorus binders | 0 (0)a | 2 (2.9)a | 5 (12.8)a | 22 (73.3)b | <.0012 |
| Sglt2 use | 0 (0) | 7 (10) | 4 (10.3) | 0 (0) | .1315 |
| Iron use | 1 (4.5)a | 5 (7.1)a | 3 (7.7)a | 27 (90)b | <.0012 |
| B12 use | 0 (0) | 5 (7.1) | 2 (5.1) | 1 (3.3) | .7455 |
| Folic acid use | 0 (0)a | 5 (7.1)a | 5 (12.8)ab | 9 (30)b | .0045 |
Different small supercript letters in each column indicate statistical significance p<.05.
1Kruskal–Wallis test; 2Pearson chi-square test; 3One-way ANOVA test; 4Welch's F-test; 5Fisher–Freeman–Halton test. Data were presented as mean±standard deviation, median with ranges (min–max) or median with quartiles [1st quartile–3rd quartile] for numerical variables, as appropriate. Data were described as count (n) and percentage (%) for categorical variables.
There was a significant negative correlation between the MMSE and the CKD stages (Spearman's rho=−0.29, p=0.001). In addition, there was a negative positive correlation between the MMSE and age (Spearman's rho=−0.38, p<0.001) and phosphorus level (Spearman's rho=−0.31, p<0.001), and a significant positive correlation between the MMSE and education level (Spearman's rho=0.50, p<0.001), hemoglobin level (Spearman's rho=0.24, p=0.002), and vitamin D level (Spearman's rho=0.2, p=0.007).
The result of the MoCA was lower in the patients with predialysis CKD as compared to the control group and groups (p=0.132) according to the MoCA. There was no significant correlation between the MoCA test and the CKD stages. The MoCA was negatively correlated with age ((Spearman's rho=−0.44, p<0.001) and positively correlated with education level (Spearman's rho=0.55, p<0.001).
The Aβ42 level was significantly lower in the hemodialysis patients as compared to the early stage CRF patients (87.47 [114.68–338.87] vs 187.47 [114.68–338.87], respectively, p=0.3). The p-tau181 levels were similar among the study groups. The highest Aβ40 level was observed in the hemodialysis patients and this level was significantly higher than other groups. In addition, the Aβ40 level in the advanced CRF group was significantly higher than the early CKD patients and control groups (p<0.001). There was no significant difference between the Aβ40 levels of the early CKD and control groups. While the Aβ42/40 ratio was similar in the control and early-stage CKD patients, this rate was low in the hemodialysis patients (p=0.001).
There was a statistically significant relationship between the MMSE and Aβ40 (Spearman's rho=−0.18, p=0.01). There was a negative correlation between the MMSE and the Aβ42/40 ratio (Spearman's rho=−0.360, p<.001). In addition, MoCA was negatively correlated with the Aβ40 levels (Spearman's rho=−0.185, p=.019) (Table 2).
The correlation between Aβ40, Aβ42, p-tau181 and MMSE, MoCA.
| MMSE | MoCA | |||
|---|---|---|---|---|
| Spearman's rho | p-Value | Spearman's rho | p-Value | |
| Aβ42/40 ratio | 0.186 | .018 | 0.025 | .749 |
| Aβ40 | −0.360 | <.001 | −0.185 | .019 |
| p-tau181 | 0.026 | .743 | 0.115 | .146 |
| Aβ42 | −0.031 | .692 | −0.075 | .346 |
A p-value of less than .05 is consşderedstatictically significant. Values in bold indicate statistically significant results.
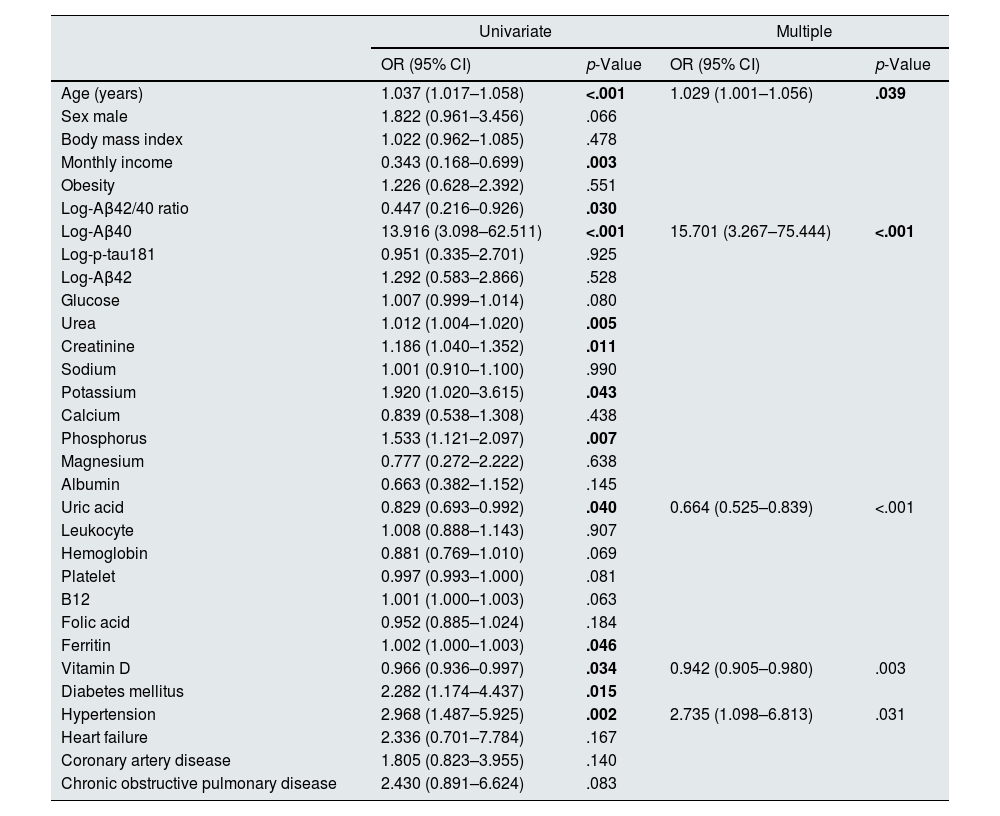
The relationship between the MMSE and the demographic and biochemical parameters of the patients was given in Table 3. While age, income, Aβ42/40 ratio, Aβ40 level, urea, creatinine, potassium, phosphorus, uric acid, ferritin, vitamin D and presence of diabetes mellitus (DM) and hypertension were found as correlated with the MMSE in the univariate analysis, the relationship between increasing age, high Aβ40 level, low uric acid and vitamin D level and presence of hypertension and the low MMSE score continued in the multiple analysis (Table 3).
The relationship between MMSE and clinical and laboratory parameters.
| Univariate | Multiple | |||
|---|---|---|---|---|
| OR (95% CI) | p-Value | OR (95% CI) | p-Value | |
| Age (years) | 1.037 (1.017–1.058) | <.001 | 1.029 (1.001–1.056) | .039 |
| Sex male | 1.822 (0.961–3.456) | .066 | ||
| Body mass index | 1.022 (0.962–1.085) | .478 | ||
| Monthly income | 0.343 (0.168–0.699) | .003 | ||
| Obesity | 1.226 (0.628–2.392) | .551 | ||
| Log-Aβ42/40 ratio | 0.447 (0.216–0.926) | .030 | ||
| Log-Aβ40 | 13.916 (3.098–62.511) | <.001 | 15.701 (3.267–75.444) | <.001 |
| Log-p-tau181 | 0.951 (0.335–2.701) | .925 | ||
| Log-Aβ42 | 1.292 (0.583–2.866) | .528 | ||
| Glucose | 1.007 (0.999–1.014) | .080 | ||
| Urea | 1.012 (1.004–1.020) | .005 | ||
| Creatinine | 1.186 (1.040–1.352) | .011 | ||
| Sodium | 1.001 (0.910–1.100) | .990 | ||
| Potassium | 1.920 (1.020–3.615) | .043 | ||
| Calcium | 0.839 (0.538–1.308) | .438 | ||
| Phosphorus | 1.533 (1.121–2.097) | .007 | ||
| Magnesium | 0.777 (0.272–2.222) | .638 | ||
| Albumin | 0.663 (0.382–1.152) | .145 | ||
| Uric acid | 0.829 (0.693–0.992) | .040 | 0.664 (0.525–0.839) | <.001 |
| Leukocyte | 1.008 (0.888–1.143) | .907 | ||
| Hemoglobin | 0.881 (0.769–1.010) | .069 | ||
| Platelet | 0.997 (0.993–1.000) | .081 | ||
| B12 | 1.001 (1.000–1.003) | .063 | ||
| Folic acid | 0.952 (0.885–1.024) | .184 | ||
| Ferritin | 1.002 (1.000–1.003) | .046 | ||
| Vitamin D | 0.966 (0.936–0.997) | .034 | 0.942 (0.905–0.980) | .003 |
| Diabetes mellitus | 2.282 (1.174–4.437) | .015 | ||
| Hypertension | 2.968 (1.487–5.925) | .002 | 2.735 (1.098–6.813) | .031 |
| Heart failure | 2.336 (0.701–7.784) | .167 | ||
| Coronary artery disease | 1.805 (0.823–3.955) | .140 | ||
| Chronic obstructive pulmonary disease | 2.430 (0.891–6.624) | .083 | ||
A p-value of less than .05 is considereds tatictically significant. Values in bold indicate statistically significant results. Multiple logistic regression analysis was conducted with stepwise variable selection method.
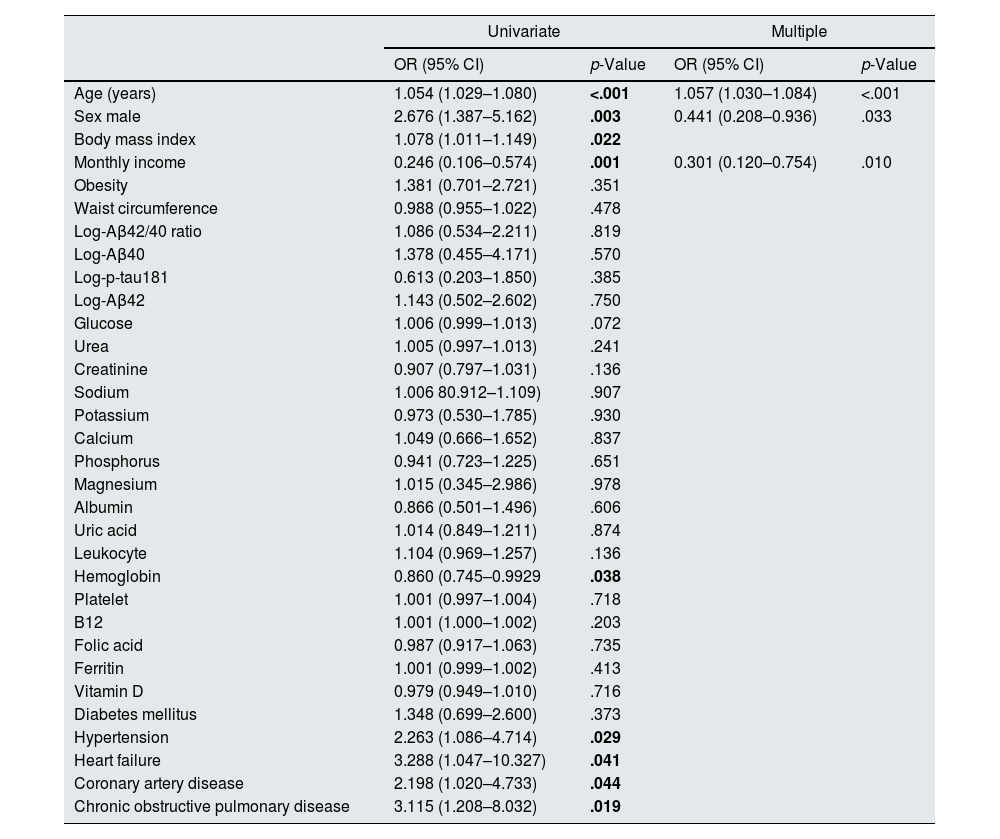
The relationship between the MoCA and the demographic and biochemical parameters of the patients is given in Table 4. While age, gender, body mass index (BMI), income, hemoglobin level, hypertension, congestive heart failure (CHF), coronary artery disease (CAD) and chronic obstructive pulmonary disease (COPD) were found as correlated with the MoCA in the univariate analysis, only increasing age, male gender and low income were found as the risk factors for the low MoCA in the multiple analysis (Table 4).
The relationship between MoCA and clinical and laboratory parameters.
| Univariate | Multiple | |||
|---|---|---|---|---|
| OR (95% CI) | p-Value | OR (95% CI) | p-Value | |
| Age (years) | 1.054 (1.029–1.080) | <.001 | 1.057 (1.030–1.084) | <.001 |
| Sex male | 2.676 (1.387–5.162) | .003 | 0.441 (0.208–0.936) | .033 |
| Body mass index | 1.078 (1.011–1.149) | .022 | ||
| Monthly income | 0.246 (0.106–0.574) | .001 | 0.301 (0.120–0.754) | .010 |
| Obesity | 1.381 (0.701–2.721) | .351 | ||
| Waist circumference | 0.988 (0.955–1.022) | .478 | ||
| Log-Aβ42/40 ratio | 1.086 (0.534–2.211) | .819 | ||
| Log-Aβ40 | 1.378 (0.455–4.171) | .570 | ||
| Log-p-tau181 | 0.613 (0.203–1.850) | .385 | ||
| Log-Aβ42 | 1.143 (0.502–2.602) | .750 | ||
| Glucose | 1.006 (0.999–1.013) | .072 | ||
| Urea | 1.005 (0.997–1.013) | .241 | ||
| Creatinine | 0.907 (0.797–1.031) | .136 | ||
| Sodium | 1.006 80.912–1.109) | .907 | ||
| Potassium | 0.973 (0.530–1.785) | .930 | ||
| Calcium | 1.049 (0.666–1.652) | .837 | ||
| Phosphorus | 0.941 (0.723–1.225) | .651 | ||
| Magnesium | 1.015 (0.345–2.986) | .978 | ||
| Albumin | 0.866 (0.501–1.496) | .606 | ||
| Uric acid | 1.014 (0.849–1.211) | .874 | ||
| Leukocyte | 1.104 (0.969–1.257) | .136 | ||
| Hemoglobin | 0.860 (0.745–0.9929 | .038 | ||
| Platelet | 1.001 (0.997–1.004) | .718 | ||
| B12 | 1.001 (1.000–1.002) | .203 | ||
| Folic acid | 0.987 (0.917–1.063) | .735 | ||
| Ferritin | 1.001 (0.999–1.002) | .413 | ||
| Vitamin D | 0.979 (0.949–1.010) | .716 | ||
| Diabetes mellitus | 1.348 (0.699–2.600) | .373 | ||
| Hypertension | 2.263 (1.086–4.714) | .029 | ||
| Heart failure | 3.288 (1.047–10.327) | .041 | ||
| Coronary artery disease | 2.198 (1.020–4.733) | .044 | ||
| Chronic obstructive pulmonary disease | 3.115 (1.208–8.032) | .019 | ||
A p-value of less than .05 is considereds tatictically significant. Values in bold indicate statistically significant results. Multiple logistic regression analysis was conducted with stepwise variable selection method.
The risk of CI increased in the patients with CKD as compared to those without CKD. The increase in renal function also leads to deterioration in cognitive function.16
In a meta-analysis that includes the studies evaluating cognitive functions in CKD patients, it was stated that the MoCA was used in 15 studies and the MMSE was used in 25 studies for cognitive assessment. In our study, we used these two tests for the assessment of cognitive function. CI was present in 58.3% (81/139) of CKD patients according to the MMSE and in 40.3% (56/139) according to the MoCA. The results of the studies on the frequency of CI in CKD patients are quite heterogeneous.16
Biomarkers related to loss of cognitive function and dementia have been identified in the last 20 years. Two of these play a key role, namely tau protein forming intracellular neurofibrillary glomus and Aβ forming extracellular senile plaques. In addition to Aβ and tau plaques, soluble oligomer forms are considered as the reason for toxicity. The loss of cognitive function in dementia was correlated with Aβ leading to mitochondrial damage and loss of synapses.17 This leads to oxidative stress and inflammation. Two dominant isoforms of Aβ are Aβ42 and Aβ40. Recently, it has been demonstrated that the effect of this Aβ on memory may arise even without tau.18 Furthermore, in the studies examining the relationship between Aβ42 or Aβ42/Aβ40 ratio and cognitive functions, the results are variable; while some of the studies found them as correlated, some of the studies found as non-correlated.19
Gronewold et al. showed in their study that the plasma Aβ level increased in renal failure and even this was positively correlated with the CKD stage.5 This shows that Aβ is excreted from kidneys. One year after this study, Gronewold et al. compared the cognitive functions with the total Aβ levels in 28 CKD patients and found that the subjects with high plasma Aβ levels showed significantly worse baseline cognitive performance than the subjects with low Aβ levels.20 Another possible mechanism is the decreased clearance of Aβ due to decreased Klotho levels in CKD patients. Zhao et al. showed that Aβ was significantly decreased in the brain and serum of mice with overexpression of Klotho.21 In 2024, Rodríguez-Ortiz et al. found that Klotho was decreased in mice that developed CKD with adenine, and that there was CI in mice with CKD. These results may support the possibility that CI may occur as a result of decreased AB clearance due to decreased Klotho levels in CKD.22 We found the Aβ42 level as significantly lower in the hemodialysis patients as compared to the early-stage CKD patients. The Aβ42 level was increasing from the control group towards the late-stage CKD patients, but this did not reach a significant level. Aβ40 level as significantly higher in the hemodialysis patients than the other groups. In addition, the Aβ40 level in the advanced CKD group was significantly higher than the early CKD patients and control groups. We found the Aβ40 level of the early-stage CKD and control groups as significantly higher in the hemodialysis patients than the other groups. Aβ40 level in the advanced CKD group was significantly higher than the early CKD patients and control groups (p<0.001). There was no significant difference between the Aβ40 levels of the early-stage CKD and control groups. In their study carried out with 16 predialysis CKD and 31 hemodialysis patients, Liu et al. found that the Aβ40 and Aβ42 levels increased as GFR decreased in the hemodialysis group, but were lower in the hemodialysis group. They considered that the clearance of Aβ by hemodialysis may lead to this result. We also found that the lowest Aβ 42 level in the hemodialysis group, but the highest Aβ40 level was in the hemodialysis group, and its level was increasing as CKD progressed. The blood samples were taken from our patients immediately before the dialysis session. In addition, we also had patients with residual urine in the hemodialysis group. These factors that will affect the clearance of Aβ may have caused the Aβ40 and Aβ42 levels to increase or decrease in different directions.
In the study which includes the relationship between comorbidities and neurodegenerative markers and cognitive loss-dementia, which had 996 participants and in which the participants of Mayo Clinic Study of Aging (MCSA) were included, there were 87 CKD patients, and 18 of these patients had MCI and dementia. MCI or dementia was found as correlated with higher Aβ42, Aβ40, p-tau and lower Aβ42/Aβ40 ratios in the patients with a history of CKD.23 In our study, there was a statistically significant relationship between the MMSE and Aβ40. There was a negative correlation between the MMSE and the Aβ42/40 ratio. In addition, MoCA was negatively correlated with the Aβ40 levels. We could not find a significant correlation between the MoCA and MMSE and Aβ42. In the relationship between the MMSE and the demographic and biochemical parameters of the patients, the relationship between increasing age, high Aβ level, low uric acid and vitamin D level, and presence of hypertension and the low MMSE score continued in multiple analysis. When the relationship between the MoCA and the demographic and biochemical parameters of the patients was examined, it was determined in the multiple analysis that only increasing age, male gender and low income were the risk factors for the low MoCA. In their study carried out on the normal elderly population, Hansson et al. found that only Aβ40 was predictive for dementia in the 5-year follow-up.24 On the other hand, there are limited number of studies which evaluate the Aβ levels and the loss of cognitive function in CKD patients. In the study in which Syafrita et al. included 60 hemodialysis patients, it was found that the Aβ42 level was similar in the patients with and without CI.25 On the contrary, Chen et al. found that the Aβ42/Aβ40 ratio and Aβ42 level were correlated with CI in the multicenter studies in which they include the patients undergoing hemodialysis.26 Many factors such as uremic toxins, chronic inflammation, oxidative stress, endothelial damage, and, unlike other causes of dementia, leading to brain hyperperfusion are known as the factors that trigger loss of cognitive function in CKD.27 The presence of many influencing factors make it more difficult to understand the development of CI in CKD. This may be the reason why the studies on CI loss in CKD had heterogeneous results.
Many factors such as high comorbidities, medications taken, sleep level, etc. in CKD patients may also have an effect on CI. At the same time, these multiple factors may affect the results in the studies examining the relationship between Aβ and CI in CKD patients.
We also found that hypertension and vitamin D deficiency were the risk factor for CI in CKD. The previous studies and meta-analyses also demonstrated that these two factors are the risk factors.
This study has certain restrictions. Its restrictions consist of the fact that the study was monocenter and that the number of the patients was relatively less.
Consequently, in our study, we found that there was a significant relationship between CI and the Aβ40 level in the CKD patients even after excluding confounding factors, that CI increased as the GFR stages progressed, that there was a significant negative correlation between the MMSE and MoCA tests and Aβ40, and that there was a significant positive correlation between the MMSE and the Aβ42/Aβ40 ratio. We consider that more studies are needed in order to determine CKD the relationship between CI, more clearly and to develop preventive and therapeutic treatments for this purpose.
FundingNo financial support was received.
Conflict of interestThe authors have declared that no conflict of interest exists.


