


To determine the healthcare resource utilization and costs in patients with chronic kidney disease (CKD) across the KDIGO stages in real-world clinical practice in Spain.
MethodsObservational, retrospective study using the BIG-PAC database. Adults with ≥1 measurement of estimated glomerular filtration rate (eGFR) and albuminuria closest to 1st January 2018 were included. Annual healthcare resource utilization and healthcare costs per patient were analyzed within a two-year follow-up period.
Results70,385 subjects were included, of whom 30.0% had CKD. The proportion of patients with ≥1 hospitalization ranged from 12.0% to 52.9% in categories G3a to G5 A1, from 6.0% to 47.4% in categories G1 to G5 A2 and from 13.5% to 69.8% in categories G1 to G5 A3. First year mean (SD) total cost ranged from 2486.65 (1724.25) to 16,085.75 (11,731.67), 1567.67 (1293.56) to 14,647.70 (11,031.45) and 2799.43 (1800.53) to 20,584.74 (11,563.63) Euros, respectively. Overall, the main driver for total cost was hospitalizations. All these numbers increased as eGFR declined or albuminuria increased and, in general, there was a slight decrease during the second year in all categories.
ConclusionsIn real-world, CKD may be associated with high healthcare resource utilization and costs that increase as renal function worsens or albuminuria levels increase. Reducing economic burden through primordial and primary prevention policies, and comprehensive management with kidney protective drugs should be a priority.
Determinar la utilización de recursos sanitarios y los costes en pacientes con enfermedad renal crónica (ERC) según los estadios KDIGO en la práctica clínica real en España.
MétodosEstudio observacional, retrospectivo, utilizando la base BIG-PAC. Se incluyeron adultos con medición ≥1 de la tasa de filtración glomerular estimada (TFGe) y albuminuria más próximas al 1/enero/2018. Se analizaron la utilización anual de recursos sanitarios y costes sanitarios por paciente durante dos años.
ResultadosSe incluyeron 70.385 sujetos, de los cuales el 30,0% tenía ERC. La proporción de pacientes con ≥1 hospitalización varió de 12,0% a 52,9% en las categorías G3a a G5 A1, de 6,0% a 47,4% en las categorías G1 a G5 A2 y de 13,5% a 69,8% en las categorías G1 a G5 A3. El coste total medio (DE) del primer año osciló entre 2486,65 (1724,25) y 16085,75 (11731,67), 1567,67 (1293,56) a 14647,70 (11031,45) y 2799,43 (1800,53) a 20584,74 (11563,63) euros, respectivamente. En general, el principal componente del coste total fueron las hospitalizaciones. Todas estas cifras aumentaron a medida que disminuía la TFGe o aumentó la albuminuria y, en general, hubo una ligera disminución durante el segundo año en todas las categorías.
ConclusionesEn vida real, la ERC puede estar asociada con una alta utilización de recursos sanitarios y costes que aumentan según empeora la función renal o la albuminuria. La reducción de la carga económica a través de políticas de prevención primordial y primaria, y el manejo integral con medicamentos protectores renales debe ser una prioridad.
Chronic kidney disease (CKD) is a public health problem.1 CKD markedly increases the risk of developing cardiovascular complications and reduces the quality of life.2 It has been estimated that CKD approximately affects 10–15% of the adult population, but in many cases, particularly in the early stages, CKD may be underdiagnosed, leading to a delay in the implementation of strategies that could slow the progression of CKD and associated complications.3,4
The impact of CKD on health care systems is known to be high, not only in terms of morbidity, but also due to the significant economic burden it imposes.5–9 As CKD progresses, it can lead to end-stage kidney disease (ESKD) requiring kidney replacement therapy (KRT) in the form of dialysis or kidney transplantation. The expenditures associated with KRT are very high in these advanced stages. Therefore, the economic burden of CKD has predominantly focused on ESKD and KRT-related costs.10–12
Although a great deal of attention has been paid to the economic repercussions of advanced CKD, there remains a paucity of evidence regarding the expenditures associated with the early stages of the disease and varying degrees of albuminuria. This gap in knowledge is concerning given the substantial burden that early-stage CKD poses on health care systems, which is considerably more prevalent than advanced CKD requiring KRT.13,14 Besides, non-ESKD is linked with a high risk of clinical events and healthcare resource utilization as kidney function worsens and albuminuria increases. Patients tend to have more hospital admissions, medication requirements, and a greater need for specialized care and ongoing monitoring. Thus, it is crucial to consider the expenditures related to non-ESKD CKD to accurately assess the economic impact of CKD on healthcare systems.15–17
In fact, a study conducted with patients from the US Department of Veterans Affairs (VA) health system revealed that stages 4 and 5 of CKD were associated with the highest costs per patient. However, the majority of the overall spending occurred in stages 3a and 3b due to their higher prevalence. As a limitation, this study only considered direct medical costs, potentially underestimating the full economic impact of CKD.14 Including indirect and social costs into future analyses can help to enhance the understanding of the actual financial burden of CKD, especially when designing public health policies focused on prevention and holistic chronic disease management.8,18
A detailed analysis using real world data (RWD) to quantify both the direct and indirect costs at each stage of CKD across the KDIGO categories is, therefore, highly needed to fully understand the actual economic burden of CKD.8,14 To identify the main components and drivers of expenditure in CKD in the real-word setting is mandatory to identify specific strategies to improve CKD management in clinical practice, and to reduce economic impact associated with CKD, specifically by addressing the gaps identified through local analyses.19–21 In this context, we performed a RWD-based study in a large population database in Spain, where healthcare resource utilization and costs were evaluated across every KDIGO stage over a two-year follow-up period. The baseline characteristics and clinical events of this cohort have been described.13
MethodsThis was an observational, retrospective, and RWD-based study using the BIG-PAC database. This is an administrative database located in Atrys Health which is representative of the Spanish population.8,13,22,23 Data were obtained from Collaboration Agreements with different Health Authorities in Autonomous Communities across the Spanish territory. A rigorous process of validation and recoding (anonymization and dissociation of the data) was carried out in origin. The data were then exported to BIG-PAC® database. The confidentiality of the records was always respected, as established by the Spanish law. Since the data was anonymized and dissociated from its origin, it was not possible to provide information on any Autonomous Community, field of action, territory, healthcare site (ambulatory/hospital), professional who performed the registration and/or identification of the patient. Atrys Health had no direct access to these registers. BIG-PAC® database contained all computerized data available in the national health care system of 1.8 million Spanish patients, regardless of when they were included: the complete medical history of each patient, with all the dates of medical visits, diagnoses, prescriptions, withdrawal of medication by the patient in the pharmacy, emergency visits, hospital admissions, etc., and was updated monthly. The study was approved by the Investigation Ethics Committee of Consorci Sanitari from Terrassa (Barcelona, Spain).
The study population included all individuals aged 18 years or older, with at least one measurement of both eGFR and Urine Albumin-Creatinine Ratio (UACR) in local laboratory tests within the 6 months closest to 1st January 2018 and separated by a maximum of 3 months. In addition, to be included, patients should have at least 12 months of continuous presence in the database prior to the qualifying eGFR. The index date was the date of the eGFR measure closest to 1st January 2018 meeting the criteria. Patients on dialysis (n=356) or who had undergone kidney transplant (n=232) prior to the index date were excluded from the study. The study population was staged according to KDIGO definitions based on eGFR (G1: eGFR ≥90mL/min/1.73m2; G2: eGFR 60–89mL/min/1.73m2: G3a: eGFR 45–59mL/min/1.73m2; G3b: eGFR 30–44mL/min/1.73m2; G4: eGFR 15–29mL/min/1.73m2; G5: eGFR<15mL/min/1.73m2) and UACR values (A1: <30mg/g; A2: ≥30 to <300mg/g; A3: ≥300mg/g).1 No exclusion criteria were applied.
Baseline characteristics, including demographics (age, sex), comorbidities (cardiovascular disease, coronary ischemic disease, heart failure, stroke, peripheral artery disease) and medications (renin–angiotensin–aldosterone system inhibitors [RAASi], including angiotensin-converting enzyme inhibitors [ACEi], angiotensin II receptor blockers [ARBs], mineralocorticoid receptor antagonists [MRAs], and angiotensin receptor-neprilysin inhibitors [ARNI]; and sodium-glucose cotransporter-2 inhibitors [SGLT2i] in persons with or without diabetes) were recorded across KDIGO categories at index date. The ICD-9 and ICD-10 codes were considered for the diagnosis of comorbidities (https://eciemaps.mscbs.gob.es) and the information about treatments was recorded from the registries for dispensing medicines, according to the Anatomical Therapeutic Chemical Classification System.24 Treatments were prescribed according to routine practice, according to the observational design of the study.
The annual health resource utilization and associated costs across KDIGO categories were calculated during the first and the second year of follow-up. The healthcare resource utilization and costs were summarized on a yearly basis starting from the index date. Annual healthcare resource utilization included primary care visits, specialized care visits, emergency room visits, laboratory tests, radiology and other tests, hospitalization (frequency and length of hospital stay), and number of drugs. Mortality and sickness absence were also collected from the information systems. Sickness absence data was collected from the information system as the number of days during which working-age patients (<65 years) did not work and the proportion of patients in each CKD stage who were absent from work due to illness.
Annual direct costs were calculated for healthcare (including costs derived from primary care visits, specialized care visits, emergency room visits, laboratory requests, radiology and other tests, hospitalization, and medications). Annual indirect costs were derived from sickness absences. Total cost was calculated as the sum of healthcare costs and indirect costs. Information on cost was obtained from the eSalud database and costs of prescriptions were based on the full price of drugs.25,26 Costs of work sickness absence were calculated by multiplying the number of days of absence from work due to illness by the mean daily salary of a worker in Spain27 (Supplementary Table 1) and used for the overall study period. Costs per patient were calculated for both years.
Statistical analysisAccording to the original design of the study, the results shown were descriptive.28 Categorical variables were defined by their absolute numbers (n) and proportions (%). The continuous variables were defined by the mean and standard deviation (SD) or median, as appropriate. All health resource use, as well as health care and indirect costs were presented per patient as mean (SD). The data were analyzed using the statistical package SPSS v25.0 (SPSS Inc., Chicago, Illinois, USA), while R (version 4.0.2; R Foundation for Statistical Computing, Vienna, Austria) was employed to generate all data visualizations.
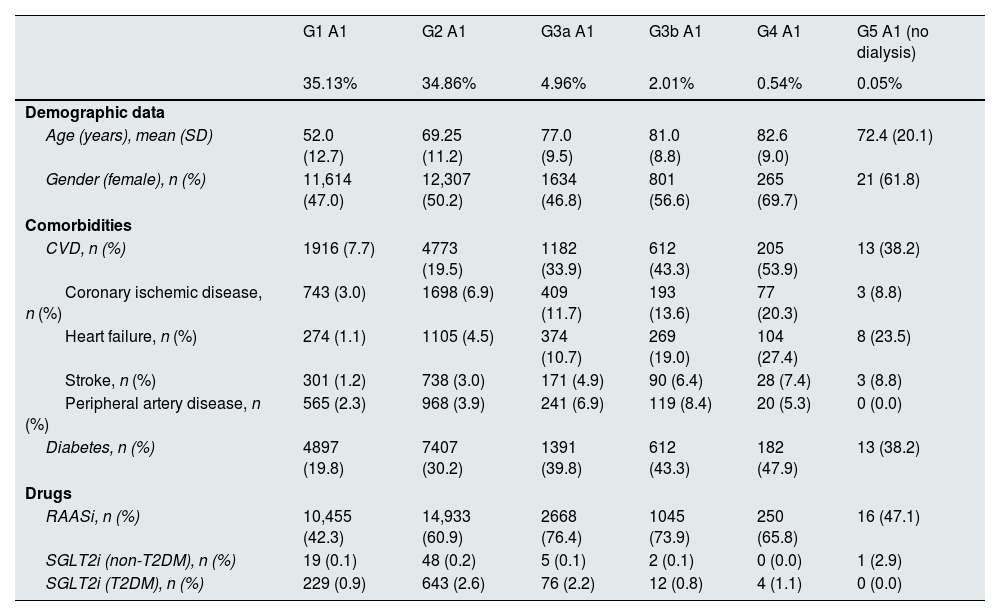
ResultsA total of 70,385 subjects were included in the study. Details of CKD stage distribution and basal characteristics have been described elsewhere.4,13 Briefly, 49,258 (70.0%) had normal albuminuria (A1) and kidney function (G1 or G2) and the remaining 21,127 (30.0%) had CKD by either kidney function or albuminuria criteria.5 Among CKD population, the mean (SD) age ranged from 72.4 (20.1) to 82.6 (9.0) years in categories G3a to G5 A1, from 56.6 (11.3) to 82.3 (10.1) years in categories G1 to G5 A2, and from 55.7 (11.2) to 77.1 (10.7) years in categories G1 to G5 A3. With respect to comorbidities, 38.2–47.9%, 31.6–53.9% and 55.8–69.5% of patients had diabetes mellitus, 8.8–20.3%, 4.4–18.4% and 6.3–19.4% coronary heart disease, and 10.7–27.4%, 3.1–31.4% and 3.4–32.6% heart failure, respectively. Regarding key treatments for CKD, RAASi were prescribed in 47.1–76.4%, 63.2–79.6%, and 51.2–85.9% of patients in G3a to G5 A1, G1 to G5 A2, and G1 to G5 A3 KDIGO categories, respectively, but the prescription of SGLT2i was marginal across all the KDIGO categories (Table 1, Supplementary Table 2).
Baseline characteristics by KDIGO risk category at index date, n=70,385 subjects.
| G1 A1 | G2 A1 | G3a A1 | G3b A1 | G4 A1 | G5 A1 (no dialysis) | |
|---|---|---|---|---|---|---|
| 35.13% | 34.86% | 4.96% | 2.01% | 0.54% | 0.05% | |
| Demographic data | ||||||
| Age (years), mean (SD) | 52.0 (12.7) | 69.25 (11.2) | 77.0 (9.5) | 81.0 (8.8) | 82.6 (9.0) | 72.4 (20.1) |
| Gender (female), n (%) | 11,614 (47.0) | 12,307 (50.2) | 1634 (46.8) | 801 (56.6) | 265 (69.7) | 21 (61.8) |
| Comorbidities | ||||||
| CVD, n (%) | 1916 (7.7) | 4773 (19.5) | 1182 (33.9) | 612 (43.3) | 205 (53.9) | 13 (38.2) |
| Coronary ischemic disease, n (%) | 743 (3.0) | 1698 (6.9) | 409 (11.7) | 193 (13.6) | 77 (20.3) | 3 (8.8) |
| Heart failure, n (%) | 274 (1.1) | 1105 (4.5) | 374 (10.7) | 269 (19.0) | 104 (27.4) | 8 (23.5) |
| Stroke, n (%) | 301 (1.2) | 738 (3.0) | 171 (4.9) | 90 (6.4) | 28 (7.4) | 3 (8.8) |
| Peripheral artery disease, n (%) | 565 (2.3) | 968 (3.9) | 241 (6.9) | 119 (8.4) | 20 (5.3) | 0 (0.0) |
| Diabetes, n (%) | 4897 (19.8) | 7407 (30.2) | 1391 (39.8) | 612 (43.3) | 182 (47.9) | 13 (38.2) |
| Drugs | ||||||
| RAASi, n (%) | 10,455 (42.3) | 14,933 (60.9) | 2668 (76.4) | 1045 (73.9) | 250 (65.8) | 16 (47.1) |
| SGLT2i (non-T2DM), n (%) | 19 (0.1) | 48 (0.2) | 5 (0.1) | 2 (0.1) | 0 (0.0) | 1 (2.9) |
| SGLT2i (T2DM), n (%) | 229 (0.9) | 643 (2.6) | 76 (2.2) | 12 (0.8) | 4 (1.1) | 0 (0.0) |
| G1 A2 | G2 A2 | G3a A2 | G3b A2 | G4 A2 | G5 A2 (no dialysis) | |
|---|---|---|---|---|---|---|
| 5.10% | 9.13% | 2.67% | 1.85% | 0.71% | 0.05% | |
| Demographic data | ||||||
| Age (years), mean (SD) | 56.6 (11.3) | 72.9 (10.8) | 77.8 (10.1) | 81.4 (9.2) | 82.3 (10.1) | 78.9 (16.1) |
| Gender (female), n (%) | 1654 (46.1) | 3346 (52.1) | 900 (47.9) | 691 (53.1) | 304 (61.2) | 22 (57.9) |
| Comorbidities | ||||||
| CVD, n (%) | 498 (13.9) | 1942 (30.2) | 815 (43.4) | 653 (50.2) | 277 (55.7) | 22 (57.9) |
| Coronary ischemic disease, n (%) | 158 (4.4) | 614 (9.6) | 256 (13.6) | 218 (16.7) | 85 (17.1) | 7 (18.4) |
| Heart failure, n (%) | 111 (3.1) | 603 (9.4) | 302 (16.1) | 282 (21.7) | 156 (31.4) | 8 (21.1) |
| Stroke, n (%) | 84 (2.3) | 306 (4.8) | 106 (5.6) | 98 (7.5) | 30 (6.0) | 3 (7.9) |
| Peripheral artery disease, n (%) | 133 (3.7) | 435 (6.8) | 196 (10.4) | 132 (10.1) | 56 (11.3) | 3 (7.9) |
| Diabetes, n (%) | 1617 (45.0) | 3152 (49.1) | 986 (52.5) | 680 (52.2) | 268 (53.9) | 12 (31.6) |
| Drugs | ||||||
| RAASi, n (%) | 2345 (65.3) | 4584 (71.4) | 1494 (79.6) | 949 (72.9) | 329 (66.2) | 24 (63.2) |
| SGLT2i (non-T2DM), n (%) | 12 (0.3) | 22 (0.3) | 7 (0.4) | 3 (0.2) | 3 (0.6) | 0 (0.0) |
| SGLT2i (T2DM), n (%) | 162 (4.5) | 213 (3.3) | 44 (2.3) | 13 (1.0) | 13 (2.6) | 1 (2.6) |
| G1 A3 | G2 A3 | G3a A3 | G3b A3 | G4 A3 | G5 A3 (no dialysis) | |
|---|---|---|---|---|---|---|
| 0.50% | 1.05% | 0.51% | 0.49% | 0.35% | 0.06% | |
| Demographic data | ||||||
| Age (years), mean (SD) | 55.7 (11.2) | 69.6 (12.6) | 73.8 (10.5) | 77.1 (10.7) | 76.6 (12.5) | 75.9 (13.8) |
| Gender (female), n (%) | 133 (38.1) | 287 (38.9) | 126 (34.9) | 148 (43.0) | 112 (45.5) | 16 (37.2) |
| Comorbidities | ||||||
| CVD, n (%) | 64 (18.3) | 275 (37.3) | 182 (50.4) | 178 (51.7) | 136 (55.3) | 26 (60.5) |
| Coronary ischemic disease, n (%) | 22 (6.3) | 89 (12.1) | 70 (19.4) | 57 (16.6) | 42 (17.1) | 8 (18.6) |
| Heart failure, n (%) | 12 (3.4) | 91 (12.3) | 69 (19.1) | 90 (26.2) | 68 (27.6) | 14 (32.6) |
| Stroke, n (%) | 10 (2.9) | 40 (5.4) | 25 (6.9) | 32 (9.3) | 28 (11.4) | 3 (7.0) |
| Peripheral artery disease, n (%) | 22 (6.3) | 75 (10.2) | 46 (12.7) | 45 (13.1) | 25 (10.2) | 7 (16.3) |
| Diabetes, n (%) | 199 (57.0) | 485 (65.8) | 224 (62.0) | 239 (69.5) | 141 (57.3) | 24 (55.8) |
| Drugs | ||||||
| RAASi, n (%) | 280 (80.2) | 626 (84.9) | 310 (85.9) | 290 (84.3) | 167 (67.9) | 22 (51.2) |
| SGLT2i (non-T2DM), n (%) | 2 (0.6) | 2 (0.3) | 4 (1.1) | 0 (0.0) | 0 (0.0) | 0 (0.0) |
| SGLT2i (T2DM), n (%) | 24 (6.9) | 33 (4.5) | 15 (4.2 | 6 (1.7) | 1 (0.4) | 0 (0.0) |
ACEi: angiotensin-converting enzyme inhibitors; ARB: angiotensin II receptor blockers; ARNI: angiotensin receptor-neprilysin inhibitor; CKD: chronic kidney disease; CVD: cardiovascular disease; eGFR: estimated glomerular filtration rate; HbA1c: glycated hemoglobin; KDIGO: Kidney Disease: Improving Global Outcomes; MRAs: mineralocorticoid receptor antagonists; RAASi: renin angiotensin aldosterone system inhibitors; SGLT2 i: sodium-glucose cotransporter-2 inhibitors; UACR: urine albumin–creatinine ratio. Index date: date of the eGFR measure closest to 1st January 2018.
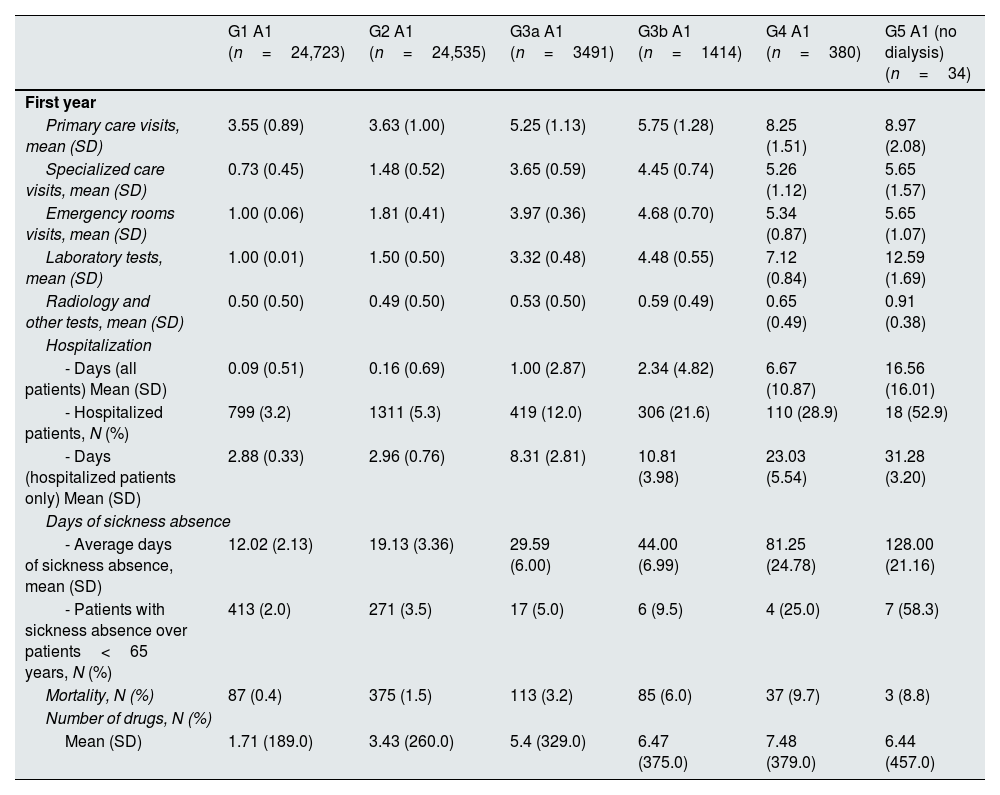
Annual healthcare resource utilization per patient by KDIGO risk category is presented in Table 2, Supplementary Table 3 and Supplementary Figs. 1–5. During the first year of inclusion, the mean (SD) number of primary care visits ranged from 5.25 (1.13) to 8.97 (2.08) in categories G3a to G5 A1, from 4.51 (1.10) to 10.47 (1.66) in categories G1 to G5 A2, and from 5.55 (1.40) to 12.12 (2.75) in categories G1 to G5 A3. The mean (SD) number of specialized care visits ranged from 3.65 (0.59) to 5.65 (1.57), from 1.72 (0.46), 6.45 (1.72) and from 3.87 (0.55) to 7.53 (1.68), respectively. Mean (SD) days of hospitalizations ranged from 1.00 (2.87) to 16.56 (16.01), from 0.18 (0.72) to 16.05 (17.47) and from 0.58 (1.60) to 25.77 (18.55), respectively. The proportion of patients with at least one hospitalization ranged from 12.0% to 52.9%, from 6% to 47.4% and from 13.5% to 69.8%, respectively. Among individuals <65 years, the proportion of patients with sickness absence ranged from 5.0% to 58.3%, from 4.3% to 50.0% and from 6.2% to 44.4%, respectively. The median number of drugs ranged from 5 to 7, from 3 to 8, and from 4 to 10, respectively. The proportion of patients who died within the first year ranged from 3.2% to 8.8%, from 0.8% to 13.2% and from 2.0% to 18.6%, respectively. These numbers increased as eGFR declined or albuminuria increased and, in general, there was a slight decrease during the second year.
Annual health resources use in 2018–2019 by KDIGO risk category.
| G1 A1 (n=24,723) | G2 A1 (n=24,535) | G3a A1 (n=3491) | G3b A1 (n=1414) | G4 A1 (n=380) | G5 A1 (no dialysis) (n=34) | |
|---|---|---|---|---|---|---|
| First year | ||||||
| Primary care visits, mean (SD) | 3.55 (0.89) | 3.63 (1.00) | 5.25 (1.13) | 5.75 (1.28) | 8.25 (1.51) | 8.97 (2.08) |
| Specialized care visits, mean (SD) | 0.73 (0.45) | 1.48 (0.52) | 3.65 (0.59) | 4.45 (0.74) | 5.26 (1.12) | 5.65 (1.57) |
| Emergency rooms visits, mean (SD) | 1.00 (0.06) | 1.81 (0.41) | 3.97 (0.36) | 4.68 (0.70) | 5.34 (0.87) | 5.65 (1.07) |
| Laboratory tests, mean (SD) | 1.00 (0.01) | 1.50 (0.50) | 3.32 (0.48) | 4.48 (0.55) | 7.12 (0.84) | 12.59 (1.69) |
| Radiology and other tests, mean (SD) | 0.50 (0.50) | 0.49 (0.50) | 0.53 (0.50) | 0.59 (0.49) | 0.65 (0.49) | 0.91 (0.38) |
| Hospitalization | ||||||
| - Days (all patients) Mean (SD) | 0.09 (0.51) | 0.16 (0.69) | 1.00 (2.87) | 2.34 (4.82) | 6.67 (10.87) | 16.56 (16.01) |
| - Hospitalized patients, N (%) | 799 (3.2) | 1311 (5.3) | 419 (12.0) | 306 (21.6) | 110 (28.9) | 18 (52.9) |
| - Days (hospitalized patients only) Mean (SD) | 2.88 (0.33) | 2.96 (0.76) | 8.31 (2.81) | 10.81 (3.98) | 23.03 (5.54) | 31.28 (3.20) |
| Days of sickness absence | ||||||
| - Average days of sickness absence, mean (SD) | 12.02 (2.13) | 19.13 (3.36) | 29.59 (6.00) | 44.00 (6.99) | 81.25 (24.78) | 128.00 (21.16) |
| - Patients with sickness absence over patients<65 years, N (%) | 413 (2.0) | 271 (3.5) | 17 (5.0) | 6 (9.5) | 4 (25.0) | 7 (58.3) |
| Mortality, N (%) | 87 (0.4) | 375 (1.5) | 113 (3.2) | 85 (6.0) | 37 (9.7) | 3 (8.8) |
| Number of drugs, N (%) | ||||||
| Mean (SD) | 1.71 (189.0) | 3.43 (260.0) | 5.4 (329.0) | 6.47 (375.0) | 7.48 (379.0) | 6.44 (457.0) |
| G1 A1 (n=24,636) | G2 A1 (n=24,160) | G3a A1 (n=3378) | G3b A1 (n=1329) | G4 A1 (n=343) | G5 A1 (no dialysis) (n=31) | |
|---|---|---|---|---|---|---|
| Second year | ||||||
| Primary care visits, mean (SD) | 3.54 (0.90) | 3.61 1.01) | 5.15 (1.26) | 5.58 (1.45) | 7.77 (2.14) | 8.32 (2.65) |
| Specialized care visits, mean (SD) | 0.73 (0.44) | 1.48 (0.52) | 3.58 (0.70) | 4.34 (0.90) | 4.99 (1.43) | 5.35 (1.91) |
| Emergency rooms visits, mean (SD) | 1.00 (0.04) | 1.82 (0.41) | 3.89 (0.55) | 4.56 (0.91) | 5.08 (1.33) | 5.26 (1.39) |
| Laboratory tests, mean (SD) | 1.00 (0.05) | 1.49 (0.51) | 3.25 (0.64) | 4.33 (0.89) | 6.68 (1.68) | 11.65 (3.18) |
| Radiology and other tests, mean (SD) | 0.50 (0.50) | 0.49 (0.50) | 0.56 (0.50) | 0.56 (0.50) | 0.59 (0.49) | 0.94 (0.35) |
| Hospitalization | ||||||
| - Days (all patients) mean (SD) | 0.09 (0.51) | 0.15 (0.65) | 0.99 (2.85) | 2.25 (4.61) | 5.90 (10.22) | 15.26 (15.53) |
| - Hospitalized patients, N (%) | 795 (3.2) | 1276 (5.3) | 406 (12.0) | 288 (21.7) | 97 (28.3) | 17 (54.8) |
| - Days (hospitalized patients only) mean (SD) | 2.87 (0.34) | 2.91 (0.30) | 8.20 (2.86) | 10.40 (3.63) | 20.88 (7.49) | 27.82 (8.98) |
| Days of sickness absence | ||||||
| - Average days of sickness absence | 6.29 (1.08) | 9.76 (1.77) | 14.82 (2.92) | 22.33 (3.56) | 40.75 (12.55) | 64.43 (10.52) |
| - Patients with sickness absence over patients<65 years, N (%) | 412 (2.0) | 271 (3.5) | 17 (5.0) | 6 (9.5) | 4 (25.0) | 7 (58.3) |
| Mortality, N (%) | 87 (0.4) | 398 (1.6) | 152 (4.5) | 94 (7.1) | 44 (12.8) | 6 (19.4) |
| Number of drugs, N (%) | ||||||
| mean (SD) | 1.72 (188.0) | 3.43 (259.0) | 5.33 (324.0) | 6.45 (380.0) | 7.51 (380.0) | 6.87 (429.0) |
| G1 A2 (n=3590) | G2 A2 (n=6423) | G3a A2 (n=1878) | G3b A2 (n=1302) | G4 A2 (n=497) | G5 A2 (no dialysis) (n=38) | |
|---|---|---|---|---|---|---|
| First year | ||||||
| Primary care visits, mean (SD) | 4.51 (1.10) | 4.63 (1.24) | 6.27 (1.34) | 6.90 (1.50) | 9.43 (1.77) | 10.47 (1.66) |
| Specialized care visits, mean (SD) | 1.72 (0.46) | 2.54 (0.56) | 4.40 (0.65) | 5.30 (0.85) | 6.00 (1.24) | 6.45 (1.72) |
| Emergency rooms visits, mean (SD) | 1.99 (0.14) | 2.96 (0.32) | 3.97 (0.39) | 5.77 (0.75) | 6.16 (1.09) | 6.37 (1.48) |
| Laboratory tests, mean (SD) | 1.82 (0.38) | 2.85 (0.36) | 4.55 (0.52) | 6.08 (0.69) | 9.53 (1.01) | 15.11 (2.42) |
| Radiology and other tests, mean (SD) | 0.49 (0.50) | 0.50 (0.50) | 0.54 (0.50) | 0.64 (0.49) | 0.64 (0.49) | 1.05 (0.46) |
| Hospitalization | ||||||
| - Days (all patients) mean (SD) | 0.18 (0.72) | 0.27 (1.03) | 1.35 (3.54) | 3.11 (5.51) | 10.47 (16.92) | 16.05 (17.47) |
| - Hospitalized patients, N (%) | 216 (6.0) | 459 (7.1) | 276 (14.7) | 343 (26.3) | 189 (38.0) | 18 (47.4) |
| - Days (hospitalized patients only) mean (SD) | 3.00 (0.41) | 3.75 (1.38) | 9.18 (3.63) | 11.81 (3.54) | 27.54 (16.81) | 33.89 (4.95) |
| Days of sickness absence | ||||||
| - Average days of sickness absence, mean (SD) | 23.75 (4.26) | 27.71 (4.43) | 44.82 (8.96) | 72.89 (10.01) | 106.57 (12.38) | 132.00 (51.47) |
| - Patients with sickness absence over patients<65 years, N (%) | 114 (4.3) | 66 (4.7) | 11 (5.7) | 9 (14.5) | 7 (22.6) | 3 (50.0) |
| Mortality, N (%) | 28 (0.8) | 200 (3.1) | 92 (4.9) | 91 (7.0) | 70 (14.1) | 5 (13.2) |
| Number of drugs, N (%) | ||||||
| Mean (SD) | 3.41 (262.0) | 4.73 (308.0) | 6.53 (367.0) | 7.5 (408.0) | 8.17 (432.0) | 7.05 (482.0) |
| G1 A2 (n=3562) | G2 A2 (n=6223) | G3a A2 (n=1786) | G3b A2 (n=1211) | G4 A2 (n=427) | G5 A2 (no dialysis) (n=33) | |
|---|---|---|---|---|---|---|
| Second year | ||||||
| Primary care visits, mean (SD) | 4.49 (1.10) | 4.56 (1.32) | 6.08 (1.59) | 6.57 (1.88) | 8.69 (2.75) | 9.48 (3.14) |
| Specialized care visits, mean (SD) | 1.72 (0.46) | 2.51 (0.60) | 4.27 (0.90) | 5.05 (1.24) | 5.50 (1.73) | 5.85 (2.00) |
| Emergency rooms visits, mean (SD) | 1.99 (0.14) | 2.93 (0.41) | 3.85 (0.66) | 5.55 (1.26) | 5.71 (1.65) | 5.70 (1.74) |
| Laboratory tests, mean (SD) | 1.82 (0.39) | 2.79 (0.51) | 4.38 (0.90) | 5.77 (1.33) | 8.68 (2.51) | 13.48 (4.34) |
| Radiology and other tests, mean (SD) | 0.50 (0.50) | 0.47 (0.50) | 0.61 (0.57) | 0.59 (0.49) | 0.61 (0.49) | 0.87 (0.58) |
| Hospitalization | ||||||
| - Days (all patients) mean (SD) | 0.18 (0.71) | 0.26 (0.99) | 1.28 (3.30) | 2.98 (5.36) | 8.99 (12.33) | 13.21 (16.59) |
| - Hospitalized patients, N (%) | 213 (6.0) | 445 (7.2) | 264 (14.8) | 318 (26.3) | 166 (38.9) | 14 (42.4) |
| - Days (hospitalized patients only) mean (SD) | 2.98 (0.38) | 3.66 (1.18) | 8.64 (3.21) | 11.36 (3.78) | 23.12 (7.98) | 31.14 (8.74) |
| Days of sickness absence | ||||||
| - Average days of sickness absence, mean (SD) | 12.10 (2.17) | 14.15 (2.24) | 22.27 (4.56) | 36.67 (4.95) | 51.00 (10.91) | 48.33 (11.93) |
| - Patients with sickness absence over patients <65 years, N (%) | 114 (4.3) | 65 (4.7) | 11 (5.7) | 9 (14.5) | 7 (22.6) | 3 (50.0) |
| Mortality, N (%) | 28 (0.8) | 234 (3.8) | 108 (6.0) | 128 (10.6) | 65 (15.2) | 6 (18.2) |
| Number of drugs, N (%) | ||||||
| Mean (SD) | 3.44 (263.0) | 4.73 (308.0) | 6.5 (367.0) | 7.53 (411.0) | 8.24 (428.0) | 7.36 (441.0) |
| G1 A3 (n=349) | G2 A3 (n=737) | G3a A3 (n=361) | G3b A3 (n=344) | G4 A3 (n=246) | G5 A3 (no dialysis) (n=43) | |
|---|---|---|---|---|---|---|
| First year | ||||||
| Primary care visits, mean (SD) | 5.55 (1.40) | 5.59 (1.59) | 7.40 (1.63) | 7.74 (1.85) | 10.75 (2.21) | 12.12 (2.75) |
| Specialized care visits, mean (SD) | 3.87 (0.55) | 4.18 (0.69) | 5.12 (0.80) | 6.04 (1.18) | 6.80 (1.43) | 7.53 (1.68) |
| Emergency rooms visits, mean (SD) | 3.97 (0.31) | 3.97 (0.39) | 5.35 (0.75) | 5.94 (1.01) | 6.72 (1.23) | 7.19 (1.28) |
| Laboratory tests, mean (SD) | 3.26 (0.45) | 4.54 (0.53) | 6.47 (0.57) | 7.98 (0.77) | 12.28 (1.51) | 18.07 (2.22) |
| Radiology and other tests, mean (SD) | 0.55 (0.50) | 0.55 (0.50) | 0.58 (0.49) | 0.62 (0.49) | 0.71 (0.50) | 1.12 (0.54) |
| Hospitalization | ||||||
| - Days (all patients) mean (SD) | 0.58 (1.60) | 0.74 (1.82) | 1.82 (3.89) | 4.44 (6.33) | 13.38 (14.58) | 25.77 (18.55) |
| - Hospitalized patients, N (%) | 47 (13.5%) | 114 (15.5%) | 72 (19.9%) | 124 (36.0%) | 118 (48.0%) | 30 (69.8%) |
| - Days (hospitalized patients only) mean (SD) | 4.32 (1.68) | 4.77 (1.45) | 9.14 (2.98) | 12.33 (3.72) | 27.90 (6.06) | 36.93 (8.49) |
| Days of sickness absence | ||||||
| - Average days of sickness absence, mean (SD) | 34.35 (6.45) | 56.21 (9.09) | 68.40 (13.83) | 94.00 (11.06) | 129.50 (21.71) | 198.50 (52.04) |
| - Patients with sickness absence over patients<65 years, N (%) | 17 (6.2) | 29 (12.3) | 10 (15.2) | 6 (12.2) | 10 (23.8) | 4 (44.4) |
| Mortality, N (%) | 7 (2.0) | 32 (4.3) | 20 (5.5) | 30 (8.7) | 42 (17.1) | 8 (18.6) |
| Number of drugs, N (%) | ||||||
| mean (SD) | 4.79 (322.0) | 6.34 (358.0) | 7.94 (431.0) | 9.19 (442.0) | 10.62 (519.0) | 10.49 (523.0) |
| G1 A3 (n=342) | G2 A3 (n=705) | G3a A3 (n=341) | G3b A3 (n=314) | G4 A3 (n=204) | G5 A3 (no dialysis) (n=35) | |
|---|---|---|---|---|---|---|
| Second year | ||||||
| Primary care visits, mean (SD) | 5.54 (1.39) | 5.50 (1.66) | 7.15 (1.83) | 7.34 (2.09) | 10.02 (2.77) | 11.17 (4.19) |
| Specialized care visits, mean (SD) | 3.86 (0.56) | 4.14 (0.81) | 5.00 (1.00) | 5.82 (1.36) | 6.37 (1.63) | 7.03 (2.53) |
| Emergency rooms visits, mean (SD) | 3.97 (0.33) | 3.91 (0.54) | 5.22 (1.00) | 5.66 (1.15) | 6.34 (1.47) | 6.49 (2.36) |
| Laboratory tests, mean (SD) | 3.24 (0.52) | 4.44 (0.79) | 6.26 (1.08) | 7.55 (1.65) | 11.39 (2.76) | 16.14 (5.70) |
| Radiology and other tests, mean (SD) | 0.55 (0.50) | 0.51 (0.50) | 0.56 (0.51) | 0.65 (0.48) | 0.66 (0.48) | 0.81 (0.59) |
| Hospitalization | ||||||
| - Days (all patients) mean (SD) | 0.55 (1.48) | 0.74 (1.82) | 1.74 (3.78) | 4.23 (6.14) | 13.22 (14.16) | 21.49 (17.69) |
| - Hospitalized patients, N (%) | 45 (13.2) | 109 (15.5) | 68 (19.9) | 114 (36.3) | 103 (50.5) | 25 (71.4) |
| - Days (hospitalized patients only) mean (SD) | 4.18 (1.25) | 4.78 (1.48) | 8.72 (3.29) | 11.66 (4.12) | 26.17 (7.51) | 30.08 (13.20) |
| Days of sickness absence | ||||||
| - Average days of sickness absence, mean (SD) | 17.56 (3.27) | 28.31 (4.58) | 34.40 (6.93) | 47.33 (5.47) | 65.00 (10.73) | 99.50 (26.24) |
| - Patients with sickness absence over patients<65 years, N (%) | 16 (5.8) | 29 (12.3) | 10 (15.2) | 6 (12.2) | 10 (23.8) | 4 (44.4) |
| Mortality, N (%) | 6 (1.8) | 31 (4.4) | 28 (8.2) | 34 (10.8) | 26 (12.7) | 6 (17.1) |
| Number of drugs, N (%) | ||||||
| Mean (SD) | 4.78 (328.0) | 6.29 (363.0) | 7.87 (426.0) | 9.22 (441.0) | 10.52 (524.0) | 10 (524.0) |
Index date: date of the eGFR measure closest to 1st January 2018.
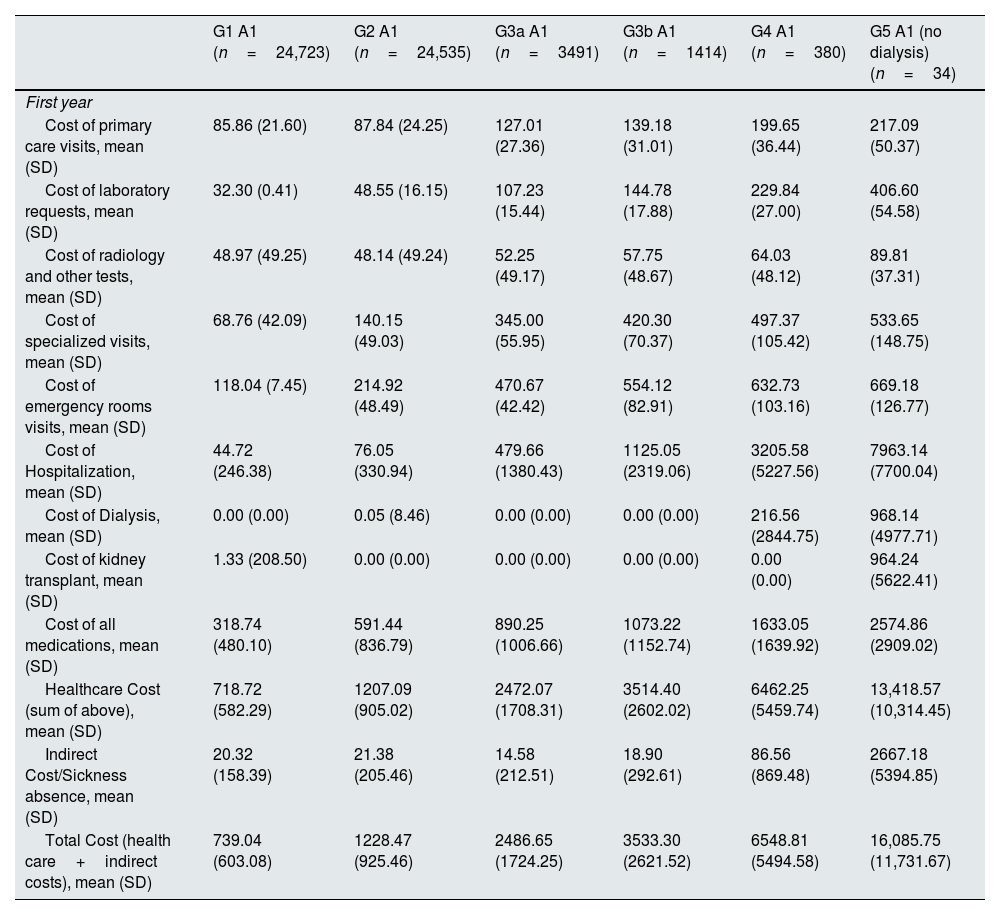
Annual costs, as mean (SD) per patient in 2018–2019 by KDIGO risk category, are presented in Table 3, Supplementary Table 4, and supplementary Figs. 1, 2, 5 and 6. Within the first year, healthcare cost ranged from 2472.07 (1708.31) to 13,418.57 (10,314.45) Euros in categories G3a to G5 A1, from 1491.33 (1220.51) to 13,592.99 (9969.30) Euros in categories G1 to G5 A2, and from 2630.07 (1657.09) to 18,715.89 (9334.04) Euros in categories G1 to G5 A3. Indirect cost due to sickness absence ranged from 14.58 (212.51) to 2667.18 (5394.85) Euros, from 76.34 (428.52) to 1054.71 (3846.53) Euros and from 169.36 (762.48) to 1868.85 (6070.04) Euros, respectively. Thus, total cost (healthcare+indirect costs) ranged from 2486.65 (1724.25) to 16,085.75 (11,731.67) Euros, from 1567.67 (1293.56) to 14,647.70 (11,031.45) and from 2799.43 (1800.53) to 20,584.74 (11,563.63) Euros, respectively. These figures increased as eGFR declined or albuminuria increased (Figs. 1 and 2). Whereas in G1 and G2 categories the main components for total cost were pharmacy, followed by emergency room visits, in G3a category, these were pharmacy and hospitalizations, in G3b, pharmacy and hospitalizations accounted for similar costs and in G4-G5, the main drivers for total cost were hospitalizations, followed by medications. These trends were consistent, regardless of albuminuria levels (Fig. 2). Costs were slightly lower in the second year, remaining consistent with those of the first year. These differences were more pronounced in patients with advanced stages of albuminuria, which may be attributed to the fact that those individuals with more severe disease and higher resource utilization might have died during the first year (Table 3 and Supplementary Table 4).
Annual cost in 2018–2019 by KDIGO risk category.
| G1 A1 (n=24,723) | G2 A1 (n=24,535) | G3a A1 (n=3491) | G3b A1 (n=1414) | G4 A1 (n=380) | G5 A1 (no dialysis) (n=34) | |
|---|---|---|---|---|---|---|
| First year | ||||||
| Cost of primary care visits, mean (SD) | 85.86 (21.60) | 87.84 (24.25) | 127.01 (27.36) | 139.18 (31.01) | 199.65 (36.44) | 217.09 (50.37) |
| Cost of laboratory requests, mean (SD) | 32.30 (0.41) | 48.55 (16.15) | 107.23 (15.44) | 144.78 (17.88) | 229.84 (27.00) | 406.60 (54.58) |
| Cost of radiology and other tests, mean (SD) | 48.97 (49.25) | 48.14 (49.24) | 52.25 (49.17) | 57.75 (48.67) | 64.03 (48.12) | 89.81 (37.31) |
| Cost of specialized visits, mean (SD) | 68.76 (42.09) | 140.15 (49.03) | 345.00 (55.95) | 420.30 (70.37) | 497.37 (105.42) | 533.65 (148.75) |
| Cost of emergency rooms visits, mean (SD) | 118.04 (7.45) | 214.92 (48.49) | 470.67 (42.42) | 554.12 (82.91) | 632.73 (103.16) | 669.18 (126.77) |
| Cost of Hospitalization, mean (SD) | 44.72 (246.38) | 76.05 (330.94) | 479.66 (1380.43) | 1125.05 (2319.06) | 3205.58 (5227.56) | 7963.14 (7700.04) |
| Cost of Dialysis, mean (SD) | 0.00 (0.00) | 0.05 (8.46) | 0.00 (0.00) | 0.00 (0.00) | 216.56 (2844.75) | 968.14 (4977.71) |
| Cost of kidney transplant, mean (SD) | 1.33 (208.50) | 0.00 (0.00) | 0.00 (0.00) | 0.00 (0.00) | 0.00 (0.00) | 964.24 (5622.41) |
| Cost of all medications, mean (SD) | 318.74 (480.10) | 591.44 (836.79) | 890.25 (1006.66) | 1073.22 (1152.74) | 1633.05 (1639.92) | 2574.86 (2909.02) |
| Healthcare Cost (sum of above), mean (SD) | 718.72 (582.29) | 1207.09 (905.02) | 2472.07 (1708.31) | 3514.40 (2602.02) | 6462.25 (5459.74) | 13,418.57 (10,314.45) |
| Indirect Cost/Sickness absence, mean (SD) | 20.32 (158.39) | 21.38 (205.46) | 14.58 (212.51) | 18.90 (292.61) | 86.56 (869.48) | 2667.18 (5394.85) |
| Total Cost (health care+indirect costs), mean (SD) | 739.04 (603.08) | 1228.47 (925.46) | 2486.65 (1724.25) | 3533.30 (2621.52) | 6548.81 (5494.58) | 16,085.75 (11,731.67) |
| G1 A1 (n=24,636) | G2 A1 (n=24,160) | G3a A1 (n=3378) | G3b A1 (n=1329) | G4 A1 (n=343) | G5 A1 (no dialysis) (n=31) | |
|---|---|---|---|---|---|---|
| Second year | ||||||
| Cost of primary care visits, mean (SD) | 85.75 (21.70) | 87.45 (24.51) | 124.73 (30.41) | 135.06 (35.20) | 188.03 (51.80) | 201.41 (64.15) |
| Cost of laboratory requests, mean (SD) | 32.24 (1.48) | 48.16 (16.59) | 104.84 (20.80) | 139.87 (28.61) | 215.84 (54.29) | 376.14 (102.67) |
| Cost of radiology and other tests, mean (SD) | 49.06 (49.25) | 48.32 (49.24) | 55.05 (49.70) | 55.49 (48.87) | 57.85 (48.56) | 92.53 (34.29) |
| Cost of specialized visits, mean (SD) | 68.84 (42.04) | 140.08 (48.78) | 338.39 (65.90) | 410.28 (85.49) | 471.67 (134.90) | 506.03 (180.21) |
| Cost of emergency rooms visits, mean (SD) | 118.27 (5.28) | 215.36 (48.24) | 461.51 (65.71) | 540.87 (108.37) | 601.83 (157.07) | 623.08 (164.68) |
| Cost of Hospitalization, mean (SD) | 44.60 (246.01) | 73.93 (314.87) | 474.07 (1368.41) | 1083.38 (2214.76) | 2839.13 (4913.59) | 7337.60 (7467.61) |
| Cost of Dialysis, mean (SD) | 0.00 (0.00) | 0.06 (8.55) | 0.00 (0.00) | 0.00 (0.00) | 189.47 (2634.90) | 1133.83 (5596.03) |
| Cost of kidney transplant, mean (SD) | 1.33 (208.87) | 0.00 (0.00) | 0.00 (0.00) | 0.00 (0.00) | 0.00 (0.00) | 0.00 (0.00) |
| Cost of all medications, mean (SD) | 318.23 (478.88) | 591.27 (838.85) | 879.78 (999.54) | 1062.42 (1124.33) | 1649.46 (1693.10) | 2346.80 (2524.83) |
| Healthcare Cost (sum of above), mean (SD) | 718.32 (582.47) | 1204.57 (904.38) | 2438.37 (1719.09) | 3427.37 (2569.76) | 6023.81 (5352.46) | 11,483.59 (7253.29) |
| Indirect Cost/Sickness absence, mean (SD) | 10.64 (82.80) | 11.08 (105.75) | 7.55 (108.11) | 10.20 (153.19) | 48.10 (459.11) | 1472.44 (2812.09) |
| Total Cost (health care+indirect costs), mean (SD) | 728.96 (588.19) | 1215.65 (909.17) | 2445.92 (1723.66) | 3437.57 (2576.29) | 6071.91 (5355.88) | 12,956.03 (8223.12) |
| G1 A2 (n=3590) | G2 A2 (n=6423) | G3a A2 (n=1878) | G3b A2 (n=1302) | G4 A2 (n=497) | G5 A2 (no dialysis) (n=38) | |
|---|---|---|---|---|---|---|
| First year | ||||||
| Cost of primary care visits, mean (SD) | 109.06 (26.51) | 111.98 (29.99) | 151.62 (32.31) | 166.93 (36.28) | 228.32 (42.81) | 253.46 (40.08) |
| Cost of laboratory requests, mean (SD) | 58.90 (12.31) | 92.05 (11.58) | 146.83 (16.80) | 196.48 (22.28) | 307.86 (32.55) | 487.90 (78.33) |
| Cost of radiology and other tests, mean (SD) | 48.32 (49.25) | 49.04 (49.25) | 53.66 (49.07) | 62.56 (47.90) | 63.22 (48.50) | 103.68 (45.50) |
| Cost of specialized visits, mean (SD) | 162.44 (43.47) | 240.26 (53.32) | 415.49 (61.05) | 500.95 (80.33) | 566.62 (117.44) | 609.28 (162.49) |
| Cost of emergency rooms visits, mean (SD) | 235.65 (16.85) | 350.26 (37.33) | 470.91 (45.75) | 683.88 (88.63) | 730.07 (129.36) | 754.66 (175.16) |
| Cost of Hospitalization, mean (SD) | 86.67 (346.05) | 128.78 (497.08) | 648.88 (1700.61) | 1496.26 (2650.51) | 5037.35 (8137.00) | 7719.71 (8402.61) |
| Cost of Dialysis, mean (SD) | 0.00 (0.00) | 1.85 (148.02) | 2.57 (111.41) | 39.41 (1046.90) | 238.38 (2509.44) | 1100.53 (5273.17) |
| Cost of kidney transplant, mean (SD) | 0.00 (0.00) | 0.00 (0.00) | 0.00 (0.00) | 0.00 (0.00) | 263.86 (2932.22) | 862.74 (5318.27) |
| Cost of all medications, mean (SD) | 790.29 (1170.03) | 902.27 (1134.63) | 1341.91 (1507.91) | 1493.68 (1426.46) | 2165.45 (2099.83) | 2801.56 (2964.34) |
| Healthcare Cost (sum of above), mean (SD) | 1491.33 (1220.51) | 1874.64 (1252.87) | 3229.30 (2264.31) | 4600.74 (3032.99) | 9362.75 (8682.47) | 13,592.99 (9969.30) |
| Indirect Cost/Sickness absence, mean (SD) | 76.34 (428.52) | 28.82 (286.45) | 26.57 (352.51) | 50.99 (616.59) | 151.92 (1279.75) | 1054.71 (3846.53) |
| Total Cost (health care+indirect costs), mean (SD) | 1567.67 (1293.56) | 1903.46 (1288.03) | 3255.87 (2316.23) | 4651.73 (3111.55) | 9514.67 (8909.70) | 14,647.70 (11,031.45) |
| G1 A2 (n=3562) | G2 A2 (n=6223) | G3a A2 (n=1786) | G3b A2 (n=1211) | G4 A2 (n=427) | G5 A2 (no dialysis) (n=33) | |
|---|---|---|---|---|---|---|
| Second year | ||||||
| Cost of primary care visits, mean (SD) | 108.68 (26.72) | 110.26 (31.97) | 147.11 (38.59) | 159.09 (45.42) | 210.26 (66.61) | 229.53 (76.08) |
| Cost of laboratory requests, mean (SD) | 58.70 (12.74) | 90.21 (16.35) | 141.46 (29.18) | 186.39 (42.82) | 280.41 (81.06) | 435.56 (140.12) |
| Cost of radiology and other tests, mean (SD) | 49.30 (49.26) | 46.01 (49.15) | 60.39 (55.94) | 57.86 (48.51) | 59.62 (48.20) | 85.54 (56.89) |
| Cost of specialized visits, mean (SD) | 162.39 (43.39) | 237.09 (56.49) | 403.13 (84.72) | 477.18 (117.39) | 520.08 (163.60) | 552.68 (189.18) |
| Cost of emergency rooms visits, mean (SD) | 235.67 (16.80) | 346.95 (48.46) | 456.35 (78.65) | 657.67 (149.03) | 676.87 (195.68) | 675.09 (206.28) |
| Cost of Hospitalization, mean (SD) | 85.60 (342.39) | 125.73 (477.78) | 613.91 (1589.36) | 1434.36 (2578.14) | 4322.47 (5928.52) | 6353.71 (7980.04) |
| Cost of Dialysis, mean (SD) | 0.00 (0.00) | 1.91 (150.54) | 0.00 (0.00) | 42.82 (1095.78) | 278.44 (2715.49) | 1149.60 (5406.87) |
| Cost of kidney transplant, mean (SD) | 0.00 (0.00) | 10.54 (587.68) | 0.00 (0.00) | 0.00 (0.00) | 76.78 (1586.53) | 0.00 (0.00) |
| Cost of all medications, mean (SD) | 791.28 (1172.45) | 896.34 (1129.04) | 1328.00 (1523.19) | 1488.44 (1449.30) | 2143.64 (2148.61) | 2861.68 (2954.87) |
| Healthcare Cost (sum of above), mean (SD) | 1491.62 (1225.41) | 1863.13 (1383.03) | 3150.35 (2243.38) | 4460.99 (3104.28) | 8290.13 (6757.58) | 11,193.79 (9590.99) |
| Indirect Cost/Sickness absence, mean (SD) | 39.18 (219.03) | 14.96 (147.45) | 13.88 (179.77) | 27.58 (321.45) | 84.62 (669.17) | 444.71 (1459.66) |
| Total Cost (health care+indirect costs), mean (SD) | 1530.80 (1244.49) | 1878.09 (1392.51) | 3164.23 (2262.76) | 4488.57 (3130.78) | 8374.75 (6831.82) | 11,638.50 (9732.02) |
| G1 A3 (n=349) | G2 A3 (n=737) | G3a A3 (n=361) | G3b A3 (n=344) | G4 A3 (n=246) | G5 A3 (no dialysis) (n=43) | |
|---|---|---|---|---|---|---|
| First year | ||||||
| Cost of primary care visits, mean (SD) | 134.24 (33.94) | 135.28 (38.39) | 179.05 (39.41) | 187.41 (44.88) | 260.20 (53.42) | 293.21 (66.63) |
| Cost of laboratory requests, mean (SD) | 105.32 (14.62) | 146.56 (17.14) | 209.10 (18.49) | 257.74 (24.96) | 396.53 (48.71) | 583.65 (71.67) |
| Cost of radiology and other tests, mean (SD) | 54.47 (49.04) | 54.66 (48.98) | 57.30 (48.66) | 60.70 (47.97) | 69.67 (49.12) | 109.95 (53.56) |
| Cost of specialized visits, mean (SD) | 366.09 (52.27) | 395.18 (65.50) | 484.02 (75.97) | 571.12 (111.13) | 642.68 (135.44) | 712.05 (158.87) |
| Cost of emergency rooms visits, mean (SD) | 470.94 (36.36) | 470.14 (46.48) | 634.52 (88.90) | 704.11 (119.50) | 796.74 (146.25) | 851.55 (151.35) |
| Cost of Hospitalization, mean (SD) | 279.72 (768.59) | 354.97 (874.26) | 876.54 (1869.86) | 2137.49 (3045.79) | 6435.46 (7011.31) | 12,391.56 (8922.97) |
| Cost of Dialysis, mean (SD) | 63.89 (1193.50) | 12.92 (297.39) | 94.75 (1800.17) | 264.65 (2862.43) | 1337.51 (5991.78) | 1931.57 (7096.63) |
| Cost of kidney transplant, mean (SD) | 0.00 (0.00) | 0.00 (0.00) | 0.00 (0.00) | 95.30 (1767.59) | 533.07 (4154.79) | 0.00 (0.00) |
| Cost of all medications, mean (SD) | 1219.29 (1565.46) | 1436.93 (1602.79) | 2034.91 (1988.10) | 2294.22 (2229.30) | 2696.56 (2300.70) | 3773.92 (2601.75) |
| Healthcare Cost (sum of above), mean (SD) | 2630.07 (1657.09) | 2993.72 (1839.15) | 4475.44 (2868.30) | 6308.09 (4101.85) | 11,830.91 (8714.28) | 18,715.89 (9334.04) |
| Indirect Cost/Sickness absence, mean (SD) | 169.36 (762.48) | 223.84 (1121.23) | 191.77 (1159.04) | 165.94 (1254.57) | 532.79 (2627.55) | 1868.85 (6070.04) |
| Total Cost (health care+indirect costs), mean (SD) | 2799.43 (1800.53) | 3217.56 (2143.52) | 4667.21 (3175.29) | 6474.03 (4326.26) | 12,363.70 (9177.45) | 20,584.74 (11,563.63) |
| G1 A3 (n=342) | G2 A3 (n=705) | G3a A3 (n=341) | G3b A3 (n=314) | G4 A3 (n=204) | G5 A3 (no dialysis) (n=35) | |
|---|---|---|---|---|---|---|
| Second year | ||||||
| Cost of primary care visits, mean (SD) | 133.95 (33.64) | 132.98 (40.13) | 172.95 (44.21) | 177.57 (50.52) | 242.59 (66.98) | 270.35 (101.40) |
| Cost of laboratory requests, mean (SD) | 104.74 (16.67) | 143.54 (25.59) | 202.04 (34.98) | 243.79 (53.41) | 367.97 (89.04) | 521.41 (184.25) |
| Cost of radiology and other tests, mean (SD) | 53.91 (49.10) | 50.12 (49.28) | 55.12 (50.59) | 63.57 (47.19) | 64.58 (46.90) | 79.74 (58.53) |
| Cost of specialized visits, mean (SD) | 365.01 (53.32) | 391.54 (76.10) | 472.50 (94.78) | 549.54 (128.34) | 602.21 (154.37) | 664.20 (238.72) |
| Cost of emergency rooms visits, mean (SD) | 470.19 (38.85) | 462.91 (63.45) | 618.56 (118.24) | 670.24 (136.42) | 751.08 (174.39) | 768.56 (279.20) |
| Cost of Hospitalization, mean (SD) | 264.35 (713.51) | 355.39 (877.12) | 836.29 (1819.24) | 2035.40 (2951.48) | 6355.42 (6808.86) | 10,332.48 (8509.09) |
| Cost of Dialysis, mean (SD) | 64.39 (1190.72) | 4.09 (76.88) | 94.33 (1741.99) | 253.21 (2953.52) | 1630.58 (6717.91) | 2271.93 (7467.92) |
| Cost of kidney transplant, mean (SD) | 0.00 (0.00) | 0.00 (0.00) | 0.00 (0.00) | 0.00 (0.00) | 482.12 (3956.01) | 936.69 (5541.51) |
| Cost of all medications, mean (SD) | 1229.51 (1598.58) | 1435.64 (1623.25) | 1991.33 (1918.12) | 2323.84 (2323.69) | 2708.83 (2299.61) | 3712.37 (2652.50) |
| Healthcare Cost (sum of above), mean (SD) | 2621.66 (1678.15) | 2972.12 (1874.88) | 4348.79 (2836.25) | 6063.95 (3862.21) | 11,574.80 (8492.18) | 17,285.80 (12,554.10) |
| Indirect Cost/Sickness absence, mean (SD) | 83.16 (382.25) | 117.86 (576.92) | 102.10 (599.24) | 91.54 (660.62) | 322.48 (1442.12) | 1150.90 (3345.08) |
| Total Cost (health care+indirect costs), mean (SD) | 2704.82 (1709.78) | 3089.98 (1957.51) | 4450.89 (2951.65) | 6155.49 (3945.70) | 11,897.28 (8806.86) | 18,436.70 (13366.39) |
 of all medications, hospitalization, and sum of both within the first year of follow-up. eGFR: estimated glomerular filtration rate; G5noD: G5 no dialysis.")
 and proportional (%) annual healthcare costs by components across eGFR and albuminuria categories within the first year of follow-up. eGFR: estimated glomerular filtration rate; G5noD: G5 no dialysis.")
This study showed in a wide sample of patients with CKD that annual healthcare resource utilization per patient was high, particularly from primary care and hospital specialists visits, hospitalization rates, and drugs consumption. In addition, in individuals<65 years, the proportion of patients with sickness absence reached 50% in advanced CKD stages. This may be associated with high healthcare and indirect costs. On the other hand, annual healthcare resource utilization and costs markedly increased as renal function worsened, or albuminuria levels increased. As renal function declined, the main component for total cost moved from pharmacy and emergency room visits (G1–2) to hospitalizations and polypharmacy (G4–5), regardless of albuminuria levels. Remarkably, since the information from patients without CKD in the same healthcare area was also recorded, we could assess the real impact of CKD on annual healthcare resource utilization and costs per patient. Notably, the patterns observed remained consistent in both the first and second year of follow-up.
In our study, more than 70,000 subjects were included, of whom around 30% had CKD.4 This number was quite higher than the prevalence previously reported in some Spanish registries in the last years,3,29 but it is in line with other international reports.14,30 Methodological differences may account for this disparity, as the present study focused on individuals seeking healthcare, in contrast to population-based studies that assess the real prevalence in the general population.31
The clinical profile (age and comorbidities, particularly cardiovascular conditions) markedly changed across KDIGO categories. It was observed that as age increased, albuminuria increased and GFR decreased. In addition, there were marked differences in the clinical profile of our study with that of the clinical trials that included patients with CKD, such as the DAPA-CKD, EMPA-KIDNEY and FIDELITY studies.32–34 This emphasizes the importance of RWD studies in extending the findings of clinical trials to the broader population of patients with CKD in routine practice. In addition, in contrast to other studies that analyzed the impact of CKD on healthcare resource utilization and costs, according to renal function or albuminuria,35 we specifically described them across all the KDIGO categories, including both eGFR and UACR. As ESKD on kidney replacement treatment, either dialysis or kidney transplant may be associated with high healthcare resource utilization and costs by themselves, we excluded these patients at index date to determine the impact of kidney function and albuminuria on health care resource utilization and costs across KDIGO categories.
In our study, the mean number of primary care and specialized visits ranged from 4.5 to 12.1 and from 1.7 to 7.5 across KDIGO categories, respectively, within the first year of inclusion, with similar numbers during the second year of follow-up. Only through a multidisciplinary approach, ensuring an appropriate continuity of care between different healthcare levels, can the management of CKD and comorbidities be optimized, improving clinical outcomes and limiting gaps and redundancies in the approach to the CKD population.36
On the other hand, the proportion of patients with at least one hospitalization ranged from 6% to 70%, and the mean number of days of hospitalization ranged from 1 to 26 across the KDIGO categories. Moreover, the proportion of patients who died within the first year ranged from 1% to 19%. This is in line with previous studies that have shown that CKD is associated with a high risk of hospitalization and mortality not only due to the development of cardiovascular complications but also related to the progression of CKD.6,7,35,37 This emphasizes the importance of the early initiation of those drugs with demonstrated renal and cardiovascular disease protection to slow kidney disease progression and to reduce cardiovascular burden. Although these drugs were mostly limited to RAASi,38 in the last years the paradigm of treatment of CKD has completely changed with the inclusion of new drugs, particularly SGLT2i in patients with CKD, regardless of the diabetes status, and more recently, finerenone, a nonsteroidal mineralocorticoid receptor antagonist, and subcutaneous semaglutide, a GLP1 receptor agonist, among patients with type 2 diabetes and CKD with albuminuria.31,39
As a result, since healthcare resource utilization increases in line with CKD progression, these findings call for an urgent need for improved awareness and risk management across all the KDIGO categories, including early CKD screening, to mitigate the CKD burden.6,7,35 In fact, the conclusions of a recent KDIGO conference underscore that, in light of the benefits of nephroprotective strategies, priority should be given to approaches, including pharmacological ones, that promote a transition from managing existing CKD to maintaining kidney health.40 In our study, at baseline, the prescription of RAASi ranged from 42% to 86%, increasing as kidney failure worsened or albuminuria levels increased, but the use of SGLT2i was marginal, across all the KDIGO categories. In addition, the median number of drugs ranged from 4 to 10, indicating the high prevalence of other comorbidities within this population. Although it is true that in our study baseline data were collected in 2018 and the first approvals for the CKD indication were obtained for dapagliflozin and empagliflozin in 2021 and 2023, respectively, based on the DAPA-CKD and EMPA-KIDNEY trials,32,33 the fact is that the SGLT2i prescription is still low nowadays.41 Furthermore, different studies have confirmed a low adherence to KDIGO CKD guidelines.42 Therefore, there is still much room for improvement in the management of CKD in clinical practice.
Overall, annual total costs per patient ranged from around 1567 to 20,600 Euros, increasing as eGFR declined or albuminuria increased. Of note, costs observed in the second year were slightly lower but remained consistent with those recorded in the first year. This modest decrease is plausibly explained by the mortality among the most severe patients during the first year, who typically incur higher healthcare resource utilization. As a result, the surviving population in the second year might have had a lower overall burden of disease, leading to reduced average costs. In a recent study performed in the United States, total 2019 spending among CKD population reached US$ billions 14.7 (12.9 Euros), with an annual growth rate between 2010 and 2019 of 5.2%.18 In line with our data, previous studies have shown a marked increase of healthcare cost with the progression of CKD stages 1–2 to CKD stage 3 and from CKD stage 3 to 5.5,43,44 For example, in the UK, the mean annual per-patient costs ranged from £4966 [5892 Euros] (A1) to £9196 [10,911 Euros] (A3) and from £4997 [5929 Euros] (G2) to £7595 [9011 Euros] (G5).5 These data highlight the need to identify and treat CKD in the early stages of disease to avoid progression to more advanced stages, where the economic burden of disease markedly increases. Enhancement of both primordial and primary prevention policies, as well as proper use of nephroprotective drugs, are required to achieve these objectives. Early detection of risk, early intervention and better control of several CKD-contributing conditions, including hypertension, diabetes, and obesity are necessary. It will also require re-thinking chronic disease management models and shifting from reactive to proactive, patient-centered approaches, particularly in the context of multimorbidity among patients with CKD.
Previous studies have shown that in the overall CKD population the main determinant for healthcare costs in patients with CKD came from hospitalizations, in particular due to cardiovascular conditions.8 However, our study provided more detailed information, indicating that while overall hospitalizations remain the main driver for total cost, the contributors of costs changed across the KDIGO categories, suggesting that more targeted actions could be implemented according to the CKD stage. For example, although great efforts have been focused on KRT to reduce healthcare costs,31,45 the fact is that the prevention of the development of cardiovascular and renal complications through a comprehensive and multidisciplinary approach, including the early implementation of renal protective drugs across all the KDIGO categories, is the best way to reduce economic burden related to CKD.8,46 Indeed, a recent systematic review showed that adding dapagliflozin to the treatment of patients with CKD is cost-effective from both the healthcare system and the payer's perspective by slowing CKD progression and preventing kidney failure events.47 This is particularly important, since the economic burden of CKD is projected to increase in the following years and KRT may contribute disproportionately to this burden. Thus, it is expected that CKD will represent the 5.56% of total Spanish public health expenditure by 2027, compared to 4.88% in 2022, of which 42.5% will be directly related to KRT.48
In our study, not only direct healthcare costs were analyzed, but also indirect costs through sickness absence. Of note, among individuals<65 years, the proportion of patients with sickness absence ranged from 4% to 58% across all the KDIGO categories, and indirect costs ranged from 15 to 2667 Euros. Not many studies have focused on analyzing the impact of CKD on loss of productivity. However, the fact is that renal dysfunction is directly associated with a reduction in labor force and an increase in precarious unemployment.49 Not only medical factors should then be considered, but also psychological and social circumstances. Establishing preventive measures may be useful not only to delay the development of renal and cardiovascular complications and survival, but also to increase productive life years.50
In our study, we examined the healthcare resource utilization and costs of CKD across all the KDIGO categories in a large comprehensive dataset of patients. Despite that, this study has some limitations, mainly related to the use of electronic health records data for secondary purposes. First, it is likely that data from some private centers may not be included. However, in Spain, the great majority of patients are attended in the public health care system, and the BIG-PAC database accounted for data of almost all the population of 7 Spanish regions. Second, the use of routinely collected electronic health records data may be subject to data quality issues, as some variables could be missing. However, this retrospective design is one of the best approaches to reflect RWD and the great number of patients included could mitigate this potential bias. Third, indirect costs were estimated using work absences; however, variables like early retirement and premature mortality were not available to be evaluated. Fourth, advanced CKD was observed as age increased. Since advanced age is linked to outcomes beyond those directly related to CKD, this may contribute to increased healthcare resource utilization and costs. Being this a descriptive study, these associations were not specifically examined. Fifth, since eGFR was measured only once in this study, other cases of acute kidney failure could not be excluded. However, the number of such patients is expected to be low. Sixth, our findings apply only to populations with similar clinical profiles and health care systems to those in Spain.
In conclusion, CKD may be associated with high healthcare resource utilization and costs that increase as renal function worsens or albuminuria levels increase. Although the main contributors change across the KDIGO categories, hospitalizations represent the main determinant. The best way to reduce the economic burden related to CKD is through the effective implementation of primordial and primary prevention strategies targeting CKD risk factors, as well as early initiation of those treatments with proven cardiovascular and renal protective properties to slow kidney disease progression and cardiovascular hospitalizations.
Conflict of interestsUnai Aranda, Beatriz Palacios, Margarita Capel are AstraZeneca employees; Ignacio Hernández is an Atrys employee. Rafael Santamaría reports lecture fees from AstraZeneca, Boehringer-Ingelheim, Vifor CSL, Bayer; and advisory fees from AstraZeneca and Bayer. None related to this manuscript. Carlos Escobar has received honoraria from Almirall, Esteve, Amgen, Bayer, Boehringer, Sanofi, MSD, Mylan, Servier, Ferrer, Daiichi-Sankyo, Novartis, Pfizer, Viatris, as speaker or advisor. None related to this manuscript. Ana Cebrián declares funding to conduct clinical trials MSD and Sanofi (all to the IMIB institute); consulting fees from AstraZeneca, Bayer, Eli Lilly, MSD, Novo Nordisk and Sanofi; payment of honoraria for lectures from AstraZeneca, Bayer, Boehringer-Ingelheim, Eli Lilly, Menarini, MSD, Sanofi and Novo Nordisk. Roberto Alcázar reports lecture fees from AstraZeneca, Boehringer-Ingelheim, Vifor CSL, Bayer, Rubio and Fresenius Medical Care; and advisory fees from AstraZeneca and Bayer. None related to this manuscript. Manuel Gorostidi reports lecture fees from AstraZeneca, and Servier, and advisory fees from Fresenius Medical Care, Boehringer-Ingelheim, and AstraZeneca (none related to the present article). This study was sponsored and financed by AstraZeneca. The rest of the authors do not have conflicts of interest.
The followings are the supplementary data to this article:


