

Diabetes mellitus is the leading cause of end-stage renal disease, accounting for approximately 40% of cases. Data on glycaemic metrics in diabetic population on maintenance haemodialysis is sparse. The role of continuous glucose monitoring in this population remains underexplored.
MethodsThis prospective observational study aimed to comprehensively characterize glycaemic variability using continuous glucose monitoring in patients with type 2 diabetes mellitus undergoing maintenance haemodialysis. 25 patients aged between 18 and 70 years with more than 3 months of dialysis vintage were included in the study. After collecting socio-demographic and clinical data, an ambulatory glucose profile sensor was applied to the patient's upper limb before starting their scheduled dialysis session. Sensors measured the interstitial fluid glucose every 15min, and a total of 96 readings were taken per day, continuously for 14 days (336h).
ResultsFor statistical analysis, the study population was broadly divided into 2 major groups, one which required insulin for their glycaemic management and the other requiring an oral hypoglycaemic agent, linagliptin. Statistical analysis was performed using SPSS software version 26.0 (IBM Corp., Armonk, NY). In both the groups, glycaemic excursion was observed, with dialysis days having high mean glucose values than non-dialysis days, and the observation was more prominent in the insulin-treated group. The mean glucose levels were lower in the nocturnal period in both the groups. It was noticed that the overall glycaemic variability, glycaemic variability in both dialysis and non-dialysis days were lower in linagliptin-treated group.
ConclusionThis study demonstrated significant differences in glycaemic variability based on antidiabetic treatment modality in haemodialysis population. Continuous glucose monitoring is an invaluable tool to study glycaemic metrics and guide therapy in haemodialysis population.
La diabetes mellitus es la principal causa de enfermedad renal en etapa terminal, representando aproximadamente el 40% de los casos. Los datos sobre métricas glucémicas en la población diabética en hemodiálisis de mantenimiento son escasos. El papel del monitoreo continuo de glucosa en esta población sigue siendo poco explorado.
MétodosEste estudio observacional prospectivo tuvo como objetivo caracterizar de manera integral la variabilidad glucémica utilizando monitoreo continuo de glucosa en pacientes con diabetes mellitus tipo 2 que se someten a hemodiálisis de mantenimiento. Se incluyeron 25 pacientes con edades entre 18 y 70 años, con más de 3 meses de experiencia en diálisis. Después de recolectar datos sociodemográficos y clínicos, se aplicó un sensor de perfil glucémico ambulatorio en la extremidad superior del paciente antes de iniciar su sesión de diálisis programada. Los sensores midieron la glucosa del líquido intersticial cada 15 minutos, y se tomaron un total de 96 lecturas por día, de manera continua durante 14 días (336 h).
ResultadosPara el análisis estadístico, la población del estudio se dividió ampliamente en 2 grupos principales, uno que requería insulina para el control de su glucemia y el otro que requería un agente hipoglucemiante oral, linagliptina. El análisis estadístico se realizó utilizando el software SPSS versión 26.0 (IBM Corp., Armonk, NY). En ambos grupos se observó variación glucémica, siendo los días de diálisis aquellos con valores medios de glucosa más altos que los días sin diálisis, y la observación fue más prominente en el grupo tratado con insulina. Los niveles medios de glucosa fueron más bajos durante el período nocturno en ambos grupos. Se notó que la variabilidad glucémica general, así como la variabilidad glucémica tanto en días de diálisis como en días sin diálisis, fue menor en el grupo tratado con linagliptina.
ConclusiónEste estudio demostró diferencias significativas en la variabilidad glucémica según la modalidad de tratamiento antidiabético en la población en hemodiálisis. El monitoreo continuo de glucosa es una herramienta invaluable para estudiar las métricas glucémicas y guiar la terapia en la población en hemodiálisis.
Diabetes mellitus and chronic kidney disease (CKD) represent a challenging clinical intersection with significant morbidity and mortality implications. Approximately 40% of patients with end-stage renal disease (ESRD) have diabetes as a primary aetiology, creating complex glycaemic management challenges that intensify when patients progress to maintenance haemodialysis (MHD).1,2
Traditional glycaemic monitoring methodologies demonstrate significant limitations in the haemodialysis (HD) population. Haemoglobin A1c (HbA1c), the standard glycaemic control marker, exhibits reduced reliability in ESRD due to altered red blood cell lifespan, low haemoglobin and uraemic toxins.3,4 Evidence on utility of continuous glucose monitoring (CGM) in diabetic management in dialysis and post-renal transplant patients is limited.5–7
Furthermore, self-monitoring of blood glucose (SMBG) provides only intermittent measurements, potentially missing critical glycaemic excursions that occur during haemodialysis sessions. These limitations underscore the necessity for more comprehensive monitoring strategies that can elucidate the unique glycaemic patterns in this population. CGM is a great innovation to manage glucose levels in such patients. Literature is sparse on the usage of CGM in MHD patients.8,9
MethodologyThis prospective observational study aims to comprehensively characterize glycaemic variability in patients with type 2 diabetes mellitus undergoing MHD using CGM. The study was performed in SRM Medical College Hospital and Research Centre and was approved by Institutional Ethical Committee (SRMIEC-ST0923-1472). The sample size was calculated using Cochran's formula: n=Z2×p×(1−p)/d2, where Z is the standard normal variate (1.96 at 5% type 1 error), p is the expected proportion in the population, and d is the absolute error. Based on previous studies, we considered the prevalence of significant glycaemic variability in haemodialysis patients with type 2 diabetes mellitus. Mirani et al. (2010) reported significant glycaemic variability in 80% of their study population in 10 insulin-treated patients on haemodialysis.10 Similarly, Jung et al. (2010) observed pronounced glycaemic fluctuations in 75% of their cohort of 20 haemodialysis patients with type 2 diabetes.11 Using a conservative estimate of p=0.75, with an absolute precision of 15% and 95% confidence level, the minimum required sample size was calculated as 24.5, rounded up to 25 participants. Stable MHD patients aged between 18 and 70 years with more than 3 months dialysis vintage, with adequate kt/V and target haemoglobin above 10.5g/dl were included in the study. Type 1 diabetes mellitus patients, candidates on peritoneal dialysis, acute on CKD cases requiring HD, patients with erratic glucose measurements, patients in intensive care units, patients in sepsis and pregnant females were excluded.
Data collection procedureA predefined proforma was used to collect the socio-demographic characteristics. Detailed clinical history was taken and a thorough clinical examination was done in all study participants. Ambulatory Glucose Profile (AGP) sensor (Abbott's Freestyle Libre™) was applied to the patient's non-AVF upper limb just before starting their scheduled HD session. Waterproof adhesive tape was applied over the sensor. Participants were allowed to perform their regular activities without any limitations. Sensors measured the interstitial fluid glucose every 15min, a total of 96 readings were taken per day, continuously for 14 days (336h). After 14 days, results were pooled by the reader and analyzed. The used sensor was discarded as per institutional biomedical waste management protocol. The anti-diabetic medications were not modified during the study period. We used 100mg/dl (5.55mmol/L) glucose containing dialysate for all participants and for all HD sessions.
‘Dialysis day’ was defined as 24h from the start of the dialysis session. A non-dialysis day was defined as an interval between termination of dialysis day and initiation of next dialysis session. The nocturnal time period was defined as a period of 6h from 00:00 midnight to 06:00am. HD sessions had a standard time frame of 4h. We defined ‘early period’ as the initial 2h of the session and ‘late period’ as the concluding two hours of the session in the standard 4-h HD session. As per American Diabetes Association (ADA) guidelines, we defined hypoglycaemia as <55mg/dl, normoglycaemia as 56–199mg/dl and hyperglycaemia as >200mg/dl. The study population was broadly divided into 2 major groups, one which required insulin for their glycaemic management and the other requiring an oral hypoglycaemic agent (OHA), linagliptin.
Statistical analysisStatistical analysis was performed using SPSS software version 26.0 (IBM Corp., Armonk, NY). Continuous variables were expressed as mean±standard deviation, and categorical variables as frequencies and percentages. Comparison of demographic and clinical characteristics between insulin and OHA groups was performed using independent t-tests for continuous variables and chi-square tests for categorical variables.
For within-group comparisons (dialysis vs. non-dialysis days, diurnal vs. nocturnal periods, early vs. late intradialytic periods), paired t-tests were applied. Between-group comparisons of glycaemic parameters and variability metrics were conducted using independent t-tests. Glycaemic variability was assessed using standard deviation (SD), coefficient of variation (CV), and time in various glycaemic ranges (hypoglycaemia, normoglycaemia and hyperglycaemia). A p-value of <0.05 was considered statistically significant.
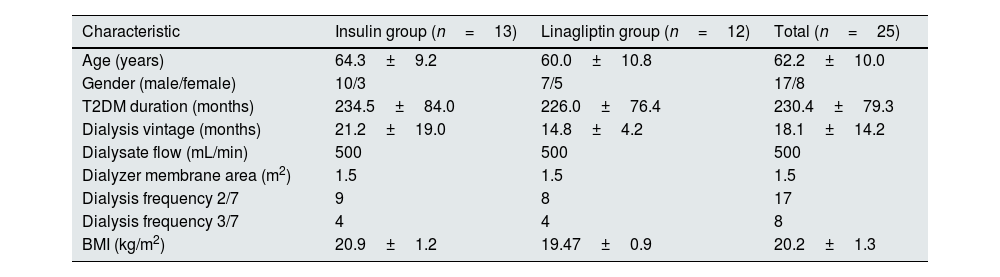
ResultsThe study included 25 patients, of whom 68% (n=17) were males and 32% (n=8) were females. The mean age of the study participants was 62.2±10 years. The mean duration of diabetes was 230.4±79.3 months. The average dialysis vintage of the study population was 18.1±14.2 months. The baseline characteristics of the study population are described in Table 1.
Demographic and clinical characteristics stratified by antidiabetic treatment modality.
| Characteristic | Insulin group (n=13) | Linagliptin group (n=12) | Total (n=25) |
|---|---|---|---|
| Age (years) | 64.3±9.2 | 60.0±10.8 | 62.2±10.0 |
| Gender (male/female) | 10/3 | 7/5 | 17/8 |
| T2DM duration (months) | 234.5±84.0 | 226.0±76.4 | 230.4±79.3 |
| Dialysis vintage (months) | 21.2±19.0 | 14.8±4.2 | 18.1±14.2 |
| Dialysate flow (mL/min) | 500 | 500 | 500 |
| Dialyzer membrane area (m2) | 1.5 | 1.5 | 1.5 |
| Dialysis frequency 2/7 | 9 | 8 | 17 |
| Dialysis frequency 3/7 | 4 | 4 | 8 |
| BMI (kg/m2) | 20.9±1.2 | 19.47±0.9 | 20.2±1.3 |
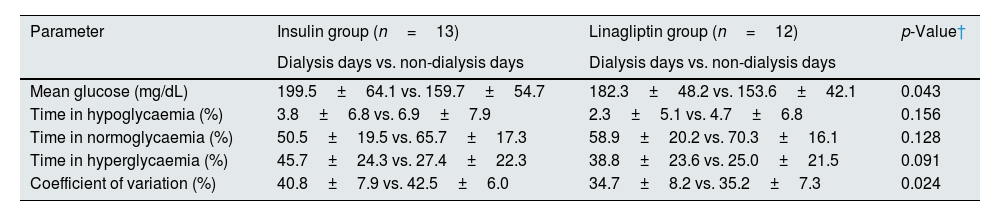
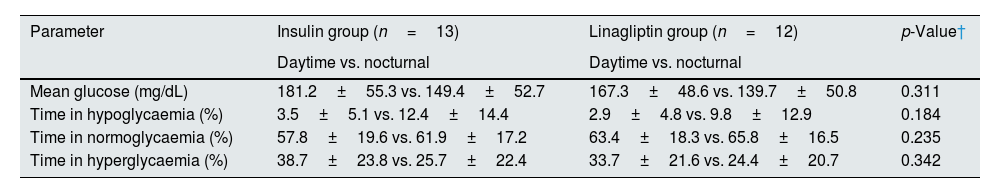
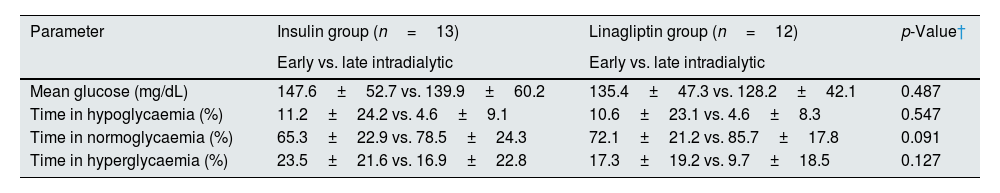
For statistical analysis, the study population was divided into insulin-treated (n=13) and OHA (linagliptin)-treated (n=12) groups. In both the groups, glycaemic excursions were observed, with dialysis days having high mean glucose values than non-HD days, and the observation was more prominent in the insulin-treated group (Table 2). The mean glucose levels were lower in the nocturnal period in both the groups (Table 3). Both the treatment groups had lower mean glucose levels in late intradialytic period (Table 4).
Comparison of glycaemic parameters between dialysis and non-dialysis days stratified by treatment modality.
| Parameter | Insulin group (n=13) | Linagliptin group (n=12) | p-Value† |
|---|---|---|---|
| Dialysis days vs. non-dialysis days | Dialysis days vs. non-dialysis days | ||
| Mean glucose (mg/dL) | 199.5±64.1 vs. 159.7±54.7 | 182.3±48.2 vs. 153.6±42.1 | 0.043 |
| Time in hypoglycaemia (%) | 3.8±6.8 vs. 6.9±7.9 | 2.3±5.1 vs. 4.7±6.8 | 0.156 |
| Time in normoglycaemia (%) | 50.5±19.5 vs. 65.7±17.3 | 58.9±20.2 vs. 70.3±16.1 | 0.128 |
| Time in hyperglycaemia (%) | 45.7±24.3 vs. 27.4±22.3 | 38.8±23.6 vs. 25.0±21.5 | 0.091 |
| Coefficient of variation (%) | 40.8±7.9 vs. 42.5±6.0 | 34.7±8.2 vs. 35.2±7.3 | 0.024 |
Comparison of glycaemic parameters between daytime and nocturnal periods stratified by treatment modality.
| Parameter | Insulin group (n=13) | Linagliptin group (n=12) | p-Value† |
|---|---|---|---|
| Daytime vs. nocturnal | Daytime vs. nocturnal | ||
| Mean glucose (mg/dL) | 181.2±55.3 vs. 149.4±52.7 | 167.3±48.6 vs. 139.7±50.8 | 0.311 |
| Time in hypoglycaemia (%) | 3.5±5.1 vs. 12.4±14.4 | 2.9±4.8 vs. 9.8±12.9 | 0.184 |
| Time in normoglycaemia (%) | 57.8±19.6 vs. 61.9±17.2 | 63.4±18.3 vs. 65.8±16.5 | 0.235 |
| Time in hyperglycaemia (%) | 38.7±23.8 vs. 25.7±22.4 | 33.7±21.6 vs. 24.4±20.7 | 0.342 |
Comparison of glycaemic parameters between early and late intradialytic periods stratified by treatment modality.
| Parameter | Insulin group (n=13) | Linagliptin group (n=12) | p-Value† |
|---|---|---|---|
| Early vs. late intradialytic | Early vs. late intradialytic | ||
| Mean glucose (mg/dL) | 147.6±52.7 vs. 139.9±60.2 | 135.4±47.3 vs. 128.2±42.1 | 0.487 |
| Time in hypoglycaemia (%) | 11.2±24.2 vs. 4.6±9.1 | 10.6±23.1 vs. 4.6±8.3 | 0.547 |
| Time in normoglycaemia (%) | 65.3±22.9 vs. 78.5±24.3 | 72.1±21.2 vs. 85.7±17.8 | 0.091 |
| Time in hyperglycaemia (%) | 23.5±21.6 vs. 16.9±22.8 | 17.3±19.2 vs. 9.7±18.5 | 0.127 |
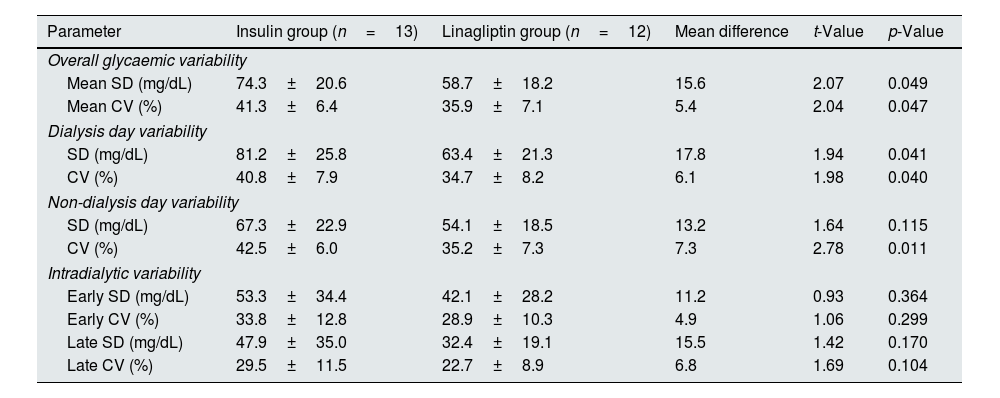
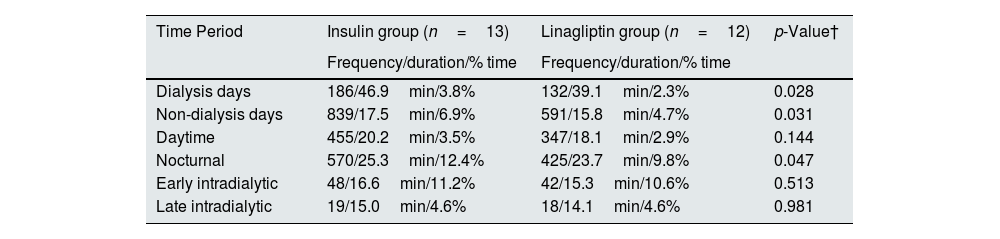
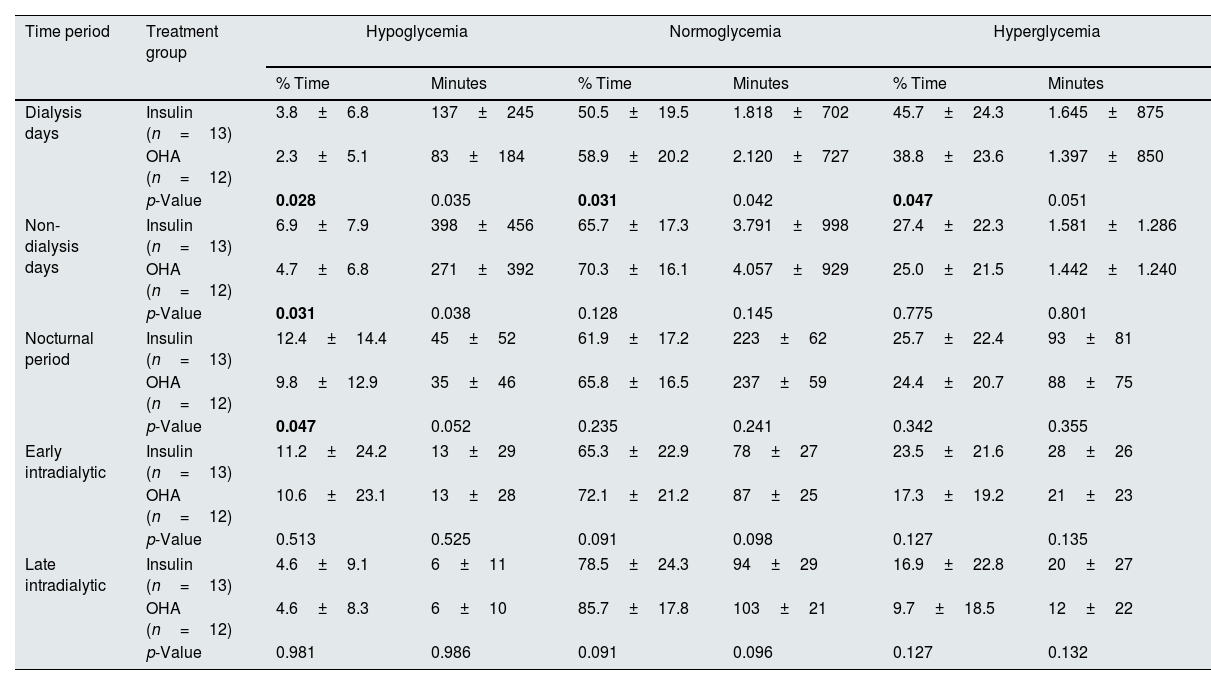
On further analysis, it was noticed that the overall glycaemic variability, glycaemic variability in both dialysis and non-dialysis days were lower in linagliptin-treated group (Table 5). Hypoglycaemia was more prominent in the insulin-treated group when compared to the linagliptin-treated group (Table 6). On dialysis days, the glycaemic variability parameters were substantially higher in the insulin-treated group compared to linagliptin-treated group. Such a variability was not observed during non-HD days. Table 7 describes the comprehensive temporal glycaemic distribution across both the treatment modalities, in terms of percentage and absolute duration metrics.
Direct comparison of glycaemic variability parameters between insulin and linagliptin treatment groups.
| Parameter | Insulin group (n=13) | Linagliptin group (n=12) | Mean difference | t-Value | p-Value |
|---|---|---|---|---|---|
| Overall glycaemic variability | |||||
| Mean SD (mg/dL) | 74.3±20.6 | 58.7±18.2 | 15.6 | 2.07 | 0.049 |
| Mean CV (%) | 41.3±6.4 | 35.9±7.1 | 5.4 | 2.04 | 0.047 |
| Dialysis day variability | |||||
| SD (mg/dL) | 81.2±25.8 | 63.4±21.3 | 17.8 | 1.94 | 0.041 |
| CV (%) | 40.8±7.9 | 34.7±8.2 | 6.1 | 1.98 | 0.040 |
| Non-dialysis day variability | |||||
| SD (mg/dL) | 67.3±22.9 | 54.1±18.5 | 13.2 | 1.64 | 0.115 |
| CV (%) | 42.5±6.0 | 35.2±7.3 | 7.3 | 2.78 | 0.011 |
| Intradialytic variability | |||||
| Early SD (mg/dL) | 53.3±34.4 | 42.1±28.2 | 11.2 | 0.93 | 0.364 |
| Early CV (%) | 33.8±12.8 | 28.9±10.3 | 4.9 | 1.06 | 0.299 |
| Late SD (mg/dL) | 47.9±35.0 | 32.4±19.1 | 15.5 | 1.42 | 0.170 |
| Late CV (%) | 29.5±11.5 | 22.7±8.9 | 6.8 | 1.69 | 0.104 |
SD, standard deviation; CV, coefficient of variation.
Hypoglycaemic events by treatment modality and context.
| Time Period | Insulin group (n=13) | Linagliptin group (n=12) | p-Value† |
|---|---|---|---|
| Frequency/duration/% time | Frequency/duration/% time | ||
| Dialysis days | 186/46.9min/3.8% | 132/39.1min/2.3% | 0.028 |
| Non-dialysis days | 839/17.5min/6.9% | 591/15.8min/4.7% | 0.031 |
| Daytime | 455/20.2min/3.5% | 347/18.1min/2.9% | 0.144 |
| Nocturnal | 570/25.3min/12.4% | 425/23.7min/9.8% | 0.047 |
| Early intradialytic | 48/16.6min/11.2% | 42/15.3min/10.6% | 0.513 |
| Late intradialytic | 19/15.0min/4.6% | 18/14.1min/4.6% | 0.981 |
Comprehensive temporal glycaemic distribution across treatment modalities – percentage and absolute duration metrics.a
| Time period | Treatment group | Hypoglycemia | Normoglycemia | Hyperglycemia | |||
|---|---|---|---|---|---|---|---|
| % Time | Minutes | % Time | Minutes | % Time | Minutes | ||
| Dialysis days | Insulin (n=13) | 3.8±6.8 | 137±245 | 50.5±19.5 | 1.818±702 | 45.7±24.3 | 1.645±875 |
| OHA (n=12) | 2.3±5.1 | 83±184 | 58.9±20.2 | 2.120±727 | 38.8±23.6 | 1.397±850 | |
| p-Value | 0.028 | 0.035 | 0.031 | 0.042 | 0.047 | 0.051 | |
| Non-dialysis days | Insulin (n=13) | 6.9±7.9 | 398±456 | 65.7±17.3 | 3.791±998 | 27.4±22.3 | 1.581±1.286 |
| OHA (n=12) | 4.7±6.8 | 271±392 | 70.3±16.1 | 4.057±929 | 25.0±21.5 | 1.442±1.240 | |
| p-Value | 0.031 | 0.038 | 0.128 | 0.145 | 0.775 | 0.801 | |
| Nocturnal period | Insulin (n=13) | 12.4±14.4 | 45±52 | 61.9±17.2 | 223±62 | 25.7±22.4 | 93±81 |
| OHA (n=12) | 9.8±12.9 | 35±46 | 65.8±16.5 | 237±59 | 24.4±20.7 | 88±75 | |
| p-Value | 0.047 | 0.052 | 0.235 | 0.241 | 0.342 | 0.355 | |
| Early intradialytic | Insulin (n=13) | 11.2±24.2 | 13±29 | 65.3±22.9 | 78±27 | 23.5±21.6 | 28±26 |
| OHA (n=12) | 10.6±23.1 | 13±28 | 72.1±21.2 | 87±25 | 17.3±19.2 | 21±23 | |
| p-Value | 0.513 | 0.525 | 0.091 | 0.098 | 0.127 | 0.135 | |
| Late intradialytic | Insulin (n=13) | 4.6±9.1 | 6±11 | 78.5±24.3 | 94±29 | 16.9±22.8 | 20±27 |
| OHA (n=12) | 4.6±8.3 | 6±10 | 85.7±17.8 | 103±21 | 9.7±18.5 | 12±22 | |
| p-Value | 0.981 | 0.986 | 0.091 | 0.096 | 0.127 | 0.132 | |
Note: Values presented as mean±standard deviation. Bold p-values indicate statistical significance (p<0.05). Absolute duration calculated based on defined temporal periods: dialysis days (24h=1.440min), non-dialysis days (variable interdialytic interval, mean 5.770±450min), nocturnal period (360min), intradialytic phases (120min each).
The presentation of hypoglycemic, normoglycemic, and hyperglycemic time exclusively as percentages rather than absolute minutes represents a methodologically sound approach aligned with international consensus recommendations for continuous glucose monitoring data interpretation (Battelino et al., 2019)18. Percentage-based reporting facilitates standardized comparisons across patients with varying monitoring durations and enables direct assessment against established clinical targets (e.g., time-in-range>70%, time-below-range<4%). This approach eliminates confounding effects of differential monitoring periods and enhances statistical validity through normalized metrics. Furthermore, percentage representation aligns with contemporary diabetes literature standards and provides clinically intuitive benchmarks for therapeutic decision-making, supporting evidence-based glycemic target assessment and comparative effectiveness evaluation across treatment modalities.
Fig. 1 illustrates the temporal patterns of mean glucose concentrations during the first 4h of HD sessions compared with time-matched periods on non-dialysis days, stratified by antidiabetic treatment modality. A consistent pattern of significantly lower glucose values was observed on haemodialysis days compared to non-dialysis days across all patient groups (p<0.001). The nadir in glucose concentrations occurred approximately 90min into haemodialysis (81.3mg/dL for all patients), representing a 53.9% reduction from time-matched non-dialysis values (186.3mg/dL).
. The nadir in glucose concentrations occurred approximately 90min into haemodialysis (81.3mg/dL for all patients), representing a 53.9% reduction from time-matched non-dialysis values (186.3mg/dL).")
Comparison of intradialytic and time-matched non-dialysis glycaemic profiles stratified by antidiabetic treatment modality. This figure illustrates the temporal patterns of mean glucose concentrations during the first 4h of HD sessions compared with time-matched periods on non-dialysis days, stratified by antidiabetic treatment modality. A consistent pattern of significantly lower glucose values was observed on haemodialysis days compared to non-dialysis days across all patient groups (p<0.001). The nadir in glucose concentrations occurred approximately 90min into haemodialysis (81.3mg/dL for all patients), representing a 53.9% reduction from time-matched non-dialysis values (186.3mg/dL).
Treatment-specific analysis revealed differential patterns, with insulin-treated patients (n=13) demonstrating both higher absolute glucose values and greater dialysis-associated decrements compared to linagliptin-treated patients (n=12). Notably, the insulin group exhibited more pronounced post-nadir glycaemic recovery, suggesting differential counter-regulatory responses. These findings underscore the substantial haemodialysis-induced perturbations in glucose homeostasis and highlight treatment-modality differences in glycaemic dynamics during dialysis.
DiscussionCGM systems represent a paradigm shift in diabetes management in the last decade. These systems measure interstitial glucose concentrations at frequent intervals (typically every 5–15min), generating comprehensive glycaemic profiles across various physiological states and clinical interventions.12,13 The ambulatory glucose profile (AGP) analysis derived from CGM data facilitates the evaluation of critical metrics including mean glucose concentrations, time in range (TIR), glycaemic variability and hypoglycaemic episodes, and such parameters that have demonstrated prognostic significance beyond traditional glycaemic markers.14,15,16
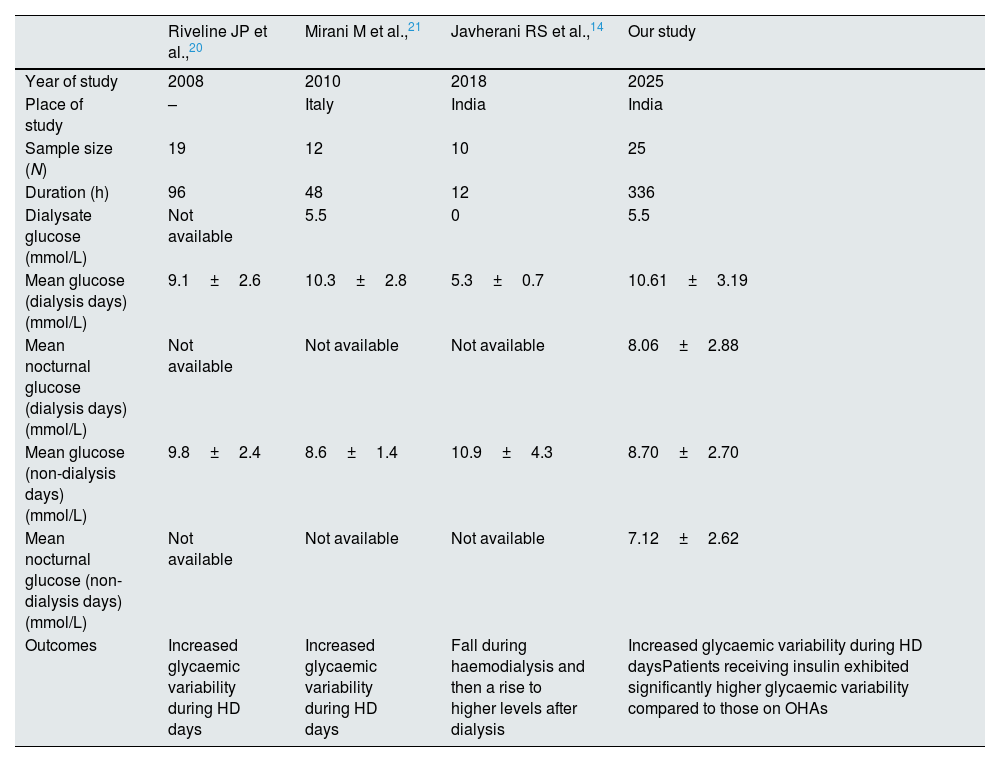
Glucose, a 180Da molecule readily crosses the dialyser membrane depending upon the concentration gradient. Emerging research demonstrates that HD sessions induce substantial alterations in glucose metabolism through multiple mechanisms: glucose removal into dialysate, improved insulin sensitivity, reduced insulin clearance, and decreased counter-regulatory hormone production.17,18 The intricate pathophysiological interplay between these conditions manifests in altered glucose homeostasis, insulin metabolism, and medication pharmacokinetics, necessitating specialized glycaemic monitoring approaches.19,20 These physiological perturbations potentially manifest as heightened glycaemic variability and increased hypoglycaemic risk, particularly during and immediately following dialysis sessions. Multiple studies have documented distinct glycaemic patterns between dialysis and non-dialysis days, with potentially higher hypoglycaemic risk during nocturnal periods20–22 (Table 8).
Studies on glycaemic variability in haemodialysis.
| Riveline JP et al.,20 | Mirani M et al.,21 | Javherani RS et al.,14 | Our study | |
|---|---|---|---|---|
| Year of study | 2008 | 2010 | 2018 | 2025 |
| Place of study | – | Italy | India | India |
| Sample size (N) | 19 | 12 | 10 | 25 |
| Duration (h) | 96 | 48 | 12 | 336 |
| Dialysate glucose (mmol/L) | Not available | 5.5 | 0 | 5.5 |
| Mean glucose (dialysis days) (mmol/L) | 9.1±2.6 | 10.3±2.8 | 5.3±0.7 | 10.61±3.19 |
| Mean nocturnal glucose (dialysis days) (mmol/L) | Not available | Not available | Not available | 8.06±2.88 |
| Mean glucose (non-dialysis days) (mmol/L) | 9.8±2.4 | 8.6±1.4 | 10.9±4.3 | 8.70±2.70 |
| Mean nocturnal glucose (non-dialysis days) (mmol/L) | Not available | Not available | Not available | 7.12±2.62 |
| Outcomes | Increased glycaemic variability during HD days | Increased glycaemic variability during HD days | Fall during haemodialysis and then a rise to higher levels after dialysis | Increased glycaemic variability during HD daysPatients receiving insulin exhibited significantly higher glycaemic variability compared to those on OHAs |
The pharmacological management of diabetes in MHD patients presents unique challenges, with both insulin therapy and OHAs demonstrating specific advantages and limitations. While insulin remains the predominant therapeutic modality in this population, its complex pharmacokinetics in renal failure and dialysis may contribute to enhanced glycaemic variability.20 Conversely, select OHAs with minimal renal clearance, such as linagliptin and teneligliptin present potential alternatives, though their comparative effects on glycaemic variability patterns remain incompletely characterized in current literature.21
Our findings demonstrate that both insulin and linagliptin-treated patients exhibit significantly higher mean glucose concentrations and increased glycaemic variability during HD days compared to non-dialysis days. Absolute glycaemic variability as measured by standard deviation was significantly higher on dialysis days in both groups, with a more pronounced effect in insulin-treated patients (p=0.037). This observation is consistent with previous research by Bomholt et al. (2023) who documented higher mean glucose levels and standard deviations on dialysis days in their cohort of 25 diabetic haemodialysis patients.19 Similarly, Mirani et al. (2010) reported increased glycaemic variability metrics during dialysis days in their study of 10 insulin-treated patients.10 However, our study extends these findings by demonstrating a treatment-modality effect, with insulin-treated patients exhibiting a significantly greater dialysis-associated hyperglycaemic response (mean difference: 39.8mg/dL versus 28.7mg/dL, p=0.043) and higher absolute glycaemic variability compared to linagliptin-treated patients.
The physiological mechanisms underlying haemodialysis-associated hyperglycaemia and increased glycaemic variability are multifactorial. Abe et al. (2007) proposed that dialysis-induced inflammatory cytokine release and counter-regulatory hormone secretion contribute to transient insulin resistance.2 Additionally, Kazempour-Ardebili et al. (2009) documented significantly reduced insulin clearance during HD in their study on 17 diabetic patients, potentially leading to hyperinsulinemia and subsequent post-dialysis hypoglycaemia.14 Our observation of treatment-modality differences in dialysis-associated glycaemic perturbations suggests that exogenous insulin administration may amplify these physiological responses compared to oral agents with different pharmacokinetic profiles.
The nocturnal hypoglycaemic burden observed in our study warrants particular attention. Both treatment groups demonstrated significantly lower mean glucose concentrations and higher hypoglycaemic risk during nocturnal periods, with insulin-treated patients exhibiting a significantly higher nocturnal hypoglycaemic burden compared to linagliptin-treated patients (12.4% versus 9.8% of monitoring time, p=0.047). These findings highlight the complex dynamics of hypoglycaemic risk in diabetic-haemodialysis patients and underscore the importance of treatment-specific risk assessment and preventive strategies, particularly during high-risk periods such as nocturnal hours and early intradialytic phases. This finding aligns with the results of Jung et al. (2010), who documented frequent nocturnal hypoglycaemic events in their cohort of 20 haemodialysis patients with type 2 diabetes, particularly in insulin-treated individuals.11 The heightened nocturnal hypoglycaemic risk may reflect the combined effects of reduced caloric intake during sleep, prolonged post-dialysis insulin sensitivity, and the pharmacokinetic properties of intermediate or long-acting insulin formulations that peak during night-time hours.
Intradialytic glycaemic variability revealed interesting patterns, with both treatment groups demonstrating progressive glycaemic stabilization from early to late intradialytic periods. This finding is consistent with observations by Hissa et al. (2021), who documented decreasing glycaemic variability during the course of HD sessions in their study of 14 diabetic patients.8 However, our study further identified a treatment-modality effect on this stabilization pattern, with linagliptin-treated patients exhibiting a more pronounced reduction in glycaemic variability during late intradialytic periods compared to insulin-treated patients (SD reduction: 20.9mg/dL versus 5.4mg/dL, p=0.028). This differential response may reflect the distinct pharmacokinetic alterations of oral agents versus insulin during HD, as well as potential differences in counter-regulatory responses to dialysis-induced glucose shifts.
The mechanisms underlying higher glycaemic variability with insulin therapy in MHD patients are likely multifactorial. Hayashi et al. (2021) documented that haemodialysis alters insulin receptor sensitivity patterns and insulin clearance rates, potentially leading to unpredictable insulin action.4 In contrast, select oral agents with stable pharmacokinetic profiles and glucose-dependent mechanisms of action, such as dipeptidyl peptidase-4 (DPP-4) inhibitors may confer more predictable glycaemic responses in this population.23,24
The absence of significant correlations between traditional clinical parameters (age, diabetes duration, dialysis vintage, BMI) and glycaemic variability metrics in our study deserves consideration. Vos et al. (2012) similarly reported poor predictive value of conventional clinical parameters for glycaemic variability in their study including 15 diabetic CKD patients.1
The consistent pattern of higher glycaemic variability metrics in insulin-treated patients across multiple contexts suggests a fundamental treatment-associated difference in glycaemic stability that may have important implications for individualized diabetes management in HD patients. Our findings have significant clinical implications. First, the documented differences in treatment modalities concerning glycaemic variability offer an evidence-based foundation for the selection of individualized antidiabetic regimens. For patients experiencing significant glycaemic fluctuations while on insulin therapy, transitioning to suitable oral agents with minimal renal clearance, such as linagliptin may enhance glycaemic stability. Secondly, the identification of high-risk periods for hypoglycaemia, specifically during nocturnal hours and early intradialytic phases in insulin-treated patients, necessitates specific preventive strategies. These strategies may include bedtime snacks, reduced overnight insulin doses, and glucose monitoring with appropriate insulin adjustments. Thirdly, the observed progressive glycaemic stabilization during HD sessions suggests that administering insulin post-dialysis might mitigate the risk of hypoglycaemia without compromising overall glycaemic control. Finally, our findings underscore the value of CGM as a clinical tool for identifying patient-specific glycaemic patterns and treatment-associated risk profiles that remain undetected with conventional monitoring approaches.
StrengthsTo our knowledge, this is the first study which has measured glucose profile comprehensively using CGM for 2 weeks, including 4–6 HD sessions and compared insulin and OHA (linagliptin) treated groups, thereby providing robust assessment of glycaemic variability. The inclusion of both insulin and OHA-treated patients with comparable demographic and clinical characteristics allowed for valid treatment-modality comparisons without significant confounding variables. The standardized definitions of duration (dialysis versus non-dialysis days, daytime versus nocturnal periods, early versus late intradialytic phases) facilitated systematic analysis of context-specific glycaemic patterns.
LimitationsThe relatively small sample size (n=25) may limit statistical power for detecting subtle between-group differences and subgroup analyses. The single-centre design potentially restricts generalizability to populations with different dialysis protocols, dietary patterns, or treatment approaches. The observational nature of the study precludes establishing causal relationships between treatment modalities and glycaemic outcomes. Additionally, the absence of data on medication adherence, dietary intake, and physical activity levels precludes comprehensive evaluation of these potential contributors to glycaemic variability.
RecommendationsFuture research should include larger, multicentric studies comparing specific OHA regimens versus different insulin preparations. Randomized controlled trials evaluating treatment switching strategies (from insulin to appropriate OHA or vice versa) represent another critical research direction to establish causal relationships between treatment modalities and glycaemic stability. Development and validation of dialysis-specific CGM metrics and target ranges would provide valuable clinical tools for this unique population. Implementation studies assessing the feasibility and effectiveness of treatment protocol modifications based on CGM findings are needed to translate observations into clinical practice recommendations. Finally, longitudinal studies correlating treatment-associated glycaemic variability with hard clinical outcomes would establish the prognostic significance of the observed differences.
ConclusionThis study demonstrated significant differences in glycaemic variability based on antidiabetic treatment modality in HD population. Patients receiving insulin therapy exhibited significantly higher glycaemic variability compared to those on linagliptin. Both treatment groups demonstrated increased glycaemic variability during HD days compared to non-dialysis days, with insulin-treated patients showing a more pronounced dialysis-associated glycaemic perturbation. Notably, insulin therapy was associated with significantly higher nocturnal hypoglycaemia periods. The differential patterns of glycaemic variability between treatment modalities underscore the need for tailored antidiabetic regimens for HD patients, potentially favouring OHA therapies in select patients to minimize glycaemic fluctuations and nocturnal hypoglycaemic risk.
Authors’ contributionsAA and VJ conceived the idea and designed the study. AA, RR and RG collected the data and did statistical analysis. AA, VJ and MGG did literature search. AA, RR, RG and MGG prepared the manuscript. VJ reviewed the paper and approved the final version of it.
Ethics approval and consent to participateThis study was conducted in accordance with the Declaration of Helsinki and was approved by the Institutional Ethics Committee of SRM Medical College Hospital and Research Centre (Approval Number: SRMIEC-ST0923-1472). Written informed consent was obtained from all participants prior to their inclusion in the study. All participants were fully informed about the study's aims, procedures, potential risks, and their right to withdraw at any time without any consequences.
Patient consent statementPatient consent was taken from all of the patients included in the study.
Consent for publicationNot applicable.
Clinical trial registration numberNot applicable.
FundingThere is no funding (institutional, private and/or corporate financial support) for the work reported in their manuscript.
Conflict of interestsThe authors declare no competing interests.
Availability of data and materialsAll data related to this study and statistical analysis are available with the first author and corresponding author. Data can be provided based on request.
The authors thank all the study participants for consenting to be part of this study.


