

Kidney transplantation (KT) is the most effective treatment for end-stage kidney disease. With advancements in modern immunosuppression, graft survival rates for standard-risk recipients have significantly improved, reaching approximately 95% in the first year, 85% at five years, and 65% at 10 years. However, long-term outcomes remain challenging due to chronic graft loss and drug-related toxicities. Immunosuppressive drugs, with narrow therapeutic range of safety and efficacy, require drug-monitoring strategies to optimize outcomes. In KT, the standard triple maintenance regimen of tacrolimus, mycophenolate mofetil (MMF), and prednisolone is practiced and MMF is typically administered as a fixed-dose drug. However, evidence suggests that dosage adjustments based on concentration monitoring yield superior clinical outcomes. MMF, an ester prodrug of mycophenolic acid (MPA), necessitates area under the concentration curve (AUC) monitoring due to its complex pharmacokinetics and an exposure level of 30–60mg/Lh is considered adequate for transplant recipients. However, fixed dosing practices continued, due to controversial evidence and lack of familiarity with AUC and monitoring techniques. AUC monitoring has also been proposed for tacrolimus, a calcineurin inhibitor (CNI), instead of routinely used trough concentration, particularly in “rapid metabolizers” who may experience higher peak concentrations and toxicities. To enhance transplant outcomes, a comprehensive understanding of AUC and relevance to immunosuppressant exposure is critical. This review will primarily focus on MPA AUC exposure in post-kidney transplant patients, explore and explain methods for AUC monitoring, and highlight recent developments in tacrolimus AUC monitoring.
El trasplante renal (TR) es el tratamiento más efectivo para la enfermedad renal en etapa terminal (ETR). Con los avances de la inmunosupresión moderna, las tasas de supervivencia del injerto para los receptores de riesgo estándar han mejorado significativamente, alcanzando aproximadamente el 95% en el primer año, el 85% a cinco años y el 65% a 10 años. Sin embargo, los resultados a largo plazo siguen siendo complicados debido a la pérdida crónica del injerto y a las toxicidades relacionadas con los fármacos. Los fármacos inmunosupresores, con un rango terapéutico estrecho de seguridad y eficacia, requiere estrategias de monitorización de fármacos para optimizar los resultados. En el TR, se practica el régimen de mantenimiento triple estándar de tacrólimus, micofenolato de mofetilo (MMF) y prednisolona, administrándose normalmente MMF como fármaco a dosis fija. Sin embargo, la evidencia sugiere que los ajustes de dosificación basados en la monitorización de la concentración produjeron resultados clínicos superiores. MMF, un éster del ácido micofenólico (MPA), necesita monitorización del área bajo la curva (AUC) de concentración debido a su farmacocinética compleja y un nivel de exposición de 30–60mg/lh, siendo considerado adecuado para los receptores de trasplantes. Sin embargo, las prácticas de dosis fijas han continuado, debido a la evidencia controvertida y a la falta de familiaridad con la AUC y las técnicas de monitorización. También se ha propuesto la monitorización de la AUC para tacrólimus, inhibidor de calcineurina (CNI), en lugar de utilizarse rutinariamente mediante concentración, particularmente en «metabolizadores rápidos» que pueden experimentar mayores concentraciones máximas y toxicidades. Para mejorar los resultados de los trasplantes, es esencial la comprensión amplia de la AUC y la relevancia respecto a la exposición a inmunosupresores. Esta revisión se centrará principalmente en la exposición de la AUC de MPA en los pacientes tras el TR, así como en explorar y explicar los métodos de monitorización de la AUC, y destacar los desarrollos recientes en cuanto a monitorización del tacrólimus.
Kidney transplantation (KT) offers a superior quality of life for individuals with end-stage kidney disease. Recent global data from 98 countries report a median incidence and prevalence of KT at 14 and 255 per million population, respectively.1 While KT provides significant longevity and economic benefits compared to dialysis, successful outcomes are significantly dependent on the adequacy of immunosuppression. Post-transplant immunosuppression was first introduced by Thomas Earl Starlz in 1963.2 Since then, substantial advancements have improved short-term outcomes of KT, particularly through the use of the current “quadruple therapy” regimen including induction therapy (basiliximab, antithymocyte globulin) and the maintenance triple regimen (comprising tacrolimus, MMF, and prednisolone).3 However, despite these advancements, approximately 25% of adult, and 25–38% of paediatric KT recipients suffers graft loss and return to dialysis within five years and seven years respectively.4 Over the last decade, survival outcomes remained unchanged, and chronic allograft injury continued as a significant concern in kidney transplant recipients.5 Recent studies suggest that MMF may serve as a key predictor of long-term outcomes.6 However, a persistent debate surrounds its concentration-controlled dosing (CCD) vs. fixed dosing for optimal effectiveness. MMF fixed dosing has been associated with variable exposure due to its complex pharmacokinetics, with suboptimal exposure increasing the risk of rejections and transplant failure.7,8 Consequently, monitoring MMF using the AUC method has been proposed to address these issues. Although CCD has demonstrated improved outcomes, the implementation of this approach remains limited due to controversial evidence and a lack of familiarity with the AUC monitoring methods. An enhanced understanding of MPA exposure and the associated challenge of its monitoring is critical to improve transplant outcomes. Similarly for tacrolimus, recent developments indicated AUC monitoring as more accurate measure of drug exposure compared to traditional trough concentration monitoring. This review aims to provide clinicians with an overview and insights into the evidence for MMF exposure, its pharmacokinetics, associated controversies, monitoring strategies, and clinical applicability, along with brief points on tacrolimus in kidney transplant recipients.
Pharmacokinetics and the need for monitoringMMF, an antimetabolite drug, was reintroduced as an immunosuppressive agent for kidney transplantation in 1995, after its initial discovery in 1893 as an antibacterial agent by Italian physician Bartolomeo Gosio.9 The efficacy of MMF in preventing acute rejection episodes in renal allograft recipients was established through randomized, double-blind studies conducted in the United States and Europe, followed by a tricontinental study.10–12 MMF is an ester prodrug of MPA that selectively and reversibly inhibits inosine monophosphate dehydrogenase (IMPDH), a rate-limiting enzyme in the de novo synthesis of guanosine nucleotides. By impeding the synthesis of guanosine and deoxyguanosine nucleotides, MMF induces apoptosis in activated T-lymphocytes, suppresses glycosylation and the expression of adhesion molecules, and decreases inducible nitric oxide (NO) production by depleting its cofactor, tetrahydrobiopterin. Additionally, MMF suppresses dendritic cell maturation and reduces the expression of interleukin (IL)-1, contributing to its targeted immunosuppressive effects.13
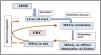
PharmacokineticsMMF is commonly prescribed orally in a fixed dosage ranging from 600 to 1200mg/m2 in children and 1–2g/day in adults.14 Following administration, MMF undergoes hydrolysis by esterase, achieving peak plasma concentrations of MPA within 60–90min. Approximately 90–95% of the drug is absorbed after oral intake and enters systemic circulation. It has a half-life of 12–20h with both oral and intravenous administration. The small fraction of unbound MPA in lymphocytes mediates its immunosuppressive effects. MPA undergoes first-pass metabolism in the liver, where uridine 5ʹ-diphosphate glucuronosyltransferases (UGT) metabolize MPA into its primary metabolites: mycophenolic acid glucuronide (MPAG), 7-O-MPA-β-glucuronide, and MPA acyl-glucuronide (Ac-MPAG).15,16 While MPAG undergoes primarily renal clearance, a fraction is excreted into bile via the multidrug resistance protein 2 (MRP-2) transporter, where intestinal bacteria convert it back to MPA before reabsorption into the circulation. This process, known as enterohepatic cycling (EHC), and it leads to a secondary peak in MPA concentration approximately 6–8h after oral dosing.17 Also, post-kidney transplantation, there is an alteration in gut microbiota, that reduces EHC. A significant proportion of MPAG binds to plasma albumin (∼82%) at therapeutic concentrations. In cases of impaired renal function, MPAG accumulates and competes with MPA for plasma protein binding, resulting in elevated levels of unbound MPA and thus increased pharmacological activity. See Fig. 1 for MPA pharmacokinetics and the enterohepatic circulation.

MPA pharmacokinetics: MPA metabolites and the enterohepatic cycle. This figure illustrates MPA pharmacokinetics: after MMF oral absorption, MPA is first generated after hydrolysis by esterase, it then primarily metabolized in the liver to an inactive glucuronide conjugate, MPAG, and to a lesser extent, Ac-MPAG. MPAG then underwent renal clearance. A fraction of it pass into bile and get deconjugated by gut microbiota to free MPA and contributing to a secondary plasma concentration peak, called EHC. MMF: mycophenolate mofetil; MPA: mycophenolic acid; MPAG: mycophenolic acid glucuronide; Ac-MPAG: acyl-glucuronide; GI: gastrointestinal tract; EHC: enterohepatic circulation.
MMF pharmacokinetics contributes to major intra- and inter-individual variability and unpredictability in its exposure. This is often influenced by multiple factors, such as changes in glomerular filtration rate, albumin levels, and concomitant medications, especially in the immediate time-period after kidney transplantation. MPA and MPAG protein binding and its EHC varies significantly with these parameters and thus result in exposure irregularities. Additionally, inconsistency in MPA exposure can be attributed to UGT enzyme gene polymorphisms and uptake transporter variability. The first study by Hale et al. in 1998 a randomized, multi-targeted approach demonstrated a significant association between MPA AUC exposure and biopsy-proven rejections and similar results were shown by other studies.18,19 Thus, MPA AUC monitoring is crucial to adjust dosage and for effective concentration and improved graft survival as further revealed in the next section.
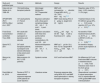
Clinical evidence on AUC monitoring, debate, MPA exposure and specific considerations in paediatric populationsClinical evidence on AUC monitoring and debateMPA concentrations-controlled dosing using AUC is associated with reduced rejection rates compared to fixed dosing, shown by randomized studies as well as by observational data.19,20 However, a large multicenter European randomized trial in 2008 failed to demonstrate the benefits of MPA exposure. The study authors later attributed suboptimal drug exposure and poor outcomes to clinician's reluctance to adjust doses based on monitoring results.21 A systematic review by Wang et al., also failed to demonstrate clear advantages of MPA concentration monitoring.22 These findings were later critiqued by experts who attributed the failure of CCD and the inconsistency in study outcomes to the use of a broad therapeutic range and not applying monitoring effectively.8,20,23 See Table 1 for key opinion-forming studies on MPA AUC and clinical outcomes.8,18–23 Moreover, trough monitoring has shown a weak to moderate correlation with MPA AUC. A very few studies have suggested an association between trough concentrations rejection episodes, and the development of donor-specific antibodies (DSAs).24–27
Key opinion-forming studies on MPA AUC and clinical outcomes.
| Study and published year | Patients | Methods | Design | Results |
|---|---|---|---|---|
| Hale and van Gelder et al., 1998–99 | 154 Adult kidney transplant patients | Multi-target Multicentric RCTTrapezoidal method | MMF with cyclosporine+steroids; 3 target MPA AUC0–12: 16.1, 32.2, 60.6mgh/L20,22 | Rejection rates: 27.5% (low), 14.9% (medium), 11.5% (high) |
| APOMYGRE (RCT, 2007)Le Meur et al., 2007 | 137 adult patients (11 French centres) | Bayesian estimation with a three-point sampling strategy (20min, 1h, and 3h post-dose) | MMF: fixed dosing (FD) of 2g/day vs. target AUC 40mg/h/L | Treatment failure in the FD 48%CC group 29%, p=0.03; acute rejection (31% vs. 12%, p=0.01)36 |
| Fixed Dose Concentration-controlled Trial, 2008 | 901 adults (60 children) on cyclosporin or tacrolimus and steroids | Bayesian calculation with three-time points: before (predose concentration), 30, and 120min | AUCt0–12 (45mg/Lh) 30–60mg/Lh with a fixed dose of 2g/day | No benefit of TDM treatment failure (25.6% vs. 25.7%, p=0.81) or BPAR (14.9% vs. 15.5%, p>0.05)38,39 |
| Opera RCT, 2011 | 247 adult transplant patients. Cyclosporin and steroid withdrawal at day seven post-transplant | MulticentricBayesian estimation (20min, 1h, and 3h) | MMF as 3g/d for 10 d, then TCI to a target MPA AUCt0–12 of 40mg/Lh vs. 2g/d | No benefit in biopsy-proven acute rejection at 3 months37 |
| Wang et al., 2013 | Meta analysis of 4 RCT (1755 patients) | Systemic review | AUC and fixed-dose MMF | No difference AUC and fixed-dose MMF outcome in treatment failure (p=0.52). Total infections were more in the AUC group (p=0.01) |
| David Metz et al., 2019 | Review of RCT & observational exposure-response (3794 patients for acute rejection) | Literature review | Exposure-response data using MPA AUC and MMF dose optimization in kidney transplant recipients | Observational: consistent & robust association AUC & rejectionBenefit of PK-guided MMF dose individualisation |
Consequently, MPA monitoring has remained a subject of considerable debate due to the varying report outcomes, pharmacokinetics variability, practical challenges of AUC monitoring, cost burden, and lack of agreement on standard methods of monitoring despite AUC monitoring being a likely factor to improve long-term graft survival.
MPA optimum exposureFollowing kidney transplantation, MPA target exposure of 30–60mgh/L with cyclosporine therapy, and a similar target of 40mgh/L with tacrolimus therapy, were estimated safe and effective as determined by previous studies.24,28–30 It is important to note that co-administration of cyclosporine leads to a 40% reduction in MPA exposure, necessitating dose adjustments to achieve the desired concentration, whereas no such effect has been observed with tacrolimus.31
The association between MPA exposure and rejection episodes were often inferred from the mean exposure in initial period after transplantation in earlier studies. However, AUC exposure early after transplant does not accurately reflect the exposure over time due to changes in associated co-factors. Shaw et al. demonstrated a 30–50% increase in MPA AUC during the first weeks after transplantation.30 Later, Van Hest et al. identified a time-dependent change in MPA exposure, linked to a reduction in MPA clearance.31 This change was attributed to a combination of factors, including improving creatinine clearance, rising albumin levels, increasing hemoglobin concentrations, and decreasing cyclosporine levels, particularly during the first six months following kidney transplantation. Daher-Abdi et al. analyzed the correlation between longitudinal MPA exposure and acute rejection during the first-year post-kidney transplantation using a joint modeling approach. The study demonstrated variable MPA exposure over time, with the desirable AUC target increasing progressively: 35mgh/L around week 1, 37mgh/L at month 1, 40mgh/L at month 3, and 41mgh/L after month 6 (p<0.001).32 Further analysis highlighted the importance of longitudinal MPA monitoring and MPA AUC(t) exposure in predicting acute rejection, graft loss, and mortality (within the observed exposure ranges), after standardizing for CNI exposure.33 Wang et al. provided additional evidence, identifying significantly lower MPA exposure (AUC,12h/dose) in kidney transplant recipients during the early post-transplant period (days 4–8) compared to 5–10 years post-transplant with fixed dosing (40.83±22.26mgh/L vs. 77.86±21.34mgh/L; p<0.001).33 This revealed 30–50% lower MPA exposure during the immediate post-transplant period than in the later stable state. Longitudinal monitoring of MPA exposure post-kidney transplantation has been shown to be beneficial, offering increased accuracy and improved outcomes.34,35
Variability in MPA exposure with ageMPA exposure in the paediatric cohortThe efficacy and safety of MMF in paediatric kidney transplantation was established by numerous studies soon after the adult trials.36–41 These studies demonstrated comparative tolerability and MPA exposure in children with adults. A study by Tönshoff et al. determined almost 10-fold variability in dose-normalized MPA AUC (0–12) values after transplanataion.42 Further pharmacokinetic model developed by Veličković-Radovanović et al. demonstrated effect on MPA clearance by age, total daily MPA dose, and concurrent therapies.43 Ghio et al., in a longitudinal study of 50 kidney transplant recipients aged 2–19 years, assessed the complete pharmacokinetic profile (10 time points) on post-transplant days 6, 30, 180, and 360. The study identified AUC as a reliable measure of MPA exposure (r=0.91; p<0.001), confirming its efficacy and safety.44 Martial et al. investigated MPA AUC exposure in 39 pediatric kidney transplant recipients, comparing two groups: those within three weeks post-transplantation and those beyond 18 months post-transplantation. They reported mean AUC values of 29.7mgh/L in the early post-transplant period (Group 1) and 56.6mgh/L in the late post-transplant period (Group 2), despite a lower dosage in the latter group (584mg/m2 vs. 426mg/m2). The study highlighted significant variability (36%) in MPA exposure over time, correlating this variability with changes in serum creatinine levels in pediatric patients.45 Furthermore, limited samples were determined and studies validated algorithms based on an abbreviated pharmacokinetic (PK) profile for the estimation of MPA exposure in paediatric cohort.46,47 A recent study by Labriffe et al. analyzed data from 1051 pediatric kidney transplant recipients and found that only 50% had their first MPA exposure within the recommended range of 30–60mgh/L.47
MPA exposure in the elderly populationA study by Tang et al. demonstrated no significant effect on MPA exposure or pharmacokinetics in elderly patients (aged 65 years and above).48 In contrast, another study comparing elderly (mean age 63 years) and younger (41±5 years) transplant recipients showed lower overall exposure and trough concentrations in the elderly group. These conflicting findings highlight the need for more data in this vulnerable population.49
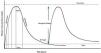
AUC estimation methods; clinical applicabilityAUC estimation methodsUnlike calcineurin inhibitors, a single trough concentration of MPA does not provide an accurate estimation of drug exposure due to the complexities of MPA Pk discussed earlier and consequently, AUC monitoring is recommended. AUC is a crucial measure of drug concentration over time, typically determined through blood or plasma samples collected at multiple time points.50 See Fig. 2 for area under the concentration curve exposure metrics. AUC provides valuable information for dose adjustment and is calculated using the formula: AUC=Dose/Clearance. However, it is generally not implemented in routine clinical practice due to the challenges associated with its application, need for multiple blood samples, increased resource requirements, and higher costs. Additionally, there is a lack of understanding and consistent application of AUC methods among clinicians. Methods of MPA AUC monitoring include trapezoid method, multilinear regression, and Bayesian estimation method. The latter two methods are limited sample approaches and widely used in studies. The trapezoid method (8–12h) is a standard reference method but requires multiple samples.51 Multilinear regression (MLR) and Bayesian estimation (BE) are though limited sampling strategies but have limitations and consequently not practiced in transplant clinics.47,52

Area under the concentration-time curve (AUC) exposure metrics. This figure illustrates: AUC metrics – Cmax: maximum concentration achieved; Tmax: time taken to achieve maximum concentration; Ctrough: lowest concentration before the next dose; Cmin: lowest concentration; therapeutic window: safe and effective drug concentration (example PK: MMF to MPA, absorption time approx. 30–60 min, Tmax of 1–2h, elimination time 8–16h, and the onset of action within 24–48h. Tacrolimus: Absorption within 4h, Tmax 1.5–3h, elimination half-life 8–12h, and onset of action within 12–24h).
Trapezoid method mainly involves calculating AUC by breaking the curve into trapezoids (at concentration–time points) and calculating the area for each trapezoid. MLR is a data-driven technique that efficiently derives a mathematical function relating a limited number of drug concentrations in a dosing interval to the full AUC. Bayesian methods have three components: (A) prior information (prior distribution), it may be from previous trials and reflects the expected observation(s) for a specific population, (B) observed patient data, (C) predict individual responses, the data are formally turned into statistical knowledge using Bayesian theorem into the posterior distribution. See Table 2 for AUC and precision monitoring methods advantages and disadvantages.
Methods of AUC monitoring.
| Methods of AUC estimation and modern approaches of drug concentration monitoringThe precision dosing is based on the concept that each patient responds differently to the same dose (inter-individual variability), and even same patient may react differently to the same dose over time (intra-individual variability). It can be achieved by using newer methods as described below.The AUC (area under the concentration- time curve) monitoring measures the total exposure to a drug over a period of time |
| Methods AUC | Advantages | Disadvantages |
|---|---|---|
| Trapezoid method | Easy to calculateMost accurate method & often used as a reference standard method | Requires multiple samplesIncreased costTime consumingInconvenient |
| The multilinear linear regression (MLR) method | Statistical equations, easily done based on limited samples strategies | Can give false positive associationsExact time points MPA estimationLimited to tested population |
| Bayesian estimation | Limited samplesIncreased accuracyCan determine first dose | Requires specialized PK modeling softwareExtra time to extract and input data and interpret outputRequires TDM specialists and/or clinical pharmacologistsBayesian dosing software programs DoseMeRx, Best Dose, ClinCalc, etc. |
| Machine learning | Allow computers to undertake complex tasks | Limited availability to large databases of concentration vs. time profiles |
There is also a recently introduced machine learning method. Machine learning models, such as XGBoost, are based on concentration–time profiles derived from population pharmacokinetic (POPPK) models.
For any method, laboratories consistency is required as concentration may varies because of analytical methods. MPA concentration measurement are usually done by high-performance liquid chromatography (HPLC)–UV or liquid chromatography (LC)–MS which is more accurate but few places use immunoassays as an easy implementable and cost saving measures.53
Clinical applicabilityThere are substantial evidence linking MPA exposure to rejection outcomes, and ongoing controversy likely stems from the complexity involved in AUC monitoring and practical challenges in clinical implementation. To overcome these barriers and achieve significant outcomes, limited sampling strategies (LSS) and modern monitoring approaches have been proposed.54–59 See Table 3 for emerging evidence of individualized MMF dosing. While more than 70–80% data published employed LSS by either MLR and Bayesian estimation methods, a simpler and more widespread approach using limited sample trapezoid AUC approach may find a better alternative and applicability in transplant clinics. It is important to note that statistical approach using computation of mean prediction error (MPE), root mean squared prediction error (RMSE) and agreement between newer and standard method, is essential for determining predictive accuracy and validating newer monitoring methods.
Emerging evidence of individualized MMF dosing.
| Study | Method | Aim | Results |
|---|---|---|---|
| Sobiak J et al., 2021 | Systematic review27/55 LSS studies of adult kidney transplantation | AUC exposure determined using MLR based LSSCritical time points assessed | Best points of estimation for and adult transplantation: C0 C0.5 C1 C4 and C0 C1 C2 C4 |
| Labriffe, M et al., 2023 | Retrospective data4051 dose adjustment requests (1051 paediatric patients) | Bayesian estimators. Using T20min, T1h, and T3h are the limited sampling strategiesAUC exposure determination | 1st mns post KTP: 50% AUCs in the target range. Under-over-exposed by 39% and 3% in 1st and 30% and 20% in 2nd & 3rd months |
| Meziyerh et al., 2023 | Randomised study968 adult transplant recipients, long term impact | Tac-AUC75–95ngh/mLMPA exposure 30–60mgh/L | 3.6% biopsy-proven rejection between 1st and 3rd year post transplant |
| Villeneuve et al., 2024 | Retrospective study341 KTRs in study group (precision dosing) and the 392-control group | Bayesian estimates for AUC 20min, 1h and 3hAUC target 45 vs. control group (fixed dosing) | At 3 years, rejection-free survival 91.2% and 80.6% (p<0.001) and the cumulative incidence of rejection 5.08% vs. 12.7% per patient×year (hazard ratio=0.49 (0.34, 0.71), p<0.001) |
A traditional TDM AUC based approach has several limitations. In addition to practical challenges such as the need for multiple sampling points, increased costs, the requirement for specialized pharmacokinetic modelling software, and the necessity to wait for steady-state concentration, there is a general lack of clinician awareness regarding AUC methods and their optimal use. Furthermore, clear evidence is lacking in elderly populations and in longitudinal exposure data for children. More research is also needed on monitoring the exposure of enteric-coated MMF, as current evidence remains limited.
Practical recommendations for routine clinical practiceThe efficacy of MPA monitoring compared to fixed dosing in reducing graft rejection has been demonstrated by numerous studies. Based on the available scientific evidence, the following suggestions are proposed
- 1.
MMF is commonly used in combination with either tacrolimus or cyclosporine, with or without glucocorticoids and a target MPA AUC0–12h of 30–60mgh/L is considered optimal and should be maintained to protect functioning graft. Although a definitive relationship between MPA exposure and toxicity has not been established, it is generally accepted that MPA AUC exposure should not exceed 60mgh/L in stable patients as a practical safety measure. In routine practice, daily dose of MMF for adult kidney transplant recipients (KTR) is 2g and for EC-MMF formulation, a dose of 720mg is considered equivalent to 1g of MMF. In paediatric KTRs, the currently recommended dose ranges from 600 to 1200mg/m2 of body surface area per day, administered in two divided doses.
- 2.
Guidelines are needed to support and standardize MPA monitoring, particularly within the first month and first year after transplantation. Since dose-exposure variation persists long-term, extended monitoring recommendations are also warranted.
- 3.
Limited sampling strategies are feasible and should be adopted for AUC estimation to reduce the burden of full-profile pharmacokinetic sampling.
- 4.
Further evidences are required to determine the applicability of AUC monitoring for enteric-coated mycophenolate (EC-MPA) formulations in patients on modern triple immunosuppressive regimens.
- 5.
Age-related considerations: while current data suggest age has no significant impact on MPA exposure, more longitudinal data and specific monitoring strategies are needed for vulnerable populations, particularly paediatric patients. In the elderly population, further evidence is also required to guide dosing and monitoring approaches.
Tacrolimus (TAC, FK506) is the preferred immunosuppressive drug following kidney transplantation, chosen over cyclosporine due to its superior efficacy and minimal cosmetic side effects.60 However, it is important to note that adverse reactions such as nephrotoxicity, neurotoxicity, diabetes, and dyslipidemia are not uncommon, even with routine trough-level monitoring. Tacrolimus exerts its effects by binding to the intracellular protein FKBP-12, which forms a complex with calcium, calmodulin, and calcineurin. This complex inhibits the phosphatase activity of calcineurin, preventing the translocation of nuclear factor of activated T-cells (NF-AT), thereby inhibiting the formation of lymphokines (such as interleukin-2 and gamma interferon) and the activation of T-lymphocytes.61
A key aspect of tacrolimus metabolism involves the critical enzymes CYP3A4 and CYP3A5. It is metabolized in the liver and gastrointestinal (GI) tract by these enzymes.62 The dose–concentration disparities observed among individuals are influenced by factors such as CYP enzyme activities, haematocrit, plasma protein levels, renal function, time post-transplantation, and the co-administration of other drugs and food items.63 Allelic variations in the CYP3A5 gene are observed in up to 95% of Caucasians and 33% of African Americans.64 Individuals with CYP3A5 expressor genotypes exhibit a higher rate of tacrolimus clearance, resulting in lower-than-desired drug exposure.
Emerging evidences for tacrolimus exposure using AUC-guided dosingTacrolimus concentration is commonly monitored through a single sample trough (C0) concentration. However, emerging data have led to the recommendation of tacrolimus AUC monitoring, particularly in the early period following transplantation, to better assess drug exposure.59,65 Studies have shown variable associations between trough concentrations and tacrolimus AUC exposure. In some individuals, an AUC three times higher than the normal range (75–225mcgh/L) was observed, even when trough concentrations were within the range of 5–10mcg/L, with a corresponding increase in toxicities. Pharmacogenetic variations contribute to inter-individual (20%–60%) and intra-individual (10%–40%) variability in tacrolimus exposure.64
AUC monitoring has proven valuable, demonstrating superior correlation with clinical outcomes when using a posteriori Bayesian estimation method, which rely on POPPK models and a limited number of blood samples.66
A minimal AUC0–12 threshold of 150ngh/mL has been recommended to guide dosing for the twice-daily tacrolimus formulation in adults. In a prospective study of 80 patients, a higher proportion of patients achieved therapeutic target concentrations with computerized dosing during the first eight weeks post-transplantation compared to conventional dosing [medians: 90% (95% confidence interval [CI], 84–95%) vs. 78% (95% CI, 76–82%), respectively, p<0.001]. In high-risk patients, the results were even convincing [medians: 77% (95% CI, 71–80%) vs. 59% (95% CI, 40–74%), respectively, p=0.04].67 A study by Meziyerh et al. demonstrated that 3.6% out of 968 KTRs experienced biopsy-proven acute rejection (BPAR) between years 1 and 3 post-transplant recipients and recommended target range for Tac-AUC0–12h and C0 at 1 year 75–95ngh/mL and 5–7ng/mL respectively. The Tac-AUC0–12h predicted better BPAR and over- or underexposure despite adequate Tac-C0.35 Another recent randomized study by Lloberas et al. validated a population pharmacokinetic (PPK) Bayesian model that incorporated pharmacogenetics (CYP3A4/CYP3A5 clusters), age, and hematocrit. Study determined Tac starting and subsequent dose adjustments in 90 kidney transplant recipients within 90 days after transplants. Bayesian AUC group vs. control group (trough): a significantly higher percentage of patients achieving the target range (54.8%), less intra-patient variability, less dose modifications and a shorter time to reach the target level (5 days) vs. control (20.8%) and (10 days), respectively.68 Woillard et al., prospective study of 1325 transplant recipients, demonstrated that the AUC/C0 ratio yields low intra-individual variability in stable patients as compared to AUC alone and trough concentrations.69
The AUC concentrations corresponding to trough levels have been proposed as follows: AUC0–12 of 75–140ngh/mL for a trough of 3–7ng/mL, 100–190ngh/mL for 5–10ng/mL, and 180–270ngh/mL for 10–15ng/mL. For single-dose tacrolimus formulations, the corresponding AUC targets with trough levels are 150–275ngh/mL for a trough of 3–7ng/mL, 180–350ngh/mL for 5–10ng/mL, and 310–475ngh/mL for 10–15ng/mL.67–70 A single-dose tacrolimus formulation has recently gained attention to improve patient adherence. A systematic review found no significant difference in clinical outcomes or tacrolimus toxicity between single-dose and conventional twice-daily dosing.71
ConclusionsImmunosuppression plays a crucial role in the short-term improvement of outcomes for kidney transplant recipients. However, benefits in long-term outcome remains limited. A comprehensive understanding of the evidence, precision pharmacokinetic monitoring, and AUC-based strategies combined with modern approaches is crucial to tackle graft failure and reducing drug-related toxicities. In this review, we discuss the evidence surrounding AUC exposure, the controversies of MPA monitoring, drug pharmacokinetics, monitoring approaches and newer supportive evidence. Although cost burdens and limited resources pose significant barriers in low-income countries, gaining an understanding of AUC concepts and modern precision dosing approaches is critical. The clinical application of these practices could potentially improve long-term outcomes following kidney transplantation.
FundingPrimary author is a PhD scholar, and PhD is funded by Monash university, Victoria, Australia. No funding and financial support for the preparation of the article and the writing the draft is involved.
Conflict of interestThe authors declare that they have no conflict of interest.