


To determine the possible relationship between macrophage phenotypes and the progression of kidney disease in patients with lupus nephritis (LN).
MethodsUsing immunohistochemistry, CD68+ and CD163+ cells were counted per glomerulus and per high-power field in the tubulointerstitium. Progression was defined as a doubling of the serum creatinine level and/or progression to end-stage kidney disease.
ResultsAmong the 21 patients, 52% had class III or IV LN. During the median follow-up of 88 months, 5 (23.8%) patients experienced progression. In terms of clinical and pathological markers, the only significant difference between progressors and nonprogressors was the number of interstitial CD163+ cells (median 4 versus 2.4, respectively; p=0.025). A cutoff value of 2.7 for the mean number of CD163+ cells in the interstitium yielded a sensitivity of 80% and specificity of 75% for progression. The estimated median time to progression among patients with ≥2.7 CD163+ cells was shorter (median 136 versus 202 months, p=0.023). A greater number of CD163+ cells in the kidney interstitium was associated with the progression of kidney disease (HR 2.88, 95% CI 1.22–6.80; p=0.016). Class III–IV LN was associated with a higher median number of glomerular CD163+ cells (OR 1.96, 95% CI 1.1–3.49, p=0.023). Endocapillary hypercellularity and extracapillary proliferation were associated with greater number of CD163+ cells in the glomerular area. Among patients with class III-IV LN, the number of interstitial CD68+ cells was greater in those who experienced progression of kidney disease (p=0.012).
ConclusionA greater number of CD163+ cells in the kidney interstitium was associated with the progression of kidney disease in patients with LN, while a greater number of CD68+ cells in the interstitium was associated with progression in the subgroup of patients with class III-IV LN.
Determinar la posible relación entre los fenotipos de macrófagos y la progresión de la enfermedad renal en pacientes con nefritis lúpica (NL).
MétodosMediante inmunohistoquímica, se contaron células CD68+ y CD163+ por glomérulo y por campo de gran aumento en el tubulointersticio. La progresión se definió como una duplicación del nivel de creatinina sérica o progresión a enfermedad renal terminal.
ResultadosEntre los 21 pacientes, el 52% tenía NL de clase iii o iv. Durante la mediana de seguimiento de 88 meses, 5 (23,8%) pacientes experimentaron progresión. En términos de marcadores clínicos y patológicos, la única diferencia significativa entre los pacientes que progresaron y los que no progresaron fue el número de células intersticiales CD163+ (mediana de 4 frente a 2,4, respectivamente; p=0,025). Un valor de corte de 2,7 para el número medio de células CD163+ en el intersticio arrojó una sensibilidad del 80% y una especificidad del 75% para la progresión. El tiempo medio estimado hasta la progresión entre los pacientes con ≥2,7 células CD163+ fue más corto (mediana de 136 frente a 202 meses; p=0,023). Un mayor número de células CD163+ en el intersticio renal se asoció con la progresión de la enfermedad renal (HR 2,88; IC 95%: 1,22-6,80; p=0,016). La NL de clase iii-iv se asoció con un mayor número medio de células CD163+ glomerulares (OR 1,96; IC 95%: 1,1-3,49; p=0,023). L’ipercellularità endocapillare e la proliferazione extracapillare sono state associate a un maggior numero di cellule CD163+ nell’area glomerulare. Entre los pacientes con NL de clase iii-iv, el número de células CD68+ intersticiales fue mayor en aquellos que experimentaron progresión de la enfermedad renal (p=0,012).
ConclusiónUn mayor número de células CD163+ en el intersticio renal se asoció con la progresión de la enfermedad renal en pacientes con NL, mientras que un mayor número de células CD68+ en el intersticio se asoció con la progresión en el subgrupo de pacientes con NL de clase iii-iv.
Systemic lupus erythematosus (SLE) is a systemic autoimmune disease, and half of patients suffer from kidney involvement.1 Lupus nephritis (LN) is known to be one of the most crucial conditions that determines patient outcomes2 and is the cause of initial presentation in many patients with SLE.3 The mortality associated with SLE is significantly greater in patients with LN than in those without LN. Due to insufficient control of SLE disease activity and the consequences of hemodynamic and metabolic overload of the remaining nephrons, 10–30% of patients with LN progress to kidney failure requiring dialysis or kidney transplant.1,4
The pathophysiology of SLE is complex, and both the innate and adaptive immune systems are involved. A multiple hit model has been proposed for the development of LN.4 Environmental and hormonal factors increase the risk of lupus nephritis development in the presence of genetic factors. This results in the development of anti-dsDNA antibodies and immune complex generation. Immune complexes deposit in the glomerular and tubulointerstitial areas, leading to kidney injury. Kidney injury occurs primarily due to the recruitment of monocytes and complement-dependent damage. In the initial proinflammatory environment, monocytes polarize toward proinflammatory macrophages (M1 phenotype). Regulatory macrophage polarization (M2) is induced through clear apoptotic cell remnants and immune complexes, and M2 macrophages play roles in anti-inflammatory and profibrotic pathways. Macrophage polarization toward these different phenotypes depends on microenvironmental triggers, including cytokines, chemokines, pathogens, and the predominant type of cell death.5 Polarization across these phenotypes is common during the course of different disorders,6,7 and these processes are reproduced in kidney injury and repair.8 Inadequate removal of apoptotic cell residues is involved in the pathogenesis of SLE, and this may lead to the abundant presence of profibrotic regulatory macrophages in the kidney, accelerating the progression of chronic kidney disease.4
The number of studies assessing the possible roles of macrophage phenotype and function in predicting the severity of LN and evaluating macrophages as therapeutic targets has been increasing.9–24 The levels of some macrophage markers may correlate with the clinical and histological severity of the disease. Using proteomics data, Louis Sam Titus et al. found that CD163+ macrophages were one of several dominant markers in the glomeruli of patients with LN compared to control patients, and this finding was similar in the tubulointerstitium.25 Urine-soluble CD163 is released from alternatively activated (M2) macrophages and is involved in the resolution of inflammation in glomeruli.15 Studies have shown that urine CD163 levels are correlated with more severe clinical findings,15 more severe glomerular inflammation13 and response to therapy.18 Although these studies confirmed the correlation between macrophage markers and disease activity scores and histological severity, whether these markers can be used as a means to predict kidney outcomes has largely not been studied. This study was performed to test this hypothesis.
MethodsPatient populationPatients who underwent kidney biopsy at our institution and had a diagnosis of LN between 2001 and 2020 were included. All the patients had a previous diagnosis of SLE prior to the kidney biopsy procedure. Medical records were obtained from medical files and the electronic system of the hospital. The date of renal biopsy was established as the baseline. The follow-up time was calculated from the interval between the biopsy date and the last clinic visit or end stage kidney disease (ESKD). In addition to the results for patients with LN, a comparison of macrophage counts was also made between patients with LN and a subgroup of patients with diabetic nephropathy alone.
The inclusion criteria were as follows:
- •
Age≥18,
- •
Diagnosis of LN on kidney biopsy,
- •
The follow-up time was >6 months after the date of kidney biopsy.
Exclusion criteria were as follows:
- •
Inadequate biopsy sample,
- •
Unavailable clinical data,
- •
Severe chronicity, including class VI LN,
- •
Concurrent histological diagnosis.
The estimated glomerular filtration rate (eGFR) was expressed in mL/min/1.73m2 and calculated according to the Chronic Kidney Disease Epidemiology Collaboration (CKD-EPI) formula.26 Treatments were given based on the assessment of the attending physician and were not standardized. A permanent doubling in serum creatinine and/or progression to ESKD was defined as progression. At least partial remission was considered remission. This was defined as an achievement of a reduction in proteinuria of at least 50% to <3g/g measured as the protein/creatinine ratio (by 24h of urine collection) and stabilization or improvement in kidney function (±10–15% of baseline) within 6–12 months of starting therapy.27
Histopathological evaluationHistopathological renal biopsy data were retrieved from previous pathology reports. Renal biopsy specimens were previously evaluated by direct immunofluorescence and light microscopy during routine examination of the biopsies. The minimum number of glomeruli required for light microscopy and immunofluorescence microscopy were set to 10 and 3, respectively. Tissue sections were examined by two independent pathologists. Specimens were evaluated with hematoxylin–eosin, Masson's trichrome, periodic acid–Schiff, and methenamine silver-stained sections by light microscopy and stained with antibodies against immunoglobulin G (IgG), immunoglobulin A (IgA), immunoglobulin M (IgM), complement 3c, C1q, kappa and lambda for immunofluorescence. The classification of LNs was based on consensus definitions.28 In the presence of a combination of class III and class V LN or class IV and class V LN, these combinations were classified as class III and class IV, respectively. Activity and chronicity were evaluated based on the modified National Institute of Health index.28
ImmunohistochemistryMacrophage markersKidney sections were stained with anti-CD68 (Cell Marque, CD68 [Kp-1] Mouse Monoclonal Antibody, Catalog no. CMC16829040) and anti-CD163 (Leica/Novocastra, CD163 [10D6] Monoclonal Antibody, Catalog no. PA0090) antibodies. All glomeruli were evaluated for the number of cells that stained positive with these antibodies. The mean number of positive cells per glomerulus was recorded. Positive cells in the glomerular, tubular, and interstitial compartments were counted. The results are expressed as cells/glomerulus and cells/high microscopic field. Time zero kidney allograft biopsy from living donors were used as negative controls. The number of CD163-positive and CD68-positive cells in the glomerular area was expressed as the number of positive cells per glomerulus. The number of these cells in the tubulointerstitial area was expressed as the number of positive cells per high power field. Five fields were analyzed and the mean cell number was calculated. Only the cortical compartment was evaluated since only a subgroup of patients had adequate medullary biopsy. Histopathological evaluation was performed by 2 independent pathologists, and an agreement was reached between them after discussion.
Statistical analysisQuantitative variables are expressed as medians with ranges. Qualitative variables are expressed as proportions. The means of the groups were compared using the Mann–Whitney U test. Chi-squared tests were used for comparisons between proportions. Survival rates and survival times were tested using the log-rank test. Receiver operating characteristic curves were used to determine the cutoff for the number of cells while defining particular macrophage phenotypes. Logistic regression analysis was performed to evaluate predictors of glomerular and interstitial CD68+ or CD163+ cell phenotypes. Cox regression analysis was performed to determine hazard ratios for associations between macrophage numbers and the progression of kidney disease. Statistical analysis was performed using SPSS version 22.0 (IBM SPSS, Chicago, IL). A p value of 0.05 was considered to indicate statistical significance.
Ethical considerationsThis study was approved by the Ethics Committee of Dokuz Eylül University (5482-GOA 2021/07-30) and was conducted in accordance with the Declaration of Helsinki and the International Conference for Harmonization. All data extracted from the medical records were stored de-identified prior to the analysis. Informed consent was not obtained due to the retrospective study design.
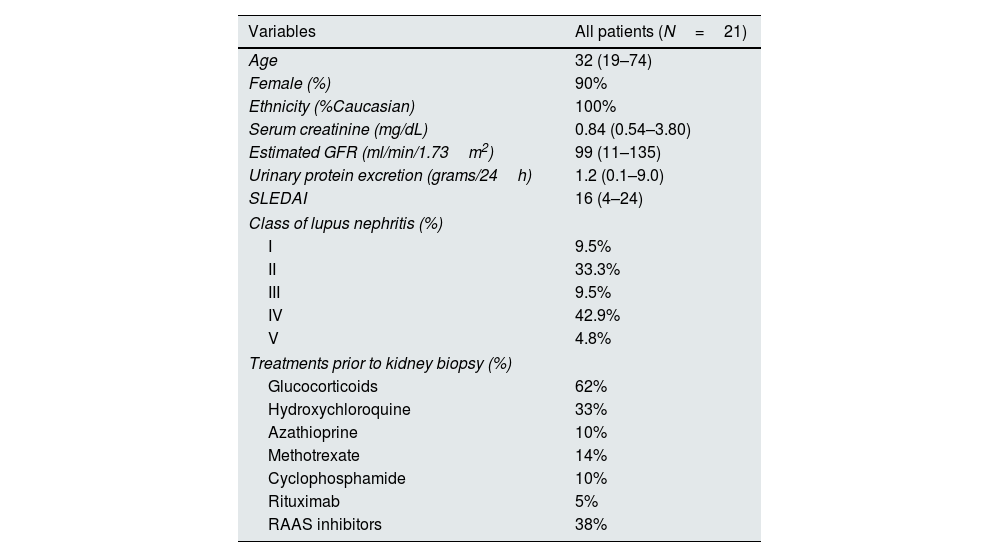
ResultsOf the 21 patients with LN, 19 (90%) were female, and the median age was 32 years (range, 19–74). The median SLEDAI (Systemic Lupus Erythematous Disease Activity Index) score was 16 (4–24). Thirteen (62%) patients were receiving glucocorticoids at the time of kidney biopsy, while fewer patients were treated with other options. Class III and IV lupus nephritis comprised 52% of patients. The clinical and histological characteristics of the patients are shown in Table 1.
General characteristics of the patients.
| Variables | All patients (N=21) |
|---|---|
| Age | 32 (19–74) |
| Female (%) | 90% |
| Ethnicity (%Caucasian) | 100% |
| Serum creatinine (mg/dL) | 0.84 (0.54–3.80) |
| Estimated GFR (ml/min/1.73m2) | 99 (11–135) |
| Urinary protein excretion (grams/24h) | 1.2 (0.1–9.0) |
| SLEDAI | 16 (4–24) |
| Class of lupus nephritis (%) | |
| I | 9.5% |
| II | 33.3% |
| III | 9.5% |
| IV | 42.9% |
| V | 4.8% |
| Treatments prior to kidney biopsy (%) | |
| Glucocorticoids | 62% |
| Hydroxychloroquine | 33% |
| Azathioprine | 10% |
| Methotrexate | 14% |
| Cyclophosphamide | 10% |
| Rituximab | 5% |
| RAAS inhibitors | 38% |
GFR: glomerular filtration rate; RAAS: Renin–Angiotensin Aldosterone System; SLEDAI: The Systemic Lupus Erythematosus Disease Activity Index.
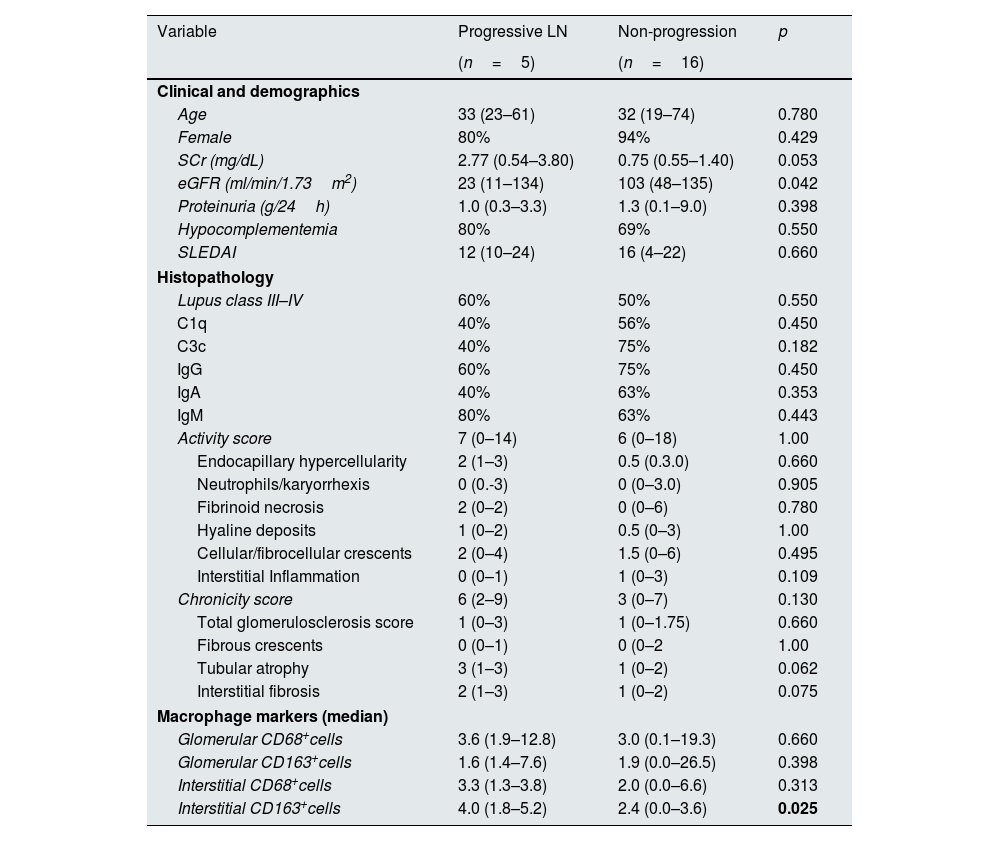
During the median follow-up of 88 (6–190) months, 5 (23.8%) patients experienced progression of kidney disease. Of these 5 patients, 3 received hemodialysis within the first month following kidney biopsy and could not undergo dialysis during follow-up. Of the remaining 2 patients, one progressed to ESKD, and hemodialysis was initiated, while the other progressed to chronic kidney disease (CKD) but did not require renal replacement therapy. Table 2 shows the clinical and histological characteristics of patients who experienced progression and those who did not. The only significant difference between progressors and non-progressors was the number of interstitial CD163+ cells (median 4 versus 2.4, respectively, p=0.025, Fig. 1). The numbers of glomerular CD68+ and CD163+ cells and interstitial CD68+ cells were comparable between these groups.
Associations between macrophage markers and progressive lupus nephritis.
| Variable | Progressive LN | Non-progression | p |
|---|---|---|---|
| (n=5) | (n=16) | ||
| Clinical and demographics | |||
| Age | 33 (23–61) | 32 (19–74) | 0.780 |
| Female | 80% | 94% | 0.429 |
| SCr (mg/dL) | 2.77 (0.54–3.80) | 0.75 (0.55–1.40) | 0.053 |
| eGFR (ml/min/1.73m2) | 23 (11–134) | 103 (48–135) | 0.042 |
| Proteinuria (g/24h) | 1.0 (0.3–3.3) | 1.3 (0.1–9.0) | 0.398 |
| Hypocomplementemia | 80% | 69% | 0.550 |
| SLEDAI | 12 (10–24) | 16 (4–22) | 0.660 |
| Histopathology | |||
| Lupus class III–IV | 60% | 50% | 0.550 |
| C1q | 40% | 56% | 0.450 |
| C3c | 40% | 75% | 0.182 |
| IgG | 60% | 75% | 0.450 |
| IgA | 40% | 63% | 0.353 |
| IgM | 80% | 63% | 0.443 |
| Activity score | 7 (0–14) | 6 (0–18) | 1.00 |
| Endocapillary hypercellularity | 2 (1–3) | 0.5 (0.3.0) | 0.660 |
| Neutrophils/karyorrhexis | 0 (0.-3) | 0 (0–3.0) | 0.905 |
| Fibrinoid necrosis | 2 (0–2) | 0 (0–6) | 0.780 |
| Hyaline deposits | 1 (0–2) | 0.5 (0–3) | 1.00 |
| Cellular/fibrocellular crescents | 2 (0–4) | 1.5 (0–6) | 0.495 |
| Interstitial Inflammation | 0 (0–1) | 1 (0–3) | 0.109 |
| Chronicity score | 6 (2–9) | 3 (0–7) | 0.130 |
| Total glomerulosclerosis score | 1 (0–3) | 1 (0–1.75) | 0.660 |
| Fibrous crescents | 0 (0–1) | 0 (0–2 | 1.00 |
| Tubular atrophy | 3 (1–3) | 1 (0–2) | 0.062 |
| Interstitial fibrosis | 2 (1–3) | 1 (0–2) | 0.075 |
| Macrophage markers (median) | |||
| Glomerular CD68+cells | 3.6 (1.9–12.8) | 3.0 (0.1–19.3) | 0.660 |
| Glomerular CD163+cells | 1.6 (1.4–7.6) | 1.9 (0.0–26.5) | 0.398 |
| Interstitial CD68+cells | 3.3 (1.3–3.8) | 2.0 (0.0–6.6) | 0.313 |
| Interstitial CD163+cells | 4.0 (1.8–5.2) | 2.4 (0.0–3.6) | 0.025 |
Quantitave variables are represented as median with the range (min–max). eGFR: estimated glomerular filtration rate; IFTA: interstitial fibrosis/tubular atrophy; SCr: serum creatinine; SLEDAI: The Systemic Lupus Erythematosus Disease Activity Index.
, the median number of CD163+ cells in the glomerular area was 1.6 versus 1.9 (p=0.398), the median number of CD68+ cells in the interstitial area was 3.3 versus 2.0 (p=0.313), and the median number of CD163+ cells in the interstitial area was 4 versus 2.4 among patients with progression versus without progression (p=0.025).")
Median number of macrophages among patients who experienced progression of kidney disease versus those who did not. The median number of CD68+ cells in the glomerular area was 3.6 versus 3.0 (p=0.660), the median number of CD163+ cells in the glomerular area was 1.6 versus 1.9 (p=0.398), the median number of CD68+ cells in the interstitial area was 3.3 versus 2.0 (p=0.313), and the median number of CD163+ cells in the interstitial area was 4 versus 2.4 among patients with progression versus without progression (p=0.025).
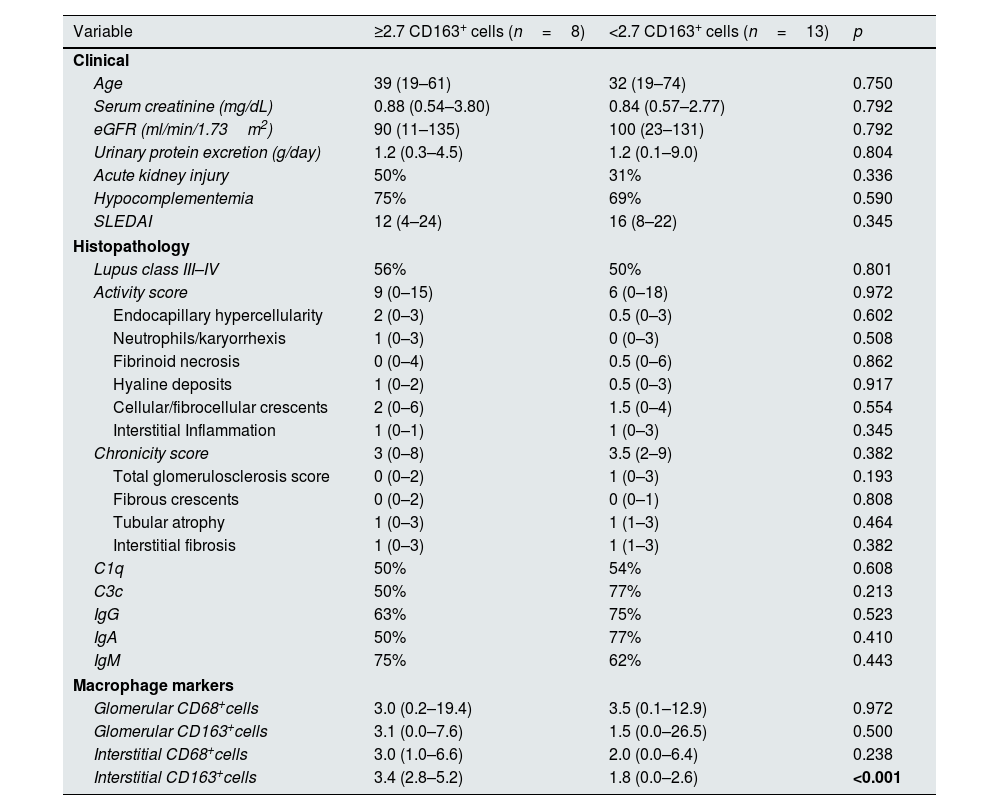
Fig. 2 shows the immunohistochemical evaluation of macrophage markers. Receiver operating characteristic curve analysis (AUC=0.831) revealed that a cutoff value of 2.7 for the mean number of CD163+ cells per high-power field in the kidney interstitium yielded a sensitivity of 80% and specificity of 75% for predicting the progression of kidney disease. Patients were divided into 2 groups according to this cutoff value. The estimated median time to progression of kidney disease among patients with ≥2.7 CD163+ cells in the kidney interstitium was 136 months compared to 202 months in those who had <2.7 CD163+ cells in the kidney interstitium (log rank, p=0.023). Table 3 shows the clinical and histological characteristics of the patient groups, which were classified based on the mean number of CD163+ cells per high-power field in the kidney interstitium.
, and CD163 (c and d) expression. Glomerular and interstitial regions are differentially involved, with images on the left showing less severe staining (IHC, original magnification ×40).")
Clinical and histological characteristics of patients with ≥2.7 CD163+ cells versus <2.7 CD163+ cells per high-power field in the kidney interstitium.
| Variable | ≥2.7 CD163+ cells (n=8) | <2.7 CD163+ cells (n=13) | p |
|---|---|---|---|
| Clinical | |||
| Age | 39 (19–61) | 32 (19–74) | 0.750 |
| Serum creatinine (mg/dL) | 0.88 (0.54–3.80) | 0.84 (0.57–2.77) | 0.792 |
| eGFR (ml/min/1.73m2) | 90 (11–135) | 100 (23–131) | 0.792 |
| Urinary protein excretion (g/day) | 1.2 (0.3–4.5) | 1.2 (0.1–9.0) | 0.804 |
| Acute kidney injury | 50% | 31% | 0.336 |
| Hypocomplementemia | 75% | 69% | 0.590 |
| SLEDAI | 12 (4–24) | 16 (8–22) | 0.345 |
| Histopathology | |||
| Lupus class III–IV | 56% | 50% | 0.801 |
| Activity score | 9 (0–15) | 6 (0–18) | 0.972 |
| Endocapillary hypercellularity | 2 (0–3) | 0.5 (0–3) | 0.602 |
| Neutrophils/karyorrhexis | 1 (0–3) | 0 (0–3) | 0.508 |
| Fibrinoid necrosis | 0 (0–4) | 0.5 (0–6) | 0.862 |
| Hyaline deposits | 1 (0–2) | 0.5 (0–3) | 0.917 |
| Cellular/fibrocellular crescents | 2 (0–6) | 1.5 (0–4) | 0.554 |
| Interstitial Inflammation | 1 (0–1) | 1 (0–3) | 0.345 |
| Chronicity score | 3 (0–8) | 3.5 (2–9) | 0.382 |
| Total glomerulosclerosis score | 0 (0–2) | 1 (0–3) | 0.193 |
| Fibrous crescents | 0 (0–2) | 0 (0–1) | 0.808 |
| Tubular atrophy | 1 (0–3) | 1 (1–3) | 0.464 |
| Interstitial fibrosis | 1 (0–3) | 1 (1–3) | 0.382 |
| C1q | 50% | 54% | 0.608 |
| C3c | 50% | 77% | 0.213 |
| IgG | 63% | 75% | 0.523 |
| IgA | 50% | 77% | 0.410 |
| IgM | 75% | 62% | 0.443 |
| Macrophage markers | |||
| Glomerular CD68+cells | 3.0 (0.2–19.4) | 3.5 (0.1–12.9) | 0.972 |
| Glomerular CD163+cells | 3.1 (0.0–7.6) | 1.5 (0.0–26.5) | 0.500 |
| Interstitial CD68+cells | 3.0 (1.0–6.6) | 2.0 (0.0–6.4) | 0.238 |
| Interstitial CD163+cells | 3.4 (2.8–5.2) | 1.8 (0.0–2.6) | <0.001 |
SLEDAI: The Systemic Lupus Erythematosus Disease Activity Index; eGFR: estimated glomerular filtration rate.
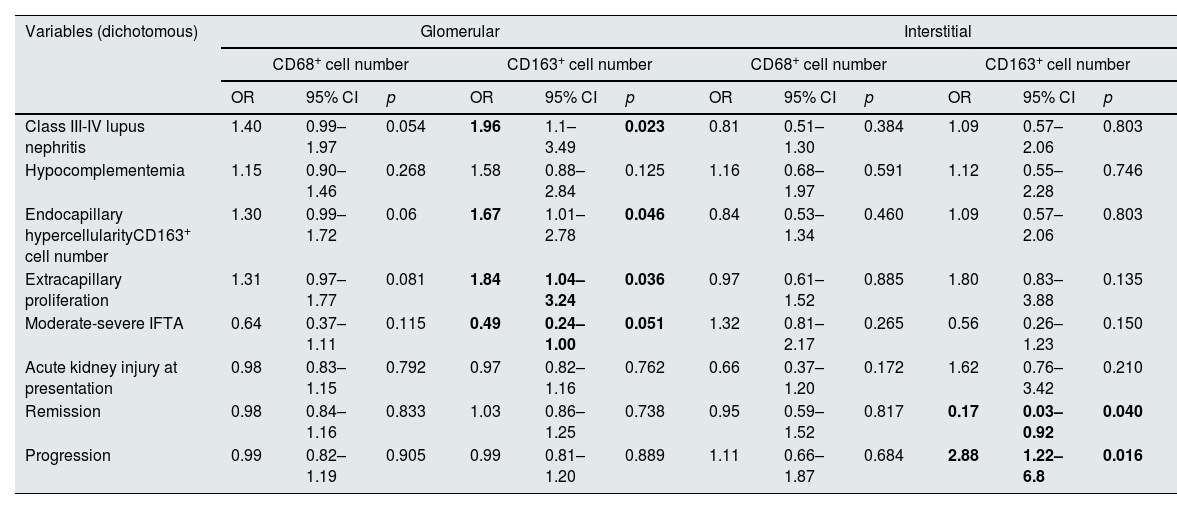
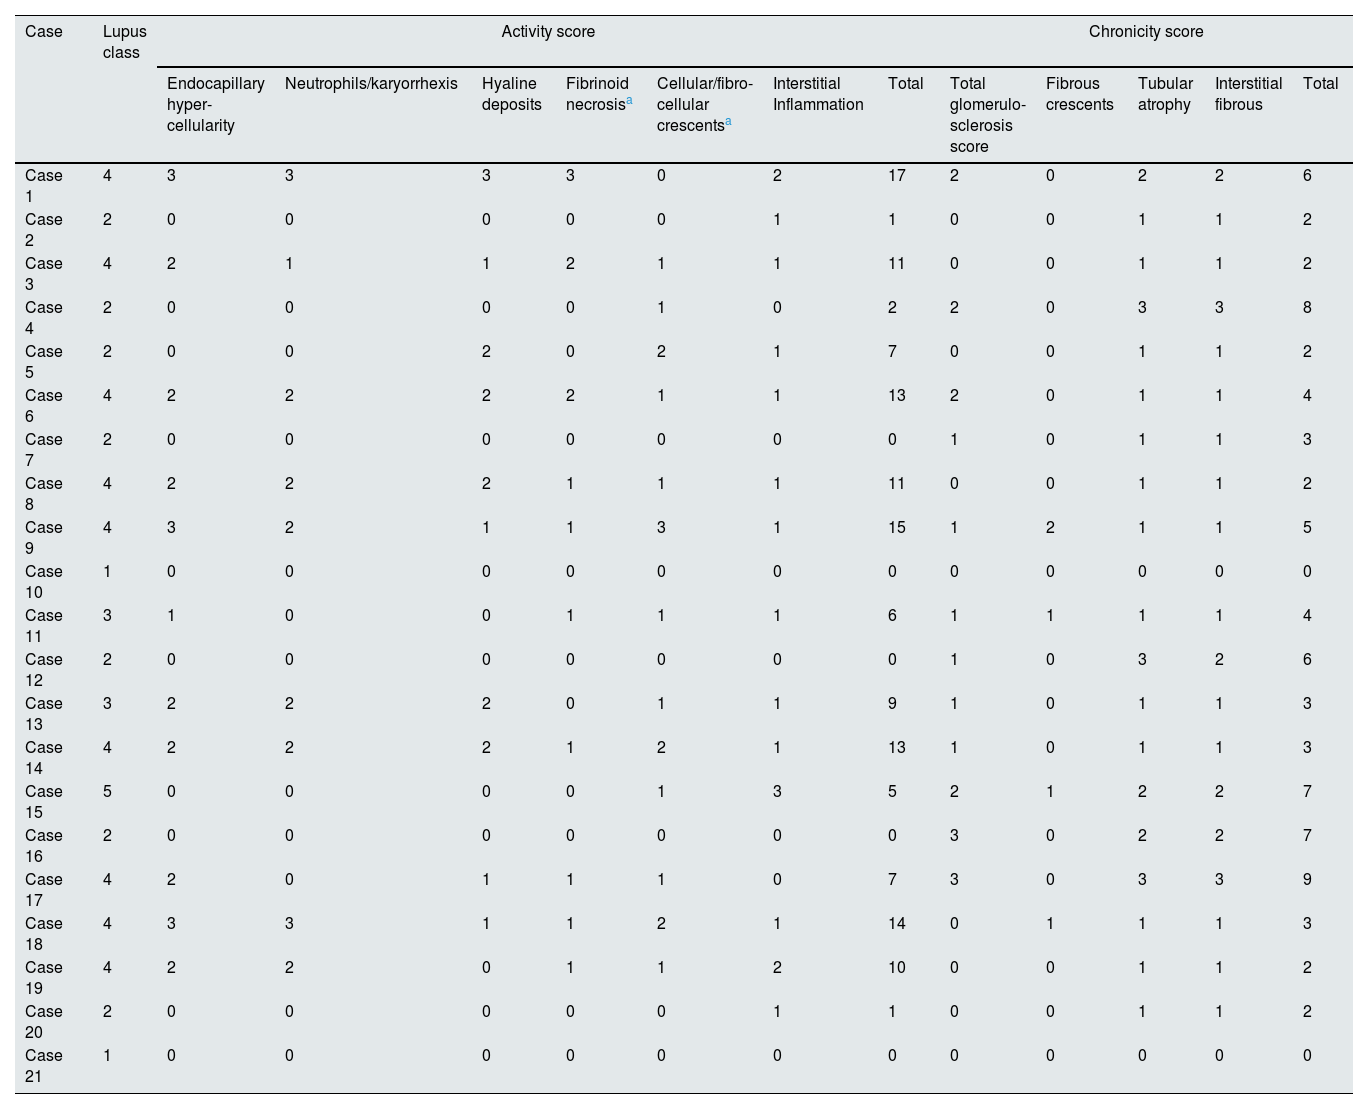
Table 4 shows the associations between various clinical and histological characteristics and macrophage numbers according to the univariate regression model. Class III-IV LN and endocapillary hypercellularity was associated with a higher median number of glomerular CD163+ cells (OR 1.96, 95% CI 1.1–3.49, p=0.023, OR 1.67, 95% CI 1.01–2.78, p=0.046). Extracapillary proliferation was associated with a greater number of glomerular CD163+ cells (OR 1.84, 95% CI 1.04–3.24, p=0.036), while moderate to severe IFTA was associated with a lower number of glomerular CD163+ cells (OR 0.49, 95% CI 0.24–1.00, p=0.051). A greater number of CD163+ cells in the kidney interstitium was associated with the progression of kidney disease ((HR 2.88, 95% CI 1.22–6.80, p=0.016, 95% CI 1.22–6.80, p=0.016) and the absence of remission (OR 0.17, OR 0.03–0.92, p=0.040). There was no significant association between the number of glomerular or interstitial CD68+ cells and any of the clinical or histological characteristics. Table 5 shows histological characteristics of all cases. We could not demonstrate a significant association between activity and chronicity scores based on the modified NIH index and particular macrophage counts. Among patients with LN classes III and IV, the number of interstitial CD68+ cells was greater in those who experienced progression of kidney disease (p=0.012) Based on previous literature, we separately performed an analysis for the relationship between endocapillary hypercellularity and ≥7 CD68+ cells per glomerulus.10,29 Six of 7 (86%) patients who had ≥7 CD68+ cells per glomerulus had endocapillary hypercellularity, while 5 of 14 (36%) patients who had <7 CD68+ cells per glomerulus had endocapillary hypercellularity (p=0.031).
Associations between different clinical and histological characteristics and the numbers of glomerular and interstitial macrophages.
| Variables (dichotomous) | Glomerular | Interstitial | ||||||||||
|---|---|---|---|---|---|---|---|---|---|---|---|---|
| CD68+ cell number | CD163+ cell number | CD68+ cell number | CD163+ cell number | |||||||||
| OR | 95% CI | p | OR | 95% CI | p | OR | 95% CI | p | OR | 95% CI | p | |
| Class III-IV lupus nephritis | 1.40 | 0.99–1.97 | 0.054 | 1.96 | 1.1–3.49 | 0.023 | 0.81 | 0.51–1.30 | 0.384 | 1.09 | 0.57–2.06 | 0.803 |
| Hypocomplementemia | 1.15 | 0.90–1.46 | 0.268 | 1.58 | 0.88–2.84 | 0.125 | 1.16 | 0.68–1.97 | 0.591 | 1.12 | 0.55–2.28 | 0.746 |
| Endocapillary hypercellularityCD163+ cell number | 1.30 | 0.99–1.72 | 0.06 | 1.67 | 1.01–2.78 | 0.046 | 0.84 | 0.53–1.34 | 0.460 | 1.09 | 0.57–2.06 | 0.803 |
| Extracapillary proliferation | 1.31 | 0.97–1.77 | 0.081 | 1.84 | 1.04–3.24 | 0.036 | 0.97 | 0.61–1.52 | 0.885 | 1.80 | 0.83–3.88 | 0.135 |
| Moderate-severe IFTA | 0.64 | 0.37–1.11 | 0.115 | 0.49 | 0.24–1.00 | 0.051 | 1.32 | 0.81–2.17 | 0.265 | 0.56 | 0.26–1.23 | 0.150 |
| Acute kidney injury at presentation | 0.98 | 0.83–1.15 | 0.792 | 0.97 | 0.82–1.16 | 0.762 | 0.66 | 0.37–1.20 | 0.172 | 1.62 | 0.76–3.42 | 0.210 |
| Remission | 0.98 | 0.84–1.16 | 0.833 | 1.03 | 0.86–1.25 | 0.738 | 0.95 | 0.59–1.52 | 0.817 | 0.17 | 0.03–0.92 | 0.040 |
| Progression | 0.99 | 0.82–1.19 | 0.905 | 0.99 | 0.81–1.20 | 0.889 | 1.11 | 0.66–1.87 | 0.684 | 2.88 | 1.22–6.8 | 0.016 |
CI: confidence interval; IFTA: interstitial fibrosis/tubular atrophy; OR: odds ratio.
Histological characteristics of all cases.
| Case | Lupus class | Activity score | Chronicity score | ||||||||||
|---|---|---|---|---|---|---|---|---|---|---|---|---|---|
| Endocapillary hyper-cellularity | Neutrophils/karyorrhexis | Hyaline deposits | Fibrinoid necrosisa | Cellular/fibro-cellular crescentsa | Interstitial Inflammation | Total | Total glomerulo-sclerosis score | Fibrous crescents | Tubular atrophy | Interstitial fibrous | Total | ||
| Case 1 | 4 | 3 | 3 | 3 | 3 | 0 | 2 | 17 | 2 | 0 | 2 | 2 | 6 |
| Case 2 | 2 | 0 | 0 | 0 | 0 | 0 | 1 | 1 | 0 | 0 | 1 | 1 | 2 |
| Case 3 | 4 | 2 | 1 | 1 | 2 | 1 | 1 | 11 | 0 | 0 | 1 | 1 | 2 |
| Case 4 | 2 | 0 | 0 | 0 | 0 | 1 | 0 | 2 | 2 | 0 | 3 | 3 | 8 |
| Case 5 | 2 | 0 | 0 | 2 | 0 | 2 | 1 | 7 | 0 | 0 | 1 | 1 | 2 |
| Case 6 | 4 | 2 | 2 | 2 | 2 | 1 | 1 | 13 | 2 | 0 | 1 | 1 | 4 |
| Case 7 | 2 | 0 | 0 | 0 | 0 | 0 | 0 | 0 | 1 | 0 | 1 | 1 | 3 |
| Case 8 | 4 | 2 | 2 | 2 | 1 | 1 | 1 | 11 | 0 | 0 | 1 | 1 | 2 |
| Case 9 | 4 | 3 | 2 | 1 | 1 | 3 | 1 | 15 | 1 | 2 | 1 | 1 | 5 |
| Case 10 | 1 | 0 | 0 | 0 | 0 | 0 | 0 | 0 | 0 | 0 | 0 | 0 | 0 |
| Case 11 | 3 | 1 | 0 | 0 | 1 | 1 | 1 | 6 | 1 | 1 | 1 | 1 | 4 |
| Case 12 | 2 | 0 | 0 | 0 | 0 | 0 | 0 | 0 | 1 | 0 | 3 | 2 | 6 |
| Case 13 | 3 | 2 | 2 | 2 | 0 | 1 | 1 | 9 | 1 | 0 | 1 | 1 | 3 |
| Case 14 | 4 | 2 | 2 | 2 | 1 | 2 | 1 | 13 | 1 | 0 | 1 | 1 | 3 |
| Case 15 | 5 | 0 | 0 | 0 | 0 | 1 | 3 | 5 | 2 | 1 | 2 | 2 | 7 |
| Case 16 | 2 | 0 | 0 | 0 | 0 | 0 | 0 | 0 | 3 | 0 | 2 | 2 | 7 |
| Case 17 | 4 | 2 | 0 | 1 | 1 | 1 | 0 | 7 | 3 | 0 | 3 | 3 | 9 |
| Case 18 | 4 | 3 | 3 | 1 | 1 | 2 | 1 | 14 | 0 | 1 | 1 | 1 | 3 |
| Case 19 | 4 | 2 | 2 | 0 | 1 | 1 | 2 | 10 | 0 | 0 | 1 | 1 | 2 |
| Case 20 | 2 | 0 | 0 | 0 | 0 | 0 | 1 | 1 | 0 | 0 | 1 | 1 | 2 |
| Case 21 | 1 | 0 | 0 | 0 | 0 | 0 | 0 | 0 | 0 | 0 | 0 | 0 | 0 |
LN patients were grouped according to the severity of the chronicity findings by histology. Patients with moderate to severe interstitial fibrosis/tubular atrophy had significantly lower glomerular CD68+ and CD163+ cell numbers than those with mild to no IFTA (Supplemental Table 1). Interstitial macrophage counts were comparable between the two groups.
A comparison was made between LN patients with nonsevere chronicity by histology and a subgroup of patients with only diabetic nephropathy with nonsevere chronicity (Supplemental Table 2). Patients with diabetes had significantly greater CD163+ cell counts in the tubulointerstitium, while patients with LN had significantly greater CD68+ and CD163+ cell counts in the glomerular area (Fig. 3).
, while patients with lupus nephritis had greater CD68+ (3.2 versus 1, p=0.002) and CD163+ (3.1 versus 0.5, p=0.016) cells in the glomerular area.")
Median number of macrophages in patients with pure diabetic nephropathy versus lupus nephritis. Patients with diabetic nephropathy had greater CD163+ cells in the interstitium (6 versus 2.4, p<0.001), while patients with lupus nephritis had greater CD68+ (3.2 versus 1, p=0.002) and CD163+ (3.1 versus 0.5, p=0.016) cells in the glomerular area.
Although crucial roles of macrophages in the pathogenesis and progression of LN have been recognized, macrophage phenotypes determined by histology and their relationship with the progression of kidney disease have not been studied. Previous studies have shown a significant association between urinary CD163+ levels and severe LN in terms of both clinical and histological characteristics.13,18,24,30 This study adds to the knowledge by demonstrating such a relationship between macrophage markers determined by immunohistochemical microscopic analysis of kidney specimens and the progression of CKD. Of the numerous histological findings, interstitial CD163+ cell number was the sole factor that had a significant association with the progression of kidney disease, with a hazard ratio of 2.8.
Renal macrophages may have proinflammatory, anti-inflammatory and profibrotic features leading to inflammation, fibrosis and loss of kidney function.31,32 Treatments that alter macrophage functions have been shown to hasten various types of organ damage due to SLE.12,14,29,33 Following examination of the expression profiles of numerous inflammatory molecules in the perfused kidneys of treated mice and untreated mice at different stages of disease, Schiffer et al. reported that activated kidney macrophages are markers of disease onset and remission in patients with lupus nephritis.22 The authors suggested that treatment options that prevent both the activation of monocytes and their migration to the kidney are needed.22 Another study showed that the depletion of macrophages before acute renal injury reduces damage and depletion during the recovery and repair phases; however, it diminishes tubular cell proliferation and delays repair.8 These observations confirm the multiple roles of macrophages both during the development and resolution of renal disease.
CD163 is expressed by type 2 macrophages, which work against renal inflammation, promote tubular epithelial healing, and preserve kidney function.32 M2 macrophages are the predominant type of macrophage in LNs.31 The presence of glomerular macrophages in the early stages and tubulointerstitial infiltration in later stages reflects the progressive nature of lupus nephritis.22 There is a significant relationship between renal function loss, tubulointerstitial damage, and M2 macrophages.20 Our current study revealed an increased risk of renal disease progression with iCD163+ macrophages in the LNs. If there is inadequate phagocytosis of apoptotic cell debris by M2 macrophages, this debris, including DNA and phospholipids, may persist in kidney tissue, leading to an excessive anti-inflammatory response to counterbalance inflammation and further tissue damage and loss of kidney function.4 On the other hand, although the anti-inflammatory properties of M2 macrophages are generally prominent, Bach1-mediated reductions in heme oxygenase-1 expression, which can be induced in vitro by stimulation with type 1 interferons, may play a role in increasing inflammation.34 The composition of the macrophage subtypes in LNs is thought to vary depending on the stage of the disease and the timing of disease development, but this has not yet been fully elucidated. An association between crescentic LN cases and CD163 has been demonstrated and was associated with the activity index.31
Patients with class III-IV LN represent a particularly greater risk group for progression and are characterized by mesangial hypercellularity and endothelial proliferation. Demonstration of a biomarker that predicts progression among patients in this high-risk group would be interesting. Among patients with class III-IV LNs, the number of interstitial CD68+ cells were significantly greater in progressors. The number of glomerular CD163+ cells was significantly higher in class III-IV LN. CD68+ cells are generally known as proinflammatory macrophages; thus, we speculate that a greater number of CD68+ cells may indicate more severe inflammation. A greater number of particular macrophage phenotypes may be a sign of a more severe histologic grade, which in part might explain the greater risk of progression in these patients. The study by Dias et al. included fifty newly diagnosed patients with proliferative lupus nephritis, all of whom received prednisone and six pulses of cyclophosphamide as induction therapy.11 Progressors showed a greater number of CD68+ cells in kidney tubules, particularly in the interstitium, and a greater chronicity index.
Our results showed that patients with pure diabetic nephropathy had greater numbers of macrophages in the tubulointerstitium, while patients with LN had greater numbers of macrophages in the glomerular region. This conclusion was reached after comparisons between patients with similar chronicity grades. This may reflect a more prominent involvement of the innate and adaptive immune systems, especially macrophages, in the pathogenesis of LN. One mechanism for the progression of kidney disease in glomerulonephritis is that it occurs via tubulointerstitial disease. This is known as the glomerular cytokine hypothesis and is explained by the recruitment of leukocytes (primarily macrophages), which release inflammatory mediators leading to tubular cell injury and the activation of interstitial fibroblasts.33 Our finding that interstitial but not glomerular CD163+ cell number is associated with progression may in part explain this hypothesis. On the other hand, patients with diabetes may be particularly vulnerable to insults that may damage the tubulointerstitial area, including ischemia, toxins, and infections.35
Due to the low number of patients, we could not perform multivariate regression analysis to determine whether the association between the number of interstitial CD163+ cells and kidney progression was independent of other factors, such as baseline kidney function and other histological findings. We do not have data on serial biopsy results, which would provide an opportunity to analyze associations between macrophage counts and activity and chronicity scores or between macrophage counts and responses to therapies in a longitudinal manner. Our method of cell count was semi-quantitative, while some previous studies used digital computational image softwares.10,11,20,29 Thus, the cell numbers in the present study may be underestimated. Indeed, median cell number in previous studies appear to be higher than the present study.(Dias Bos) The treatments used for patients were not standardized, and previous drug exposure may have affected macrophage polarization.36 Moreover, quantification of macrophage densities in native kidney biopsies was shown to contribute to risk stratification for progression to end-stage kidney disease irrespective of the primary kidney disorder37; thus, macrophage plasticity may not be specific to SLE. However, we observed differences in macrophage counts between diabetic nephropathy and lupus nephritis with similar chronicity. The strengths of our study include that it is the first paper to show a significant association between the number of CD163+ cells in the kidney interstitium determined by immunohistologic analysis and kidney disease progression. Our proposal to study this association among patients with stage III-IV LN is intriguing and would add much to the literature if our results could be confirmed.
ConclusionA greater number of CD163+ cells in the kidney interstitium was associated with the progression of kidney disease in patients with LN, while a greater number of CD68+ cells in the interstitium was associated with progression in the subgroup of patients with class III–IV LN. Our results may contribute to ongoing studies evaluating macrophages as potential disease modulators and therapeutic targets during the course of LN.
Ethics approvalThis study was approved by the Ethics Committee.
Informed consentInformed consent was not obtained due to the retrospective study design.
Consent for publicationNot applicable.
Research involving human participants and/or animalsThe authors certify that the study was performed in accordance with the ethical standards as laid down in the 1964, Declaration of Helsinki, and its later amendments or comparable ethical standards.
FundingNone.
Conflict of interestThe authors declare no conflict of interest.
Data availabilityCondensed anonymized data are available from the corresponding author on reasonable request.
The followings are the supplementary data to this article:


