


Diabetic nephropathy (DN) is a major cause of chronic kidney disease, influenced by genetic and inflammatory factors. SNPs in NLRP1 and NLRP3 genes, key regulators of inflammation, may contribute to DN susceptibility, offering insights into its pathogenesis and potential therapeutic targets. This study aims to investigate the association between single nucleotide polymorphisms (SNPs) in NLRP1 and NLRP3 genes and the susceptibility to diabetic nephropathy.
MethodsThis cross-sectional study was conducted on 192 subjects, comprising 96 DN patients and 96 healthy controls. Diabetic nephropathy was diagnosed with albumin creatinine ratio in urine. Genotyping of SNPs rs878329 in NLRP1 and rs10754558 in NLRP3 was performed using the TaqMan® Allelic Discrimination assay.
ResultsSignificant differences were found in the distribution of both rs878329 and rs10754558 genotypes between cases and controls. The GG genotype of rs878329 and the CG genotype of rs10754558 were significantly more prevalent among DN patients (p=0.002 and p=0.005, respectively). Allelic analysis revealed a higher frequency of the G allele in both SNPs among DN cases (p=0.001 and p=0.002, respectively).
ConclusionOur study supports the involvement of NLRP gene polymorphisms in the pathogenesis of DN, potentially offering new insights into genetic predispositions to this condition.
La nefropatía diabética (ND) es una causa mayor de enfermedad renal crónica, en la que influyen factores genéticos e inflamatorios. Los polimorfismos de nucleótido único (SNP) en los genes NLRP1 y NLRP3, reguladores clave de la inflamación, pueden contribuir a la susceptibilidad a la ND, ofreciendo una perspectiva sobre su patogenia y los objetivos terapéuticos potenciales. El objetivo de este estudio es investigar la asociación entre los SNP en los genes NLRP1 y NLRP3 y la susceptibilidad a la nefropatía diabética.
MétodosEste estudio transversal se llevó a cabo en 192 sujetos, e incluía 96 pacientes de ND y 96 controles sanos. La nefropatía diabética fue diagnosticada mediante el ratio albúmina:creatinina en orina. La genotipificación del SNP rs878329 en NLRP1 y rs10754558 en NLRP3 se realizó utilizando el ensayo TaqMan® Allelic Discrimination.
ResultadosSe encontraron diferencias significativas en la distribución de los genotipos rs878329 y rs10754558 entre los casos y los controles. El genotipo GG de rs878329 y el genotipo CG de rs10754558 fueron significativamente más prevalentes entre los pacientes de ND (p=0,002 y p=0,005, respectivamente). El análisis alélico reveló una frecuencia más elevada del alelo G en ambos SNP entre los casos de ND (p=0,001 y p=0,002, respectivamente).
ConclusiónNuestro estudio respalda la implicación de los polimorfismos del gen NLRP en la patógena de la ND, ofreciendo potencialmente nuevas perspectivas a las predisposiciones genéticas a esta condición.
Diabetic nephropathy (DN), a chronic kidney disease caused by diabetes mellitus (DM), is a significant public health issue and a major microvascular complication of diabetes. Globally, the prevalence of diabetes in adults was approximately 8.8% in 2015 and the latest IDF Diabetes Atlas (2025) reports that 11.1% – or 1 in 9 – of the adult population (20–79 years) is living with diabetes, with over 4 in 10 unaware that they have the condition.1–3 DN contributes substantially to the global burden of CKD and accounts for 30–40% of end-stage renal disease (ESRD) cases in the United States.4 Patients with DM are ten times more likely to develop ESRD, and DN alone affects approximately 40% of diabetic individuals.5 The disease is characterized by progressive glomerulosclerosis and tubulointerstitial fibrosis, leading to renal failure.6
Diabetic kidney disease, often referred to as diabetic nephropathy or CKD caused by diabetes, is characterized in both type 1 and type 2 diabetes by sustained severe albuminuria exceeding 300mg per 24h (or more than 200μg/min), or an albumin-to-creatinine ratio (ACR) greater than 300mg/g. This diagnosis requires confirmation in at least two out of three tests and is typically accompanied by diabetic retinopathy in the absence of other renal disorders.7
DN is a multifactorial disease with contributions from glycaemic control, hemodynamic factors, and genetic predisposition.8 While family-based studies indicate familial clustering of DN, identifying definitive genetic contributors remains challenging due to inconsistent results and poor replicability. Unlike well-established genetic links for other kidney-related conditions, such as apolipoprotein L1 (APOL1) mutations, no clear genetic determinant has been universally validated for DN.9
The NLRP (NOD-like receptor family pyrin domain-containing) gene family, including NLRP1 and NLRP3, encodes key inflammasome components involved in immune regulation and inflammatory responses. Mutations or single nucleotide polymorphisms (SNPs) in these genes have been implicated in autoimmune diseases, infections, and chronic inflammatory conditions such as gout, Crohn's disease, and type 2 diabetes.10 Emerging evidence suggests that SNPs in NLRP genes may contribute to DN pathogenesis by promoting inflammasome activation, which exacerbates renal inflammation and fibrosis.11
The NLRP gene family encodes intracellular proteins that serve as central components of the inflammasome, a multiprotein complex critical for innate immunity. These proteins, particularly NLRP3, function as sensors for cellular stress and danger signals. Upon activation, they assemble the inflammasome, triggering caspase-1 activation and the maturation of pro-inflammatory cytokines such as interleukin-1β (IL-1β) and IL-18. These cytokines amplify inflammatory responses, playing pivotal roles in chronic disease progression, including DN.12 NLRP1 is similarly implicated in regulating inflammation and immune responses, making it a potential target for modulating autoimmune disorders.13
Role of NLRP gene polymorphisms in DN remains poorly understood, despite evidence linking inflammasomes to chronic inflammation and autoimmune diseases. Therefore, this study aims to fill this gap by exploring the association between NLRP gene SNPs and diabetic nephropathy, alongside their relation with clinical and laboratory findings.
Patients and methodsDesign and populationThis cross-sectional study conducted at Medical Biochemistry and Molecular Biology Department, Faculty of Medicine, Menoufia University during the period from July 2023 to July 2024.
Patient selectionPatients diagnosed to have diabetic nephropathy by albumin creatinine ratio more than 300mg/g in two occasions in early morning sample.
All participants were under 18 years, while participants who had ESRD, chronic liver or gastrointestinal diseases, heart failure, cancer, or any other chronic illness were excluded.
Ethical approvalThe study was approved by the IRB of Faculty of Medicine, Menofia University (Approval Number: 7/2023-BIO 14–2). Written informed consent was obtained from all participants.
MethodsPatients were subjected to the following:
A comprehensive data collection was obtained from each participant involving age, gender, smoking status, and DM family history. Also, thorough general and clinical examinations were obtained. Laboratory investigations were performed for all subjects, laboratory investigations including renal, hepatic functions, iron profile, lipid profile, mineral including Ca and PO4, and hormonal parameters (PTH). Renal imaging (renal ultrasound and KUB X-ray).
Renal functionRenal function was assessed through the determination of urea levels (mg/dL) using the Urease–Berthelot enzymatic colorimetric kit (Ref 1156015, Linear Chemicals, Spain) and creatinine levels (mg/dL) via the Jaffe colorimetric method (Ref PPI1445A01, Atlas Medical, Germany). Rate of glomerular filtration (GFR, mL/min/1.73m2) was calculated by the CKD-EPI (Chronic Kidney Disease Epidemiology Collaboration) equation.
Liver enzyme activityLiver enzyme activity, including aspartate aminotransferase (AST, IU/L) and alanine aminotransferase (ALT, IU/L), was measured using AST and ALT activity assay kits (Refs MAK055 and MAK052, Sigma Aldrich, USA).
Lipid profileThe lipid profile included triglycerides (mg/dL), total cholesterol (mg/dL), and HDL/LDL cholesterol fractions (mg/dL), determined via colorimetric assay kits (Refs 10010303, CaymanChem, USA; MA-TC, RayBiotech, USA; and MAK331, Sigma–Aldrich, USA, respectively).
Sample collectionFive milliliters of venous blood were drawn from each participant via venipuncture from the cubital vein and processed as follows: 2mL were placed in EDTA-containing tubes for NLRP1 gene genotyping, while the remaining 3mL were collected in additive-free vacutainer tubes, centrifuged at 3000rpm for 10min, and the separated sera were aliquoted for lipid profile analysis.
SNP genotyping of NLRP1 (rs878329) and NLRP3 (rs10754558) is conducted using the TaqMan® Allelic Discrimination (AD) assay, a multiplexed, endpoint PCR technique that identifies variants of a single nucleic acid sequence. This method utilizes two primer/probe pairs to genotype the two possible variants at a specific SNP site, without quantifying the target sequence. Samples are categorized as homozygotes (possessing either allele 1 or 2 exclusively) or heterozygotes (possessing both allele 1 and 2).
Reaction preparationGenomic DNA is extracted from EDTA-treated blood samples using the Gene JET™ Whole Blood Genomic DNA Purification Mini Kit. The method involves digesting samples with Proteinase K in a lysis solution, followed by mixing the lysate with ethanol. The mixture is added to a silica membrane in a purification column, allowing the DNA to bind while impurities are washed away. Genomic DNA is then eluted using a low ionic strength buffer.
ProcedureGenomic DNA extraction involves adding ethanol to wash buffers, then mixing 200μl of whole blood with lysis solution and Proteinase K, followed by incubation at 56°C for 10min. Ethanol is added to the lysate, which is then transferred to a purification column for centrifugation. The column undergoes sequential washing with Wash Buffers I and II, followed by centrifugation and transfer to a microcentrifuge tube. DNA is eluted using 100μl of Elution Buffer, incubated, and centrifuged. The purified DNA is then stored at −20°C.
Detection of SNPsThe SNP detection process utilizes Universal TaqMan Master Mix, which includes Hot Start Taq DNA polymerase, dNTPs, and optimized PCR buffer. The SNP assay kit for rs878329 includes TaqMan genotyping primers and probes. The forward primer sequence is 5′-CCGGGCTGCATCAACCTTCT-3ʹ, and the reverse primer sequence is 5′-GCCCCAACCACCAACATGAGAC-3ʹ. The VIC/FAM probes target the SNP with sequences (CTCAACCCCCAATTCAACTTTTGTG[C/G]TCATCTCCAACCCAGTCATGAGGCT). While, SNP assay kit for rs10754558 includes TaqMan genotyping primers and probes. The forward primer sequence is 5′-CAGGACAATGACAGCATCGGGTGTTGAT-3ʹ, and the reverse primer sequence is 5′-GCTGCCATAAAATTTCAACATAA-3ʹ. The VIC/FAM probes target the SNP with sequences (GACAATGACAGCATCGGGTGTTGTT[C/G]TCATCACAGCGCCTCAGTTAGAGGA). Each probe contains a 5′ reporter dye and a 3′ non-fluorescent quencher, enabling fluorescence-based allele detection during PCR. Taq polymerase cleaves hybridized probes, separating the quencher and reporter dyes, producing fluorescence proportional to the amplification of specific alleles.
Reaction setup and thermal cycling conditionsA 20μl reaction mix includes 10μl TaqMan Master Mix, 1.25μl SNP assay kit, and 3.75μl nuclease-free water, mixed thoroughly. Each reaction receives 5μl of genomic DNA (0.1μg/μl), with negative controls using DNAse-free water. Samples are briefly centrifuged and analyzed using the 7500 Real-Time PCR System under specific thermal cycling parameters, starting with an initial denaturation at 95°C for 10min. This is followed by 45 cycles of 95°C for 15s and 60°C for 1min (for annealing and extension), and concludes with a final step at 60°C for 1min post-PCR.
Sample size estimationDepending on previous evidence by Sun et al., who found that ZnT8A is positive in 45.00% of CC group and 25.62% of CT group. Using the Statistics and Sample Size Pro program version 6, the minimum required sample size was determined to be 190 subjects, ensuring a study power of 80% and a confidence level of 95%.14
Statistical methodsData analysis was conducted using IBM SPSS software package version 20.0 (Armonk, NY: IBM Corp, released in 2011), with qualitative data presented as number and percentage. The normality of quantitative data was assessed using the Kolmogorov–Smirnov and Shapiro–Wilk tests. Quantitative measures were detailed using range, mean, standard deviation, median, and IQR. Statistical tests applied included Chi-square for categorical variables, Student t-test and ANOVA for normally distributed quantitative variables, Mann–Whitney and Kruskal–Wallis tests for non-normally distributed variables, and ROC curves to evaluate diagnostic performance. Significance was set at the 5% level, and the Hardy–Weinberg equilibrium was checked for the sample population.
ResultsThe study included 192 participants divided into 2 groups; Group I: 96 diabetic nephropathy patients and Group II: 96 control subjects.
In this trial, demographic characteristics were comparable. Among the cases, 58.3% were male and 41.7% were female, while the control group consisted of 55.2% males and 44.8% females. The mean age of the cases is 59.36±7.85 years, slightly higher than the controls, who have a mean age of 56.98±9.55 years.
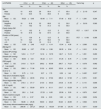
There is a substantial change in rs878329 genotypes distribution between cases and controls (p=0.008). GG genotype was notably more prevalent among cases compared to controls, whereas the CC genotype was significantly more common in controls than in cases. The CG genotype showed comparable frequencies between cases and controls. Additionally, there were significant differences in dominant and recessive genotypes, as well as allele distribution. A significantly higher percentage of cases had the CG+GG dominant genotype compared to controls (p=0.005), whereas the CG+GG recessive genotype was less frequent in cases than in controls (p=0.014). The frequency of the G allele was significantly higher in cases compared to controls (p=0.001). However, no significant difference was observed between cases and controls for the overdominant genotype (p=0.660) (Table 1).
Comparison between the two studied groups according to rs878329 and rs10754558.
| Cases(n=96) | Control(n=96) | Test of sig | p | |||
|---|---|---|---|---|---|---|
| No. | % | No. | % | |||
| rs878329 | ||||||
| Genotype | ||||||
| CC | 22 | 22.9 | 40 | 41.7 | 9.751* | 0.008* |
| CG | 41 | 42.7 | 38 | 39.6 | ||
| GG | 33 | 34.4 | 18 | 18.8 | ||
| HWp | 0.188 | 0.107 | ||||
| Dominant | ||||||
| CC | 22 | 22.9 | 40 | 41.7 | 7.718* | 0.005* |
| CG+GG | 74 | 77.1 | 56 | 58.3 | ||
| Over dominant | ||||||
| CC+GG | 55 | 57.3 | 58 | 60.4 | 0.194 | 0.660 |
| CG | 41 | 42.7 | 38 | 39.6 | ||
| Recessive | ||||||
| CC+CG | 63 | 65.6 | 78 | 81.3 | 6.008* | 0.014* |
| GG | 33 | 34.4 | 18 | 18.8 | ||
| Allele | ||||||
| C | 85 | 44.3 | 118 | 61.5 | 11.381* | 0.001* |
| G | 107 | 55.7 | 74 | 38.5 | ||
| rs10754558 | ||||||
| Genotype | ||||||
| CC | 22 | 22.9 | 43 | 44.8 | 10.383* | 0.006* |
| CG | 48 | 50.0 | 36 | 37.5 | ||
| GG | 26 | 27.1 | 17 | 17.7 | ||
| HWp0 | 0.986 | 0.062 | ||||
| Dominant | ||||||
| CC | 22 | 22.9 | 43 | 44.8 | 10.257* | 0.001* |
| CG+GG | 74 | 77.1 | 53 | 55.2 | ||
| Over dominant | ||||||
| CC+GG | 48 | 50.0 | 60 | 62.5 | 3.048 | 0.081 |
| CG | 48 | 50.0 | 36 | 37.5 | ||
| Recessive | ||||||
| CC+CG | 70 | 72.9 | 79 | 82.3 | 2.427 | 0.119 |
| GG | 26 | 27.1 | 17 | 17.7 | ||
| Allele | ||||||
| C | 92 | 47.9 | 122 | 63.5 | 9.500* | 0.002* |
| G | 100 | 52.1 | 70 | 36.5 | ||
χ2: Chi square test, FE: Fisher exact, p: p value for comparing between the studied groups, HWp0: p value for Chi square for goodness of fit for Hardy–Weinberg equilibrium (If p<0.05 – not consistent with HWE.).
There is a substantial change in rs10754558 genotypes distribution between cases and controls (p=0.006). CG genotype was significantly more prevalent in cases compared to controls, whereas the CC genotype was notably more frequent in controls (44.8%) than in cases. There were also significant differences in the dominant genotype and allele distribution. A significantly higher percentage of cases had the CG+GG dominant genotype compared to controls (p=0.001). For the G allele, cases showed a significantly higher frequency compared to controls (p 0.002). However, no significant differences were found between cases and controls for the overdominant or recessive genotypes (p values were 0.081 and 0.119, respectively) (Table 1).Cases with the CG and GG genotypes for rs878329 had a 1.9-fold and 3.3-fold elevated risk of disease development, respectively (OR=1.96, 3.33; p<0.05), indicating a substantial association between these genotypes and risk for disease. The dominant genotype (CG+GG) was related to a 2.4-fold elevated risk (OR=2.4; p<0.05), while the recessive genotype (GG) was linked to a 2.27-fold increased risk compared to CC+CG genotypes (OR=2.27; p<0.05). For alleles, the G allele conferred a 2-fold increased risk compared to the C allele (OR=2.007; p<0.05). No significant association was found for the CG overdominant genotype compared to CC+GG genotypes (p>0.05) (Table 2).
Comparison between the two studied groups according to rs878329 and rs10754558.
| Cases(n=96) | Control(n=96) | p | OR (LL–UL 95% C.I) | |||
|---|---|---|---|---|---|---|
| No. | % | No. | % | |||
| rs878329 | ||||||
| Genotype | ||||||
| CC | 22 | 22.9 | 40 | 41.7 | 1.000 | |
| CG | 41 | 42.7 | 38 | 39.6 | 0.05* | 1.962 (0.992–3.881) |
| GG | 33 | 34.4 | 18 | 18.8 | 0.002* | 3.333 (1.536–7.235) |
| HWp0 | 0.188 | 0.107 | ||||
| Dominant | ||||||
| CC | 22 | 22.9 | 40 | 41.7 | 1.000 | |
| CG+GG | 74 | 77.1 | 56 | 58.3 | 0.006* | 2.403 (1.286–4.491) |
| Over dominant | ||||||
| CC+GG | 55 | 57.3 | 58 | 60.4 | ||
| CG | 41 | 42.7 | 38 | 39.6 | 0.660 | 1.138 (0.640–2.022) |
| Recessive | ||||||
| CC+CG | 63 | 65.6 | 78 | 81.3 | ||
| GG | 33 | 34.4 | 18 | 18.8 | 0.015* | 2.270 (1.169–4.406) |
| Allele | ||||||
| C | 85 | 44.3 | 118 | 61.5 | 1.000 | |
| G | 107 | 55.7 | 74 | 38.5 | 0.001* | 2.007 (1.336–3.015) |
| rs10754558 | ||||||
| Genotype | ||||||
| CC | 22 | 22.9 | 43 | 44.8 | 1.000 | |
| CG | 48 | 50.0 | 36 | 37.5 | 0.005* | 2.606 (1.332–5.100) |
| GG | 26 | 27.1 | 17 | 17.7 | 0.007* | 2.989 (1.345–6.643) |
| HWp0 | 0.986 | 0.062 | ||||
| Dominant | ||||||
| CC | 22 | 22.9 | 43 | 44.8 | 1.000 | |
| CG+GG | 74 | 77.1 | 53 | 55.2 | 0.002* | 2.729 (1.463–5.089) |
| Over dominant | ||||||
| CC+GG | 48 | 50.0 | 60 | 62.5 | ||
| CG | 48 | 50.0 | 36 | 37.5 | 0.082 | 1.667 (0.938–2.963) |
| Recessive | ||||||
| CC+CG | 70 | 72.9 | 79 | 82.3 | ||
| GG | 26 | 27.1 | 17 | 17.7 | 0.121 | 1.726 (0.865–3.444) |
| Allele | ||||||
| C | 92 | 47.9 | 122 | 63.5 | 1.000 | |
| G | 100 | 52.1 | 70 | 36.5 | 0.023* | 1.894 (1.257–2.849) |
OR: odds ratio, ®: reference group, CI: confidence interval, LL: lower limit, UL: upper Limit, p: p value for univariate regression analysis, HWp0: p value for Chi square for goodness of fit for Hardy–Weinberg equilibrium (If p<0.05 - not consistent with HWE.).
Cases with the CG and GG genotypes for rs10754558 had a 2.6-fold and 2.9-fold elevated risk of disease development, respectively (OR=2.6, 2.98; p<0.05), indicating a significant association. The dominant genotype (CG+GG) was related to a 2.7-fold elevated risk (OR=2.729; p<0.05), and the G allele conferred a 1.89-fold increased risk compared to the C allele (OR=1.89; p<0.05). However, no significant associations were found for the CG overdominant genotype (OR=1.6) or the GG recessive genotype compared to the CC+CG phenotype (OR=1.7; p>0.05) (Table 2).
There were no significant differences between rs878329 genotypes regarding age, gender, smoking, family history of DM, duration of diabetes, BMI, blood pressure, FBS, 2hPP, HbA1c, lipid profile (cholesterol, triglycerides, LDL-C, HDL-C), serum creatinine, or urea (p>0.05). Mean age ranged from 57.5 to 60.1 years, BMI from 27.4 to 28.2, and SBP/DBP from 140.5/86.1 to 147.1/88.9. FBS varied from 188 to 214.9mg/dl, 2hPP from 307.1 to 320.7mg/dl, and HbA1c from 8.78% to 9.02%. Lipid levels and renal function were comparable. However, the spot urinary albumin/creatinine ratio was significantly higher in GG genotype cases (416.9mg/dl) compared to CC and CG genotypes (217.1 and 357.1mg/dl, respectively; p<0.05) (Table 3).
Relation between rs878329 and different parameters in cases group (n=96).
| rs878329 | CC(n=22) | CG(n=41) | GG(n=33) | Test of sig | p | |||
|---|---|---|---|---|---|---|---|---|
| No. | % | No. | % | No. | % | |||
| Sex | ||||||||
| Male | 10 | 45.5 | 26 | 63.4 | 20 | 60.6 | χ2=2.007 | 0.367 |
| Female | 12 | 54.5 | 15 | 36.6 | 13 | 39.4 | ||
| Age | ||||||||
| Mean±SD. | 57.59±6.85 | 59.66±8.13 | 60.18±8.16 | F=0.766 | 0.468 | |||
| Smoking | ||||||||
| Negative | 14 | 63.6 | 30 | 73.2 | 20 | 60.6 | χ2=1.417 | 0.492 |
| Positive | 8 | 36.4 | 11 | 26.8 | 13 | 39.4 | ||
| Family history DM | ||||||||
| Negative | 4 | 18.2 | 7 | 17.1 | 4 | 12.1 | χ2=0.482 | 0.786 |
| Positive | 18 | 81.8 | 34 | 82.9 | 29 | 87.9 | ||
| Duration of DM (years) | ||||||||
| <10 | 3 | 13.6 | 7 | 17.1 | 5 | 15.2 | χ2=5.707 | 0.222 |
| 10–15 | 16 | 72.7 | 25 | 61.0 | 15 | 45.5 | ||
| >15 | 3 | 13.6 | 9 | 22.0 | 13 | 39.4 | ||
| Mean±SD | 13.05±3.21 | 13.51±4.08 | 14.61±4.26 | H=2.551 | 0.279 | |||
| BMI (kg/m2) | ||||||||
| Mean±SD. | 28.29±3.18 | 27.89±2.53 | 27.42±3.09 | F=0.616 | 0.542 | |||
| Systolic blood pressure (mmHg) | ||||||||
| Mean±SD. | 140.5±13.79 | 142.1±14.05 | 147.1±11.32 | F=2.093 | 0.129 | |||
| Diastolic blood pressure (mmHg) | ||||||||
| Mean±SD. | 86.14±8.44 | 87.68±9.23 | 88.94±8.82 | F=0.655 | 0.522 | |||
| FBS (mg/dl) | ||||||||
| Mean±SD. | 188.0±46.06 | 214.9±76.42 | 210.9±70.48 | H=0.693 | 0.707 | |||
| 2h pp (mg/dl) | ||||||||
| Mean±SD. | 320.7±62.88 | 307.1±68.95 | 315.9±66.77 | H=0.382 | 0.826 | |||
| Hb A1C % | ||||||||
| Mean±SD. | 9.0±1.73 | 9.02±1.75 | 8.78±1.88 | F=0.183 | 0.833 | |||
| Total serum cholesterol (mg/dl) | ||||||||
| Mean±SD. | 282.4±53.49 | 267.0±59.78 | 278.8±51.21 | F=0.690 | 0.504 | |||
| Serum triglycerides (mg/dl) | ||||||||
| Mean±SD. | 223.9±34.15 | 209.8±41.91 | 220.7±38.26 | F=1.196 | 0.307 | |||
| LDL-C (mg/dl) | ||||||||
| Mean±SD. | 219.9±52.94 | 194.8±72.76 | 212.7±47.25 | H=2.746 | 0.253 | |||
| HDL-C (mg/dl) | ||||||||
| Mean±SD. | 25.77±5.72 | 27.44±6.44 | 25.82±6.17 | H=0.840 | 0.657 | |||
| Serum creatinine (mg/dl) | ||||||||
| Mean±SD. | 3.40±2.56 | 3.38±1.59 | 4.27±1.89 | H=5.435 | 0.066 | |||
| Serum urea (mg/dl) | ||||||||
| Mean±SD. | 59.50±34.90 | 55.59±24.58 | 67.18±21.80 | H=4.606 | 0.100 | |||
| Spot urinary albumin/creatinine ratio (mg/g) | ||||||||
| Mean±SD. | 217.14±196.47 | 357.12±141.94 | 416.91±89.20 | H=8.848* | 0.012* | |||
BMI: Body Mass Index, DM: Diabetes Mellitus, F: F for One way ANOVA test, FBS: Fasting Blood Sugar, HbA1c: Hemoglobin A1c, HDL-C: High-Density Lipoprotein Cholesterol, H: H for Kruskal Wallis test, LDL-C: Low-Density Lipoprotein Cholesterol, SD: Standard deviation, H: H for Kruskal Wallis test, F: F for One way ANOVA test, c2: Chi square test, p: p value for comparison between the studied categories.
There were no significant differences between rs10754558 genotypes regarding age, gender, smoking, family history of DM, diabetes duration, BMI, systolic blood pressure (SBP), FBS, 2hPP, lipid profile, serum creatinine, or urea (p>0.05). Mean age ranged from 57.4 to 60.4 years, BMI from 26.82 to 28.35, and SBP from 141.6 to 146.7. FBS ranged from 206.2 to 210.8mg/dl, 2hPP from 299.5 to 323.6mg/dl, and lipid levels showed minimal variation across genotypes. However, diastolic blood pressure (DBP) was significantly higher in GG genotype cases (91.35) compared to CC and CG genotypes (88.6 and 85.4, respectively; p<0.05). HbA1c was significantly lower in GG genotype cases (8.29%) compared to CG genotype cases (9.37%), while the urinary albumin/creatinine ratio was significantly higher in GG genotype cases (377.6mg/dl) compared to CC genotype cases (266.9mg/dl; p<0.05) (Table 4).
Relation between rs10754558 and different parameters in cases group (n=96).
| rs10754558 | CC(n=22 | CG(n=48) | GG(n=26) | Test of sig | p | |||
|---|---|---|---|---|---|---|---|---|
| No. | % | No. | % | No. | % | |||
| Sex | ||||||||
| Male | 10 | 45.5 | 29 | 60.4 | 17 | 65.4 | χ2=2.119 | 0.347 |
| Female | 12 | 54.5 | 19 | 39.6 | 9 | 34.6 | ||
| Age | ||||||||
| Mean±SD. | 59.23±8.48 | 60.46±7.11 | 57.46±8.52 | F=1.240 | 0.294 | |||
| Smoking | ||||||||
| Negative | 18 | 81.8 | 33 | 68.8 | 13 | 50.0 | χ2=5.616 | 0.060 |
| Positive | 4 | 18.2 | 15 | 31.3 | 13 | 50.0 | ||
| Family history DM | ||||||||
| Negative | 4 | 18.2 | 6 | 12.5 | 5 | 19.2 | FET=0.917 | 0.709 |
| Positive | 18 | 81.8 | 42 | 87.5 | 21 | 80.8 | ||
| Duration of DM (years) | ||||||||
| <10 | 3 | 13.6 | 6 | 12.5 | 6 | 23.1 | FET=4.148 | 0.389 |
| 10–15 | 16 | 72.7 | 27 | 56.3 | 13 | 50.0 | ||
| >15 | 3 | 13.6 | 15 | 31.3 | 7 | 26.9 | ||
| Mean±SD | 13.59±3.46 | 14.27±4.14 | 13.04±4.06 | H=2.086 | 0.352 | |||
| BMI (kg/m2) | ||||||||
| Mean±SD | 26.82±2.37 | 27.99±2.98 | 28.35±2.94 | F=1.912 | 0.154 | |||
| Systolic BP (mmHg) | ||||||||
| Mean±SD | 143.6±11.77 | 141.6±12.76 | 146.7±15.10 | F=1.291 | 0.280 | |||
| Diastolic BP (mmHg) | ||||||||
| Mean±SD | 88.64±9.41 | 85.42±8.11 | 91.35±8.78 | F=4.156* | 0.019* | |||
| FBS (mg/dl) | ||||||||
| Mean±SD. | 210.8±72.70 | 206.2±65.08 | 206.7±74.21 | H=0.078 | 0.962 | |||
| 2h pp (mg/dl) | ||||||||
| Mean±SD. | 299.5±71.96 | 313.9±62.63 | 323.6±68.93 | H=1.221 | 0.543 | |||
| Hb A1C % | ||||||||
| Mean±SD. | 8.75±1.91 | 9.37±1.79 | 8.29±1.44 | F=3.430* | 0.037* | |||
| Total serum cholesterol (mg/dl) | ||||||||
| Mean±SD. | 263.0±46.55 | 274.2±57.94 | 285.3±57.26 | F=0.974 | 0.381 | |||
| Serum triglycerides (mg/dl) | ||||||||
| Mean±SD. | 218.4±37.17 | 214.9±39.33 | 218.8±41.55 | F=0.110 | 0.896 | |||
| LDL-C (mg/dl) | ||||||||
| Mean±SD. | 188.7±55.89 | 207.9±61.11 | 219.7±63.29 | H=3.175 | 0.204 | |||
| HDL-C (mg/dl) | ||||||||
| Mean±SD. | 26.0±5.42 | 27.23±6.65 | 25.58±5.93 | H=0.870 | 0.647 | |||
| Serum creatinine (mg/dl) | ||||||||
| Mean±SD. | 3.72±2.37 | 3.56±2.03 | 3.92±1.50 | H=2.906 | 0.234 | |||
| Serum urea (mg/dl) | ||||||||
| Mean±SD. | 58.86±25.36 | 58.63±26.23 | 65.23±28.85 | H=0.962 | 0.618 | |||
| Spot urinary albumin/creatinine ratio (mg/g) | ||||||||
| Mean±SD. | 266.95±201.21 | 364.25±145.04 | 377.69±124.75 | H=6.671* | 0.036* | |||
BMI: Body Mass Index, BP: Blood Pressure, FBS: Fasting Blood Sugar, 2hr pp: 2-Hour Postprandial Glucose, HbA1c: Hemoglobin A1c, LDL-C: Low-Density Lipoprotein Cholesterol, HDL-C: High-Density Lipoprotein Cholesterol, SD: Standard deviation, H: H for Kruskal Wallis test, F: F for One way ANOVA test, c2: Chi square test, FET: Fisher Exact test, p: p value for comparison between the studied categories.
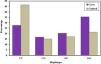
By comparing haplotype between cases and control, the results were statistically significant (p value<0.05), as a significant higher percentage of control had CC haplotype (46.4%) than among cases (27.6%), while a significant higher percentage of cases had GG haplotype (35.4%) than among control (21.4%) (Fig. 1).

The pairwise linkage disequilibrium analysis between rs878329 (SNP1) and rs10754558 (SNP2) shows significant linkage in both cases and controls (p<0.001). In cases, the disequilibrium (D=0.064, D′=0.277) and correlation (R=0.258, R2=0.066) suggest moderate linkage, while controls show slightly higher values (D=0.073, D′=0.326, R=0.312, R2=0.097), indicating stronger linkage in the control group. This suggests a genetic association between these SNPs that may vary by disease status, warranting further investigation into their role in the studied condition (Table 5).
Pair-wise linkage disequilibrium of gene polymorphisms.
| Variant 1 | Variant 2 | D | D′ | R | R2 | χ2 | p | |
|---|---|---|---|---|---|---|---|---|
| Cases | SNP 1 | SNP 2 | 0.064 | 0.277 | 0.258 | 0.066 | 12.737* | <0.001* |
| Control | SNP 1 | SNP 2 | 0.073 | 0.326 | 0.312 | 0.097 | 18.659* | <0.001* |
D: linkage disequilibrium, D′: standardization disequilibrium, R: coefficient of regression, R2: coefficient of determination, SNP1: rs878329, SNP2: rs10754558.
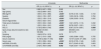
Univariate and Multivariate Logistic Regression analysis for the parameters affecting cases vs control found that increased BMI, systolic, diastolic blood pressure, serum triglyceride, cholesterol, LDL, spot urine albumin to creatinine ratio, FBS, serum creatinine, serum urea and decreased HDL were significantly affecting cases in univariate analysis, also cases with rs878329 (CG+GG) genotype and cases with rs10754558 (CG+GG) genotype had 2.4 and 2.7 times risk for affecting cases than other genotype with significant association with cases. After adjusting for variables that were significant in univariate analysis, only HDL and urinary albumin to creatinine ratio were the significant parameters affecting cases in multivariable model after controlling for other variables (OR=0.56 and 359.9 respectively) (Table 6).
Univariate and multivariate Logistic regression analysis for the parameters affecting cases vs control (n=96 vs 96).
| Univariate | Multivariate | |||
|---|---|---|---|---|
| OR (LL–UL 95%C.I.) | p | OR (LL–UL 95%C.I.) | p | |
| Sex | 0.880 (0.497–1.559) | 0.662 | ||
| Age (years) | 1.032 (0.998–1.067) | 0.062 | ||
| BMI (kg/m2) | 1.639 (1.416–1.896) | <0.001* | 0.379 (0.100–1.436) | 0.153 |
| Systolic | 1.224 (1.155–1.297) | <0.001* | 1.033 (0.818–1.306) | 0.784 |
| Diastolic | 1.232 (1.156–1.314) | <0.001* | 1.209 (0.903–1.619) | 0.202 |
| Serum triglycerides | 1.032 (1.022–1.041) | <0.001* | ||
| Total serum cholesterol | 1.033 (1.024–1.042) | <0.001* | 1.041 (0.974–1.113) | 0.232 |
| LDL-C | 1.032 (1.024–1.041) | <0.001* | 0.978 (0.937–1.021) | 0.318 |
| HDL-C | 0.726 (0.663–0.794) | <0.001* | 0.567 (0.374–0.861) | 0.008* |
| Spot urinary albumin/creatinine ratio (>18) | 44.922 (18.943–106.526) | <0.001* | 359.964 (4.04–32114.77) | 0.010* |
| Smoking | 1.048 (0.574–1.915) | 0.878 | ||
| FBS (mg/dl) | 1.021 (1.015–1.028) | <0.001* | 1.003 (0.984–1.022) | 0.755 |
| Serum creatinine | 16.165 (3.362–77.725) | 0.001* | 10.747 (0.245–471.386) | 0.218 |
| Serum urea | 1.150 (1.099–1.204) | <0.001* | 0.919 (0.735–1.148) | 0.455 |
| rs878329 (CG+GG) | 2.403 (1.285–4.491) | 0.006* | 0.517 (0.043–6.195) | 0.603 |
| rs10754558 (CG+GG) | 2.729 (1.463–5.089) | 0.002* | 7.426 (0.501–110.073) | 0.145 |
BMI: Body Mass Index, LDL-C: Low-Density Lipoprotein Cholesterol, HDL-C: High-Density Lipoprotein Cholesterol, FBS: Fasting Blood Sugar, OR: Odd‘s ratio, C.I: Confidence interval, LL: Lower limit, UL: Upper Limit, #: All variables with p<0.05 was included in the multivariate.
DN stands as a formidable challenge in the realm of chronic kidney diseases, spurred by the relentless rise of diabetes worldwide. This study delves into the genetic intricacies behind DN, focusing on the NLRP gene polymorphisms that may wield significant influence on susceptibility to this debilitating condition.
In the present study, rs878329 genotype analysis indicates a significant association with diabetic nephropathy. The GG genotype is more prevalent in cases, suggesting a risk factor, while the CC genotype is more common in controls, indicating potential protection. Significant differences are also seen in allele frequencies, with the G allele appearing more frequently in cases. However, no significant differences are observed in the overdominant genotype distribution between cases and controls. While, rs10754558 genotypes demonstrates a significant association with diabetic nephropathy. The CG genotype occurs more frequently in cases, suggesting a risk association, while the CC genotype is more common in controls, indicating a potential protective effect. There are also notable differences in allele distributions, with a higher prevalence of the G allele and the CG+GG dominant genotype in cases. However, there are no substantial changes in genotypes distributions either overdominant or recessive among controls and cases.
Similarly, La Russa et al. analyzed a cohort comprising kidney transplant recipients, dialysis patients, and individuals with CKD stages 3–5 (303 cases), along with a control group of elderly individuals (85 subjects) to investigate the association of functional variants of NLRP3-rs10754558 with a susceptibility to CKD and found that GG genotypes and G allele were substantially more frequent in cases than controls (p value<0.001), while CC and C allele were more frequent in cases than controls contracting our results.15 Also, Bai et al. revealed that rs10754558 genotype frequencies were in agreement with the HWE in patients (p value=0.19) while contrasting in controls (p value=0.77).16 This was also in accordance with Wang et al. who revealed non-significant values for HWE in both patients and controls (p value=0.21) showing normal distribution.17
Also, Martinez Valenzuela et al. involved 29 patients with renal AAV in their study to investigate serum and urine levels of IL-18 and IL-1β, as well as the impact of various single-nucleotide polymorphisms (SNPs) on kidney lesions at diagnosis and revealed non-significant values of HWE regarding both of rs878329 and rs10754558 (p values were 0.775 and 0.392, respectively) indicating normal distribution.18
For rs878329, individuals with the CG and GG genotypes have significantly increased risks of disease development, with odds ratios (OR) of 1.96 and 3.33, respectively. The CG+GG dominant genotype is associated with a 2.4-fold elevated risk, and the GG recessive genotype with a 2.27-fold elevated risk. The G allele alone is linked to a 2-fold higher disease risk compared to the C allele. However, no significant risk increase is noted for the CG overdominant genotype. Similarly, for rs10754558, the CG and GG genotypes are associated with a 2.6-fold and 2.9-fold elevated disease risk, respectively. The combined CG+GG dominant genotype shows a 2.7-fold increased risk. The G allele increases the risk by approximately 1.89 times compared to the C allele. Nonetheless, no significant associations are observed for the CG overdominant and GG recessive genotypes.
Little evidence is available regarding association of NLRP1 (rs878329) and development of DN in diabetic patients. However, Farag et al. assessed a different population, including 64 psoriasis vulgaris patients and 64 healthy controls. Their findings showed that the NLRP1 genotypes CG and GG, along with the G allele, were significantly more frequent in psoriatic patients, increasing the risk of developing psoriasis vulgaris by 4, 9, and 3 times, respectively, and were significantly associated with dyslipidemia. Similarly, the NLRP3 genotypes GC and CC, along with the C allele, were more common in psoriatic patients, elevating the risk of psoriasis vulgaris by 6, 9, and 3 times, respectively.19
In accordance, Wang et al. found that individuals with the GG and GC+GG rs10754558 genotypes had a substantially higher risk of developing T2DM, with adjusted odds ratios of 1.81 (95% CI: 1.16–2.83) and 1.40 (95% CI: 1.04–1.88), respectively.17 Also, Bai et al. found that NLRP3 rs10754558 polymorphism is linked to an increased risk of T2DM.16 Furthermore, Bala et al. found a statistically significant association between rs10754558 (C vs. G, OR (95% C.I.)=1.77 (1.21–2.58), p=0.002) and T2DM.20
Also, Zheng et al. conducted a study involving 952 T2DM patients and 871 control subjects, revealing that the NLRP3 rs10754558 polymorphism was linked to insulin resistance and an increased risk of T2DM in a Chinese population.21
Multiple studies have examined the link between NLRP3 polymorphisms and susceptibility to immune-mediated inflammatory disorders, such as rheumatoid arthritis, Crohn's disease, celiac disease, and type 1 diabetes.22–24 Ben Hamad et al. concluded that NLRP3 genetic variations have no effect on the susceptibility to rheumatoid arthritis in populations from Tunisia and France.24 However, Villani et al. identified an association between NLRP3 sequence variants and an increased risk of Crohn's disease,22 while Pontillo et al. showed that these variants play a role in the progression of T1DM and celiac disease in pediatric populations.23
In patients with diabetic nephropathy, GG genotype was associated with significantly higher urinary albumin/creatinine ratios, indicating more severe kidney impairment compared to the CC and CG genotypes. This suggests the GG genotype may exacerbate kidney damage in these patients.
Moderately elevated albuminuria, referred to as microalbuminuria, is a predictor of both progressive renal function decline leading to diabetic nephropathy and increased cardiovascular morbidity and mortality. Higher levels of albuminuria correlate with a greater risk of renal and cardiovascular complications,25 GG genotype and increased albuminuria association highlights the potential of rs878329 as a genetic marker for identifying individuals at higher risk of rapid progression in diabetic nephropathy.
For the rs10754558 genotypes in diabetic nephropathy patients, GG genotype exhibited significantly higher diastolic blood pressure and urinary albumin/creatinine ratios, indicating more severe kidney impairment. Additionally, HbA1c levels were notably lower in GG genotype cases, suggesting an influence of this genotype on metabolic control and kidney function severity.
Since DN is characterized by persistent albuminuria and a progressive decline in renal function26 and the presence of albuminuria is associated with an elevated risk of cardiovascular disease and progressive kidney disease,27 GG genotype and increased albuminuria association highlights the potential of rs878329 as a genetic marker for identifying individuals at higher risk of rapid progression in diabetic nephropathy.
By comparing haplotype between cases and control, the results were statistically significant (p value<0.05), as a significant higher percentage of control had CC haplotype (46.4%) than among cases (27.6%), while a significant higher percentage of cases had GG haplotype (35.4%) than among control (21.4%). Differences in haplotype distribution suggest a genetic basis for disease susceptibility (GG haplotype) and protection (CC haplotype). These findings contribute to understanding the genetic architecture of the disease and could pave the way for personalized medicine approaches, targeting specific genetic profiles for prevention or treatment.
The pairwise linkage disequilibrium analysis between rs878329 and rs10754558 shows significant genetic linkage in both diabetic nephropathy cases and controls. The linkage is moderate in cases and stronger in controls, suggesting a variable genetic association with the disease. This finding warrants further investigation into the potential roles of these SNPs in disease mechanisms.
In a logistic regression analysis comparing factors between diabetic nephropathy cases and controls, increased BMI, blood pressure, lipid levels, and kidney function markers were significant in univariate analysis. Notably, individuals with CG+GG genotypes of rs878329 and rs10754558 had over twice the risk of being cases. However, in the multivariate model, only HDL and the urinary albumin to creatinine ratio remained significant predictors, underscoring their independent impact on the likelihood of developing the disease.
This study is limited by its cross-sectional design, which precludes establishing causality between NLRP gene polymorphisms and diabetic nephropathy. Additionally, the analysis did not account for patients with albuminuria without diabetes or diabetic patients without albuminuria, which may affect the interpretation of genetic associations. Future prospective studies are warranted to assess whether individuals carrying risk genotypes experience different disease progression trajectories, independent of baseline clinical status.
ConclusionOur study supports the involvement of NLRP gene polymorphisms in the pathogenesis of DN, potentially offering new insights into genetic predispositions to this condition. Clinically, these polymorphisms may serve as potential genetic biomarkers for early identification of individuals at higher risk for developing DN. Incorporating SNP screening into routine diabetes management could enable risk stratification and personalized follow-up, paving the way for targeted preventive strategies and closer renal monitoring in genetically predisposed patients.
Informed consentAll authors consent to publish this study.
FundingThis research did not receive any specific grant from funding agencies in the public, commercial, or not-for-profit sectors.
Conflict of interestNone to be declared.
Data availabilityThe data underlying this article will be shared on reasonable request to the corresponding author.
Not applicable.