

There are different strategies to analyze mortality in peritoneal dialysis (PD) with different definitions for case, event, time at risk, and statistical tests. A common method for the different registries would enable proper comparison to better understand the actual differences in mortality of our patients.
MethodsWe review and describe the analysis strategies of regional, national and international registries. We include actuarial survival, Kaplan–Meier (KM) and competitive risk (CR) analyses. We apply different approaches to the same database (GCDP), which show apparent differences with each method.
ResultsA total of 1890 incident patients in PD from 2003 to 2013 were included (55 years; men 64.2%), with initial RRF of 7ml/min; 25% had diabetes and a Charlson index of 3 [2–4]; 261 patients died, 380 changed to haemodialysis (HD) and 682 received a transplant. Annual mortality rates varied up to 20% in relative numbers (6.4 vs. 5.2%) depending on the system applied. The estimated probability of mortality measured by CR progressively differs from the KM over the years: 3.6 vs. 4.0% the first year, then 9.0 vs. 11.9%, 15.6 vs. 28.3%, and 18.5 vs. 43.3% the following years.
ConclusionsAlthough each method may be correct in themselves and express different approaches, the final impression left on the reader is a number that under/overestimates mortality. The CR model expresses better the reality of PD, where the number of patients losing follow-up (transplant, transfer to HD) it is 4 times more than deceased patients and only a quarter remain on PD at the end of follow up.
Existen distintas estrategias para analizar la mortalidad en diálisis peritoneal (DP), con diferentes definiciones de caso, evento, tiempo en riesgo y análisis estadístico. Un método común entre los distintos registros permitiría compararlos adecuadamente y entender mejor las diferencias reales de mortalidad de nuestros pacientes.
MétodosRevisamos y describimos las estrategias de análisis de los registros autonómicos, nacional e internacionales. Incluimos análisis de supervivencia actuarial, Kaplan–Meier (KM) y riesgos-competitivos (RC). Aplicamos los diferentes enfoques a la misma base de datos (GCDP), lo que permite mostrar las diferencias aparentes con cada método.
ResultadosSe incluyeron 1.890 pacientes incidentes en DP en el periodo 2003-2013 (55 años; 64,2% varones), con FRR inicial de 7ml/min; el 25% presentaba diabetes y un índice de Charlson de 3 [2–4]. Fallecieron 261 pacientes, 380 pasaron a hemodiálisis (HD) y 682 recibieron trasplante. Las tasas de mortalidad anual llegan a variar hasta un 20% en números relativos (6,4 vs. 5,2%) según el sistema aplicado. La estimación de probabilidad de mortalidad por RC es inferior a KM en todos los años: 3,6 vs. 4,0% el 1.er año; 9,0 vs. 11,9%; 15,6 vs. 28,3% y 18,5 vs. 43,3% los siguientes.
ConclusionesAunque cada método pueda ser correcto en sí mismo y expresar diferentes enfoques, la impresión final que queda en el lector es un número que sobrestima la mortalidad. El modelo de RC expresa mejor la realidad en DP, donde el número de pacientes que pierden seguimiento (trasplante, paso a HD) cuadruplica al de los fallecidos y solo una cuarta parte continúa en DP al final del seguimiento.
Mortality is theoretically the simplest and the most important measure to evaluate the effect of our intervention in a patient population with chronic renal disease.1 There are many publications comparing survival between the different stages of the disease,2 etiologies, renal replacement therapy (RRT) techniques3–12 or between groups and countries.13,14 However, there is some controversy and disparity of results in publications, and this is partly due to the lack of homogeneity in case definitions, statistical analysis approaches, the management of censored patients censored and forms of description and presentation of results.15,16 Therefore, different records of patients with chronic kidney disease in RRT have tried to define a model that summarizes the various ways of measuring mortality.17, without having reached a consensus model. It would facilitate the comparison between different working groups on an important subject such as a patient who receives RRT, and more specifically, peritoneal dialysis (PD). Our analysis is intended for that purpose, which applies different methods on the same database (DB), allowing us to compare and establish a methodological discussion on the subject, for the purpose of advancing our knowledge and comprehend the information available in this field.
Material and methodsThe Peritoneal Dialysis Center Group (GCDP) presents a descriptive DB analysis that we have generated from a prospective data collection since 2003, as described in previously published.18 We analyzed data from 1890 patient incidents in PD from 22 centers grouped in the territory of the communities of Madrid, Castilla-Leon, Castilla-La Mancha, Extremadura and Aragon.
The information is collected on an anonymous DB, with design, management and approved analysis by a scientific committee that was independent of companies that support the project analysis. Patients consent to inclusion on entering in PD. Statistical analysis was carried out by SPSS v. 15.0 and STATA v12 for CR analysis.
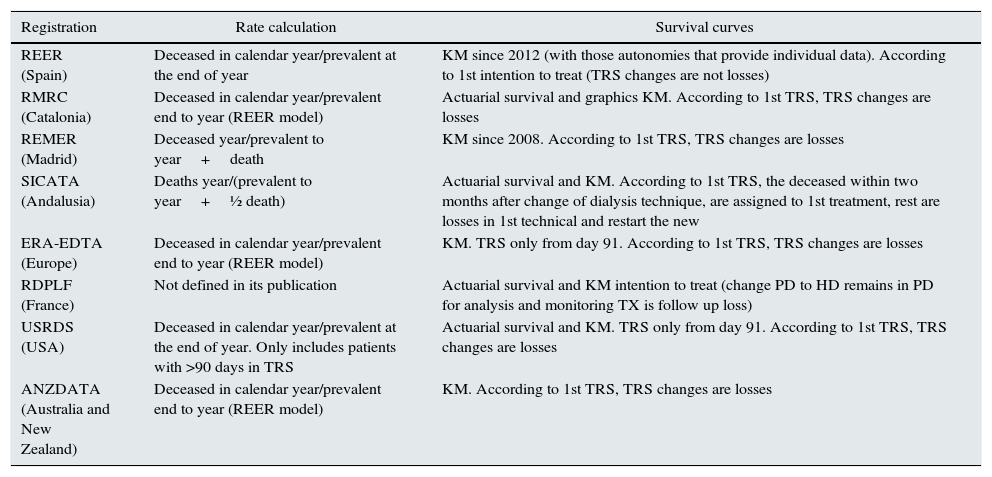
We conducted a first descriptive analysis of the population in line with what was previously published.18 The second part of the study focuses on the mortality calculation in the last 7 years (2007–2013) using the methodology referred in various groups and regional, national and international registers (see Table 1) to compare and evaluate the reasons for the disparity.
Registers and mortality calculation.
| Registration | Rate calculation | Survival curves |
|---|---|---|
| REER (Spain) | Deceased in calendar year/prevalent at the end of year | KM since 2012 (with those autonomies that provide individual data). According to 1st intention to treat (TRS changes are not losses) |
| RMRC (Catalonia) | Deceased in calendar year/prevalent end to year (REER model) | Actuarial survival and graphics KM. According to 1st TRS, TRS changes are losses |
| REMER (Madrid) | Deceased year/prevalent to year+death | KM since 2008. According to 1st TRS, TRS changes are losses |
| SICATA (Andalusia) | Deaths year/(prevalent to year+½ death) | Actuarial survival and KM. According to 1st TRS, the deceased within two months after change of dialysis technique, are assigned to 1st treatment, rest are losses in 1st technical and restart the new |
| ERA-EDTA (Europe) | Deceased in calendar year/prevalent end to year (REER model) | KM. TRS only from day 91. According to 1st TRS, TRS changes are losses |
| RDPLF (France) | Not defined in its publication | Actuarial survival and KM intention to treat (change PD to HD remains in PD for analysis and monitoring TX is follow up loss) |
| USRDS (USA) | Deceased in calendar year/prevalent at the end of year. Only includes patients with >90 days in TRS | Actuarial survival and KM. TRS only from day 91. According to 1st TRS, TRS changes are losses |
| ANZDATA (Australia and New Zealand) | Deceased in calendar year/prevalent end to year (REER model) | KM. According to 1st TRS, TRS changes are losses |
PD: peritoneal dialysis; HD: haemodialysis; KM: survival methods by Kaplan–Meier curves; TRS: renal replacement therapy; TX: transplant.
Next, it expounds the main methods for estimating mortality in a population, describing their advantages and disadvantages.
Density of mortalityIt is calculated as the number of deaths in a year (usually a calendar year) divided by the total amount of time at risk. Each patient provides his follow up time during the year. For example, a patient who does not die during the year and begins on 1 July provides 6 months and a patient that we monitor for 6 months until transferred and later the follow up is lost also provides this time. Data is expressed in deaths per patient-years. For example, 10 deaths in a group that accumulate 200 patient years at risk, can be expressed as 0.05 deaths/year-patient or 5 deaths/100 patient-years, which is reduced to 5% per year at risk. This method presents a mortality density during the time period. The validity of the estimate clearly depends on the number of follow up patients lost and that these are distributed randomly, with equal risk than those who persist on the database.
MortalityThis index is calculated as the number of deaths during the year (usually calendar) divided by patients at risk. Some records assume that the prevalence of patients is stable for one year and the average is very similar to an ordinary day (for example, the previous year). Therefore, it is calculated by dividing all the deceased during the year by the end of year point prevalence. This approach is used by the Catalan register,19 among others, and is more accurate for large populations with few fluctuations and low mortality, such as general population studies. Other records use similar formulas to estimate patients at risk, adding patients who died, in the denominator (REMER registry),20 or by calculating the average prevalence of the period, i.e. the average number of patients at the beginning and end of each year (Andalusian registry).21
Actuarial survivalActuarial survival calculates the survival probability per each year from the initiation of PD. It collects follow up time for each patient in fixed intervals (usually annual) and estimates the survival probability as the conditional probability for each time interval. With this method, we can also calculate the average incident rate per year (e.g. at 8 years’ follow-up). This method is used by the French PD registry (RDPLF).22
Kaplan–Meier survival probabilityIt calculates the cumulative survival probability during a given period of follow up. The model works with a dichotomous variable: death or free event at the end of follow up event. Monitoring is considered lost in patients whose follow up is interrupted for another reason: transplantation, change to haemodialysis (HD), transfers to another center or recovery of renal function. These patients provide their follow-up to the last event prior its patient follow up loss and subsequently are removed from the analysis. This is the model used by the EDTA23 register and by the French kidney disease register (REIN),24 among others. In 2012, the REER began to introduce this type of analysis by grouping several records from different regions that share the information of individual data. In the case of change of HD to PD or vice versa, the Andalusian record assigns death to the first technique if it occurs within the first 2 months after the change.21 The median of the time period is the most used index and corresponds to the period time in which survival probability is 50% or less. This method has some limitations, such as the assumptions that the risk is constant over time, something that is not always true. The quality of the estimation depends on few losses during the follow up with an uniform distribution through time and if they are independent from the event of interest.
Some studies show the cumulative mortality curve, which is the complementary of survival.
A multiple decrement model for evaluating competing risks (CR)It estimates probability of survival by taking into account possible competitive events (CE). In this analysis, we consider as CE renal function recovery, transplantation and transfer to HD, because these situations modify survival probability. In general, the prognosis is better in transplant patients than in HD. The model works with 2 types of events, the main event (deceased) and competitive (TX outputs, HD or recovery of renal function). The remaining patients who do not complete their follow up are considered lost. This model assumes that the various outputs are independent of each other. The analysis is presented as two cumulative event curves, one for competitive events and another for mortality.
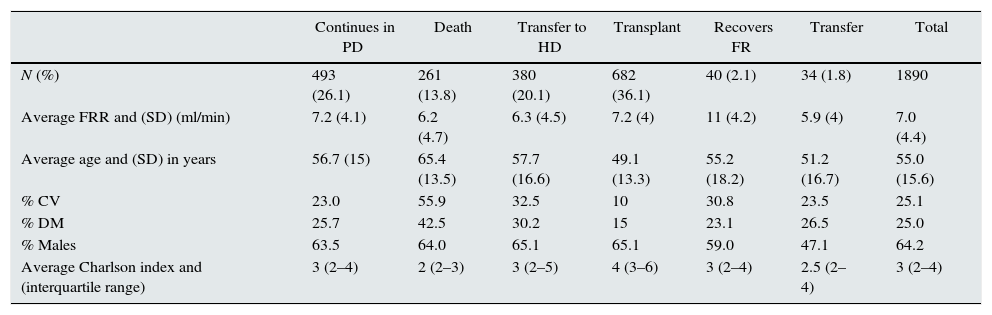
ResultsIt included 1890 patients with an overall follow up time of 3.633 years, with an average follow up of 1.92 years/patient (range 1 month to 10.5 years). At the end of follow up there were 261 deaths (13.8%), 380 transfers to HD (20.1%), 682 receive a renal transplant (36.1%), 40 recover renal function (2.1%). Thirty four patients were transferred to other centers external to GCDP (1.8%). Finally, the remaining 493 patients continue in PD (26.1%).
The descriptive analysis of the population is summarized in Table 2; it compares the characteristics of different groups of patients classified according to their situation at the end of follow-up. Age, gender distribution and comorbidity associated with Charlson index, diabetes mellitus and cardiovascular events before initiation of PD and residual renal function are shown in Table 2.
Description of population according to type of output.
| Continues in PD | Death | Transfer to HD | Transplant | Recovers FR | Transfer | Total | |
|---|---|---|---|---|---|---|---|
| N (%) | 493 (26.1) | 261 (13.8) | 380 (20.1) | 682 (36.1) | 40 (2.1) | 34 (1.8) | 1890 |
| Average FRR and (SD) (ml/min) | 7.2 (4.1) | 6.2 (4.7) | 6.3 (4.5) | 7.2 (4) | 11 (4.2) | 5.9 (4) | 7.0 (4.4) |
| Average age and (SD) in years | 56.7 (15) | 65.4 (13.5) | 57.7 (16.6) | 49.1 (13.3) | 55.2 (18.2) | 51.2 (16.7) | 55.0 (15.6) |
| % CV | 23.0 | 55.9 | 32.5 | 10 | 30.8 | 23.5 | 25.1 |
| % DM | 25.7 | 42.5 | 30.2 | 15 | 23.1 | 26.5 | 25.0 |
| % Males | 63.5 | 64.0 | 65.1 | 65.1 | 59.0 | 47.1 | 64.2 |
| Average Charlson index and (interquartile range) | 3 (2–4) | 2 (2–3) | 3 (2–5) | 4 (3–6) | 3 (2–4) | 2.5 (2–4) | 3 (2–4) |
CV: cardiovascular events; SD: standard deviation; DM: diabetes mellitus; RRF: residual renal function.
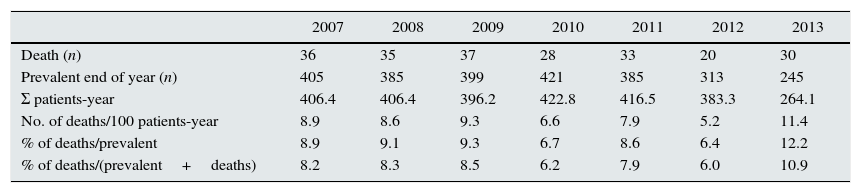
It is analyzed an incident population since 2003, so that during the early years there is a very low mortality rate when compared to prevalent, obtaining biased mortality data. Therefore, it was decided to perform the analysis of mortality from 2007 to 2013, inclusive, when the proportions have been balanced.
In Table 3 it is shown number of deaths and prevalents at the end of the year, accumulated time and mortality rates and lethality, according to the different methods revised.
Rates and percentages.
| 2007 | 2008 | 2009 | 2010 | 2011 | 2012 | 2013 | |
|---|---|---|---|---|---|---|---|
| Death (n) | 36 | 35 | 37 | 28 | 33 | 20 | 30 |
| Prevalent end of year (n) | 405 | 385 | 399 | 421 | 385 | 313 | 245 |
| Σ patients-year | 406.4 | 406.4 | 396.2 | 422.8 | 416.5 | 383.3 | 264.1 |
| No. of deaths/100 patients-year | 8.9 | 8.6 | 9.3 | 6.6 | 7.9 | 5.2 | 11.4 |
| % of deaths/prevalent | 8.9 | 9.1 | 9.3 | 6.7 | 8.6 | 6.4 | 12.2 |
| % of deaths/(prevalent+deaths) | 8.2 | 8.3 | 8.5 | 6.2 | 7.9 | 6.0 | 10.9 |
In the mortality analysis through KM method (Fig. 1A) the median survival is 6.4 years (95% CI: 5.9–7.0).
 Cumulative incidence calculated by the Kaplan–Meier method. (B) Incidence. Cumulative mortality estimated using the method of multiple decrements. It shows the number of patients at risk at the bottom of the figure. Cumulative mortality through both methods is shown in the table.")
Fig. 1B shows the results obtained using the multiple decrement method, that calculates the mortality by evaluating competing risks (transfer to HD, transplantation, renal function recovery).
When comparing both methods (KM vs. CR), we observed that cumulative mortality is similar in the first year. In the KM analysis, this percentage increases more rapidly than in the CR model, thus overestimating mortality.
DiscussionOur paper aims to highlight the disparity between results obtained with different mortality analysis methods in PD.25 Each method is correct in itself and tries to reflect mortality, but does not express the same and transmits a different message to the reader and hinders comparison between publications. Performing these analyses on the same DB, that has been proven to be reliable and proven to, helps to understand the methodological details of these differences. For example, in 2012 rates vary from 5.2 to 6.4% depending on the method; this represents a difference greater than 20%.
In analyses performed by our group over 10 years, we observed differences in estimation of the mortality rates in early years, because the incident patients prevail over the prevalent.20,21 This difference disappears from 2006, and rates remain stable when the initial effect of higher survival rate of incident patients is no longer present.20,21
There are some limitations in the way that REER calculates the mortality rate.26 This record assumes that the population at risk is constant throughout the follow up time and, therefore, is the same as the last day of the year on average. This may not be so in programs in growth or decrease, because it generates more errors when the sample is smaller and greater the proportion of deaths. It can also be significantly affected by high transplantation rates (as in the Autonomous Community of Madrid). Therefore, it does not seem to be an appropriate way to calculate mortality, especially in small samples such as a particular nephrology service, where there may be excessive fluctuations in consecutive years. Our recommendation is to calculate the actual time at risk for each patient and reduce the rate per patient-year.
The mortality analysis through KM is complete and descriptive, but we should bear in mind that it should meet the conditions for the application of the method. The death risk for our patients tends to be lower at the beginning, and the model requires that this risk is uniform over time in PD. Also, there is a crucial percentage of PD outputs with living patients. For example, in our study and after 10 years follow up, the proportion of patients considered lost (TX, transfer to HD, renal function recovery) quadruples patient deaths (1162 vs. 261). Most records report PD distribution outputs in three thirds, nearly the same as death, transplants and change to HD.25 However, in our group, the TX represent more than 50% of total PD program outputs. At the end of our follow up more than half of our patients are follow up losses, without reaching death event. Therefore, Kaplan–Meier analysis may not express an accurate impression.
CR model proposed here, analyses these situations differently and better reflects what is happening with our patients. In this model, these patients lost differ according to their output (TX, HD, renal function recovery) establishing each as an independent event that competes with the rest. Thus, it is expected that transplant patients had a less life-threatening risk than those who transfer to HD, which can thus explain the differences in the TX/HD relationship between analysis using KM or CR.
Despite being the best suited model from our point of view, there are also some limitations in the analysis carried out. The first is the lack of follow-up when the patient abandons the technique, unable to determine the evolution of each one of them. For example, there are situations where certain terminally ill patients are transferred to HD and die a few weeks or months later. Another limitation is the actual time in the technique that the patients provide in the analyzed data. The average duration of the procedure per patient is too short (approximately 2 years) and remains stable after 10 years of DB operation. As already published in other articles of our group, this short follow up time is a consequence of the high rate of departures to TX in a population that, by demographic characteristics and privileged clinical situation, has faster access to a kidney transplant as definitive TRS.27
Finally, we must consider other factors that influence other PD mortalities in each registry.28 Aspects such as the assignment/election policy of the first RRT can affect the different profile of patients in each technique. Mandatory allocation models (e.g. Hong Kong model) or priority allocation (model PD-first) behave differently than our Free election.29 In the Spanish model, it observes a PD inclusion rate around 15% and a positive selection of younger patients and less morbidity for this technique. We must also consider the general characteristics of the population, with different ages or prevalence of obesity and diabetes mellitus, which is very relevant when compared with records from the US. Finally, as the US records exclude patients who do not survive the first 90 days of treatment, making it impossible to compare with our results. The applicability of our environment analysis of other groups or records depends on these factors, which determine the external validity of the published work.
The GCDP DB is filled in prospectively by the clinics directly responsible for patient clinical follow up, which ensures greater accuracy than those administrative forms used in other records.
ConclusionThe actual mortality in a population might seem over – or underestimated depending on the chosen method to analyze and present. This analysis, using different methods on the same DB, helps to understand these differences. Finally, it seems reasonable, given the disparity of formulas, establish a shared method for all registries to standardize a unique system for comparing information from different international registries. CR model is appropriate in situations of high rate of losses in the follow up.
Conflicts of interestThe authors declare no conflict of interest. Multicentre project funded by Baxter, Fresenius and Amgen through the Madrid Nephrology Foundation.
Please cite this article as: Janeiro D, Portolés J, Lopez-Sanchez P, Tornero F, Felipe C, Castellano I, et al. Cómo debemos analizar y describir la mortalidad de nuestros pacientes: experiencia del Grupo Centro Diálisis Peritoneal. Nefrología. 2016;36:149–155.


