
Objetivo: Analizar la relación entre la velocidad de la onda de pulso (VOP) y la presión arterial central valorada con el índice de aumento (IA) en personas hipertensas con enfermedad renal. Métodos: Se incluyeron 406 hipertensos con función renal normal y 72 con enfermedad renal. La rigidez arterial se estimó con la VOP y con el IA. Se siguieron los criterios de la Guía Europea de Hipertensión de 2007 para valorar la existencia o no de enfermedad renal. Resultados: La VOP fue 8,98 ± 2,15 y 10,17 ± 3,01 m/s (p <0,05) y el IA 30,06 ± 12,46% y 30,23 ± 12,56% (p >0,05) en hipertensos con función renal normal y con enfermedad renal, respectivamente. El análisis de regresión múltiple reveló la función renal como determinante importante de VOP, pero no del IA. Conclusión: En hipertensos con enfermedad renal la VOP está aumentada la VOP, pero no el IA. Consideramos que el IA no es una medida fiable de la rigidez arterial en hipertensos con enfermedad renal.
Objective: To analyze the relationship between pulse wave velocity (PWV) and central blood pressure evaluated by augmentation index (AIx) in hypertensive patients with kidney disease. Methods: 406 hypertensive patients with normal renal function and 72 with kidney disease. Arterial stiffness was estimated with the PWV and the AIx. We followed the 2007 European Guidelines of Hypertension criteria to assess the presence or absence of kidney disease. Results: PWV was 8.98 ± 2.15 and 10.17 ± 3.01 m/sec (p <0.05) and AIx 30.06% ± 12.46 and 30.23% ± 12.56 (p >0.05) in hypertensive patients with normal renal function and kidney disease, respectively. Multiple regression analysis showed the renal function as an important determinant of PWV, but not AIx. Conclusion: In hypertensive patients with renal disease PWV is increased, but not the AIx. We believe that the AIx is not a reliable measure of arterial stiffness in hypertensive patients with kidney disease.
INTRODUCTION
Increased arterial stiffness is associated with greater cardiovascular morbidity and mortality.1
The currently accepted gold standard for assessing arterial stiffness is the speed of the carotid-femoral pulse wave (PWV).2 This parameter is associated with age and blood pressure in all the studies carried out,3 and it is related to increased morbidity and mortality both in patients with cardiovascular disease and in healthy patients.4-6
The increase rate in central blood pressure or augmentation index (AI), defined as the ratio between the increase in central systolic blood pressure (SBP) and central pulse pressure, is an indicator of central arterial stiffness, which is related to age and arterial hypertension.3 The AI, which is technically easier to measure than the PWV, has been suggested as an alternative to assess systemic arterial stiffness.7 However, its use in the clinical practice as a comparable and interchangeable measure with the PWV is unclear. A study on diabetic patients concluded that pulse pressure and the PWV increase in people with diabetes; however, this was not associated with an increase in AI.8 Another study that compared different measures to assess arterial stiffness, including the PWV and the AI, concluded that these measures are not interchangeable in the clinical practice.9 Arterial stiffness, assessed with the PWV, increases in patients with kidney disease.10 In addition, it has been associated independently with cardiovascular events in this group of patients.11 Nevertheless, the value of the AI in this population group is not known. The aim of this study is to analyse the relationship of the PWV and the AI in hypertensive patients with kidney disease.
MATERIALS AND METHODS
Design and population
Cross-sectional descriptive study conducted in the field of primary healthcare at the La Alamedilla Research Unit. Using consecutive sampling, we included 478 patients from a population of 46,000 people from two health centres, involving 15 family doctors. The study took place from December 2006 to December 2009 in patients who were between 30 and 80 years old with a clinical diagnosis of arterial hypertension. The protocol was approved by the clinical research ethics committee of the Salamanca University Hospital, and all participants signed the informed consent form.
Variables analysed
We analysed age, gender, family history of premature vascular disease, smoking habit, diabetes mellitus, cerebrovascular disease and ischaemic heart disease.
The determination of the patients’ values for lipids, creatinine and blood glucose were carried out using a blood sample taken after at least eight hours of fasting. The determination of the microalbumin/creatinine ratio was carried out using a urine sample taken first thing in the morning. All these tests were conducted blindly at the reference laboratory.
The examinations carried out included: weight, height with an estimate of the body mass index (BMI), heart rate, waist circumference and blood pressure measured with an OMRON M7 sphygmomanometer (Omron Healthcare, Kyoto, Japan), which was certified according to the recommendations of the European Societies of Hypertension and Cardiology.12
The estimation of the glomerular filtration rate (GFR) was performed with the Modification of Diet in Renal Disease-Isotopic Dilution Mass Spectrometry (MDRD-IDMS) equation, where GFR = 175 x (serum creatinine)-1.154 x age-0.203 x (0.742 if female),13 and the Chronic Kidney Disease Epidemiology Collaboration (CKD-EPI) equation, with the following equations for Caucasian patients:14
For women with creatinine <0.7 mg/dL (62 mmol): GFR = 144 x (cr/0.7)-0.329 x (0.993)age.
For women with creatinine >0.7 mg/dL (62 mmol): GFR = 144 ? (cr/0.7)-1.209 x (0.993)age.
For men with creatinine <0.9 mg/dL (80 mmol): GFR = 141 x (cr/0.9)-0.411 x (0.993)age.
For men with creatinine >0.9 mg/dL (80 mmol): GFR = 141 ? (cr/0.9)-1.209 x (0.993)age.
The AI and the PWV were measured with the SphygmoCor System (Atcor Medical, Australia). The aortic pulse wave was determined using a sensor on the radial artery, with the patient seated with his arm resting on a rigid surface. Except for the morphology of the aortic wave, we estimated the central blood pressure (aortic), the increase in pressure, the central pulse pressure and the AI, defined as increase in the aortic systolic pressure * 100/ aortic pulse pressure. The wave of the carotid and femoral pulse was determined by estimating the delay on the ECG wave and by calculating the VOP, with the patient in the supine position. Space measurements were taken with a tape measure from the sternal fork to the carotid and femoral arteries at the sensor positions. More data on the measurement procedure have been previously published.15
This study has considered that kidney disease was present if patients had a lesion in the target organ and/or clinical kidney disease, following the criteria established in the guidelines of the European Societies of Hypertension and Cardiology12 (defined at the bottom of Table 1).
Statistical analysis
The continuous variables were expressed as mean ± standard deviation, while frequency distribution was used in the qualitative variables. The mean difference between two categories of qualitative variables was analysed with the Student’s t-test for independent samples. Pearson’s correlation coefficient was used to estimate the relationship between the quantitative variables, while the chi-square test was used to associate the qualitative variables. In the multivariate analysis, we created a step-by-step multiple linear regression model for each of the variables considered as a response or as dependent: PWV (pulse wave velocity) and AI (augmentation index). In both cases, we included the following independent variables in the method’s first step, i.e. “enter”: age,gender and heart rate. In the second step, i.e. “stepwise”, we included creatinine, microalbumin/creatinine ratio, GFR, peripheral SBP, diastolic blood pressure (DBP),peripheral mean arterial pressure (MAP), peripheral pulse pressure, waist circumference, BMI,central systolic pressure, central diastolic pressure, central pulse pressure and mean central pressure. In the hypothesis testing, we set a risk of 0.05 as the limit of statistical significance. The statistical software used was SPSS/PC+, version 17.0 (SPSS Inc., Chicago, Illinois, USA).
RESULTS
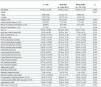
Table 1 shows the demographic, clinical and haemodynamic characteristics of the study participants. The patients with impaired renal function are older and have higher values of waist circumference, SBP in the systolic brachial artery and PWV and reduced values of HDL cholesterol. There were no differences between the two groups concerning AI.
The PWV is positively correlated with central pulse pressure (r = 0.279), central systolic pressure (r = 0.273), central MAP (r = 0.214) and creatinine (r = 0.165), while it is inversely related to the GFR, measured using the CKD-EPI equation (r = -0.209). There is no correlation with the microalbumin/creatinine ratio (r = -0.029, p = 0.713).
The AI has an inverse correlation with the GFR, measured using the CKD-EPI equation (r = -0.209), central pulse pressure (r = -0.233), creatinine (r = -0.210) and heart rate (r = -0.438), while it is positively correlated with central pulse pressure (r = 0.514), central systolic pressure (r = 0.410) and mean central pressure (r = 0.217). There is no correlation with the microalbumin/creatinine ratio (r = -0.080, p = 0.311).
In the multiple regression model (Table 2), 58.7% of the variability of the PWV was explained by age, gender, mean heart rate, peripheral SBP, waist circumference, creatinine and GFR, measured with the CKD-EPI equation. When the AI was used as the dependent variable in the same model, the parameters that assess kidney disease did not appear as determinants of the variability. Thus, 55.6% of this variability was explained by age, gender, mean heart rate, peripheral SBP, central SBP and BMI.
We also found a greater association of the AI with the female gender (B = -8.122) than the PWV (B = -2.997). Furthermore, the AI decreased by 36.6% and the PWV increased by 3.2% for each unit that increased peripheral blood pressure.
DISCUSSION
In this study, we found that PWV values are significantly higher in hypertensive patients with kidney disease than in those with normal renal function. Nevertheless, we found no differences between the two groups of patients when we used the AI as an indicator of arterial stiffness. Similarly, the variables that assess the existence of kidney disease remained in the multiple regression model, explaining the variability of the PWV. However, when the AI was used as the dependent variable in the same model, these variables disappeared as determinants of the variability.
As described in other studies,3 both the PWV and the AI are correlated with the patient’s blood pressure. Conversely, when adjusting them for age and gender, the association of blood pressure is positive with the PWV and negative with the AI, a fact that confirms the data published by other authors on patients with kidney disease.16
Several studies have already described that patients with kidney disease have higher PWV values,3,10,17 which are consistent with the findings of this study. The association of the AI with gender is greater for females than that of the PWV, as it occurs in patients with hypertension and diabetes.3
According to a recently published study by Work Raymond et al.,17 which measured the PWV in 2,564 patients with chronic kidney disease, the factors with positive association with the PWV were age, blood glucose concentrations, race, waist circumference, MAP, gender and negative association with the level of kidney function. These variables are similar to those of this study, except for the exclusion of the blood glucose level from the multiple regression model and the inclusion of the heart rate.
The heart rate had a negative correlation with the AI in hypertensive patients, a fact that has been described extensively in patients with kidney disease,18 but not so with the PWV. According to the review published in 2009 by Cecelja et al.,3 heart rate may be associated differently with parameters that evaluate arterial stiffness.
Finally, in a study published by Temmar et al.,19 which assessed arterial stiffness and the presence of arterial calcifications using the PWV, it is concluded that vascular stiffness and vascular calcification, measured using the PWV, appear soon in patients with chronic kidney disease. Nevertheless, only vascular calcification worsens as the disease progresses.
To conclude, arterial stiffness is greater in hypertensive patients with kidney disease measured by PWV. However, kidney disease was not associated with arterial stiffness when it was measured with the AI. This confirms that the two measures used to assess stiffness in the clinical practice are not interchangeable in this group of patients, as it has been demonstrated in hypertensive and diabetic patients.8,9
In the light of this data, kidney disease may be another confounding factor when using the AI as a substitute for measuring arterial stiffness. This supports the findings that indicate that the PWV is the only index of arterial stiffness that is independently associated with the cardiovascular morbidity and mortality results in patients with kidney disease.11
Finally, we believe that further studies are required to establish the relative strength of the prediction of cardiovascular risk with each of these two measures and to evaluate whether their joint implementation brings any additional benefits.

Table 1. Demographic, anthropometric and haemodynamic characteristics of the 478 patients studied

Table 2. Multiple Regression Analysis